












Satellites Reveal the Thirst of Fields and Forests
By Sean Keefe
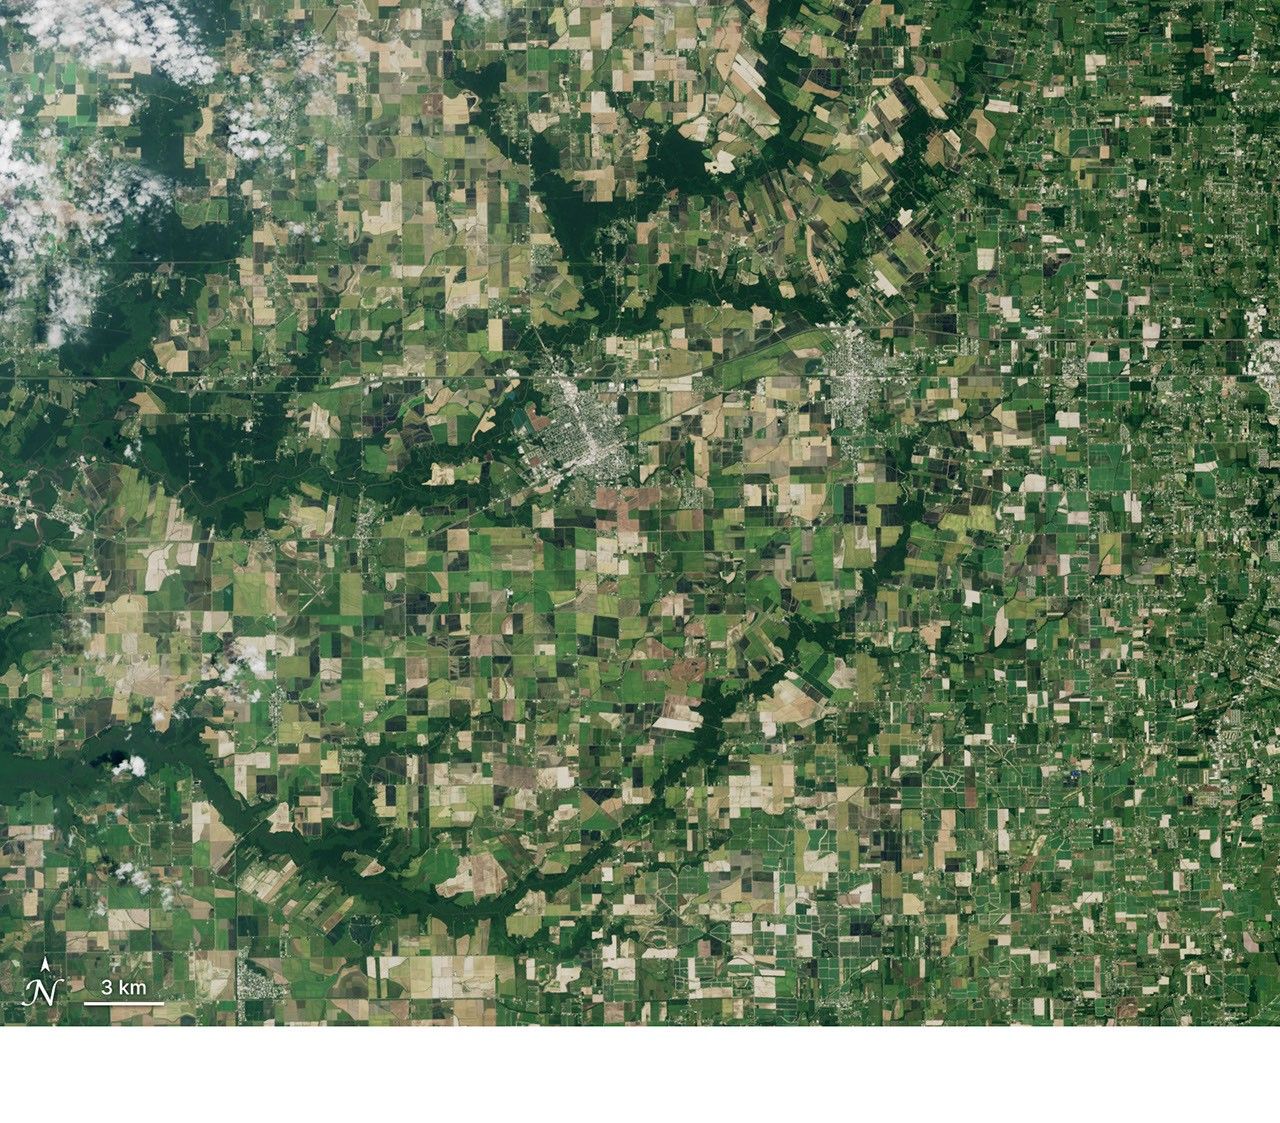
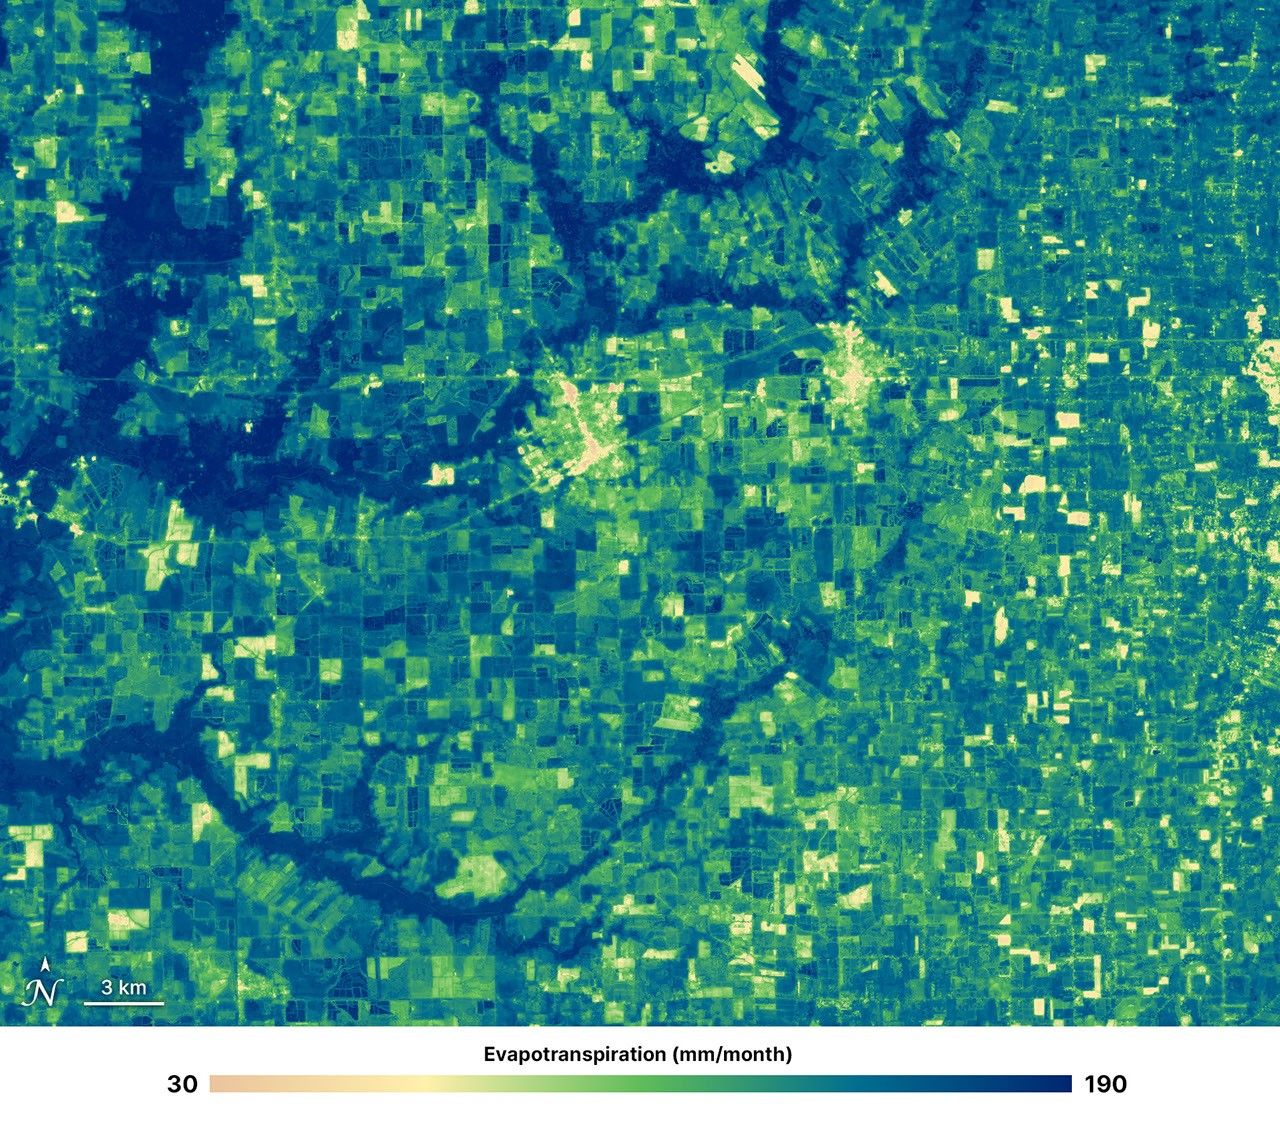
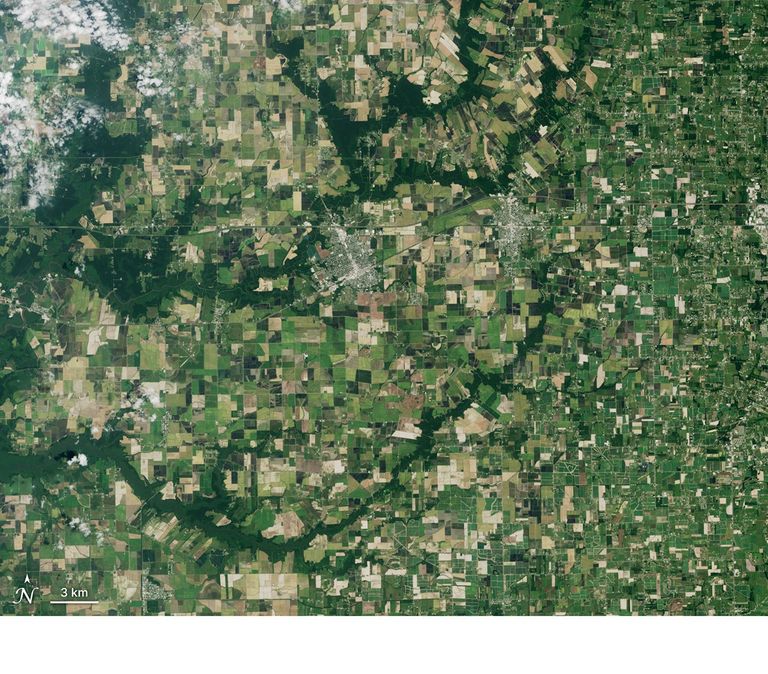
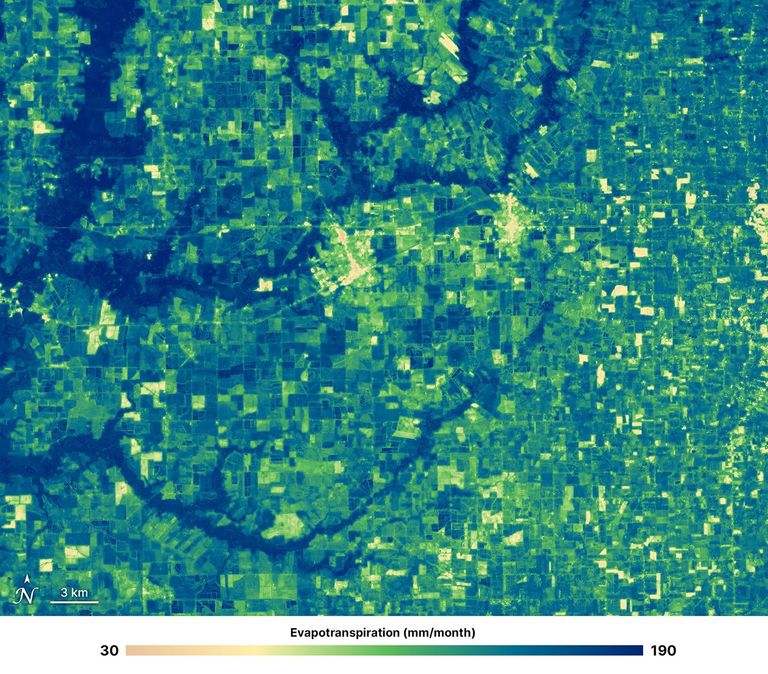
Natural-Color & OpenET
Rayne and Crowley, Louisiana
July 22, 2026 – Monthly Evapotranspiration (July)
Credit: NASA/Ross Walter
November 19, 2026
The Lower Mississippi Alluvial Plain (LMAP) is a landscape built by water. Stretching along the lower Mississippi River through seven states, the fertile, nutrient-rich soils of this flat plain support vast fields of crops, while patches of bottomland forest and wetlands shelter wildlife and hold water. The river’s old channels, backwaters, and subtle rises and dips shape where water gathers and how plants, animals, and people use the land. Today, farms and forests share a floodplain whose rhythms swing between abundant water and drought.
The LMAP functions as a major U.S. agricultural region, and its crops depend heavily on groundwater for supplemental irrigation during the hotter and drier summer months. In this intensively farmed plain, groundwater overuse has led to declines in aquifer levels, threatening both the region’s water resources and the sustainability of its agriculture. Groundwater shortages can also affect people far from farms who rely on the same aquifers for water.
What if we could help farmers make more informed decisions by tracking seasonal changes in water use from space? Satellite data can reveal when and where crops and forests release water into the atmosphere, and how those patterns shift across the landscape and under different rainfall conditions. Knowing how much water is transferred to the air allows growers to better calculate their crop water requirements, helping them to use water more efficiently and better plan irrigation.
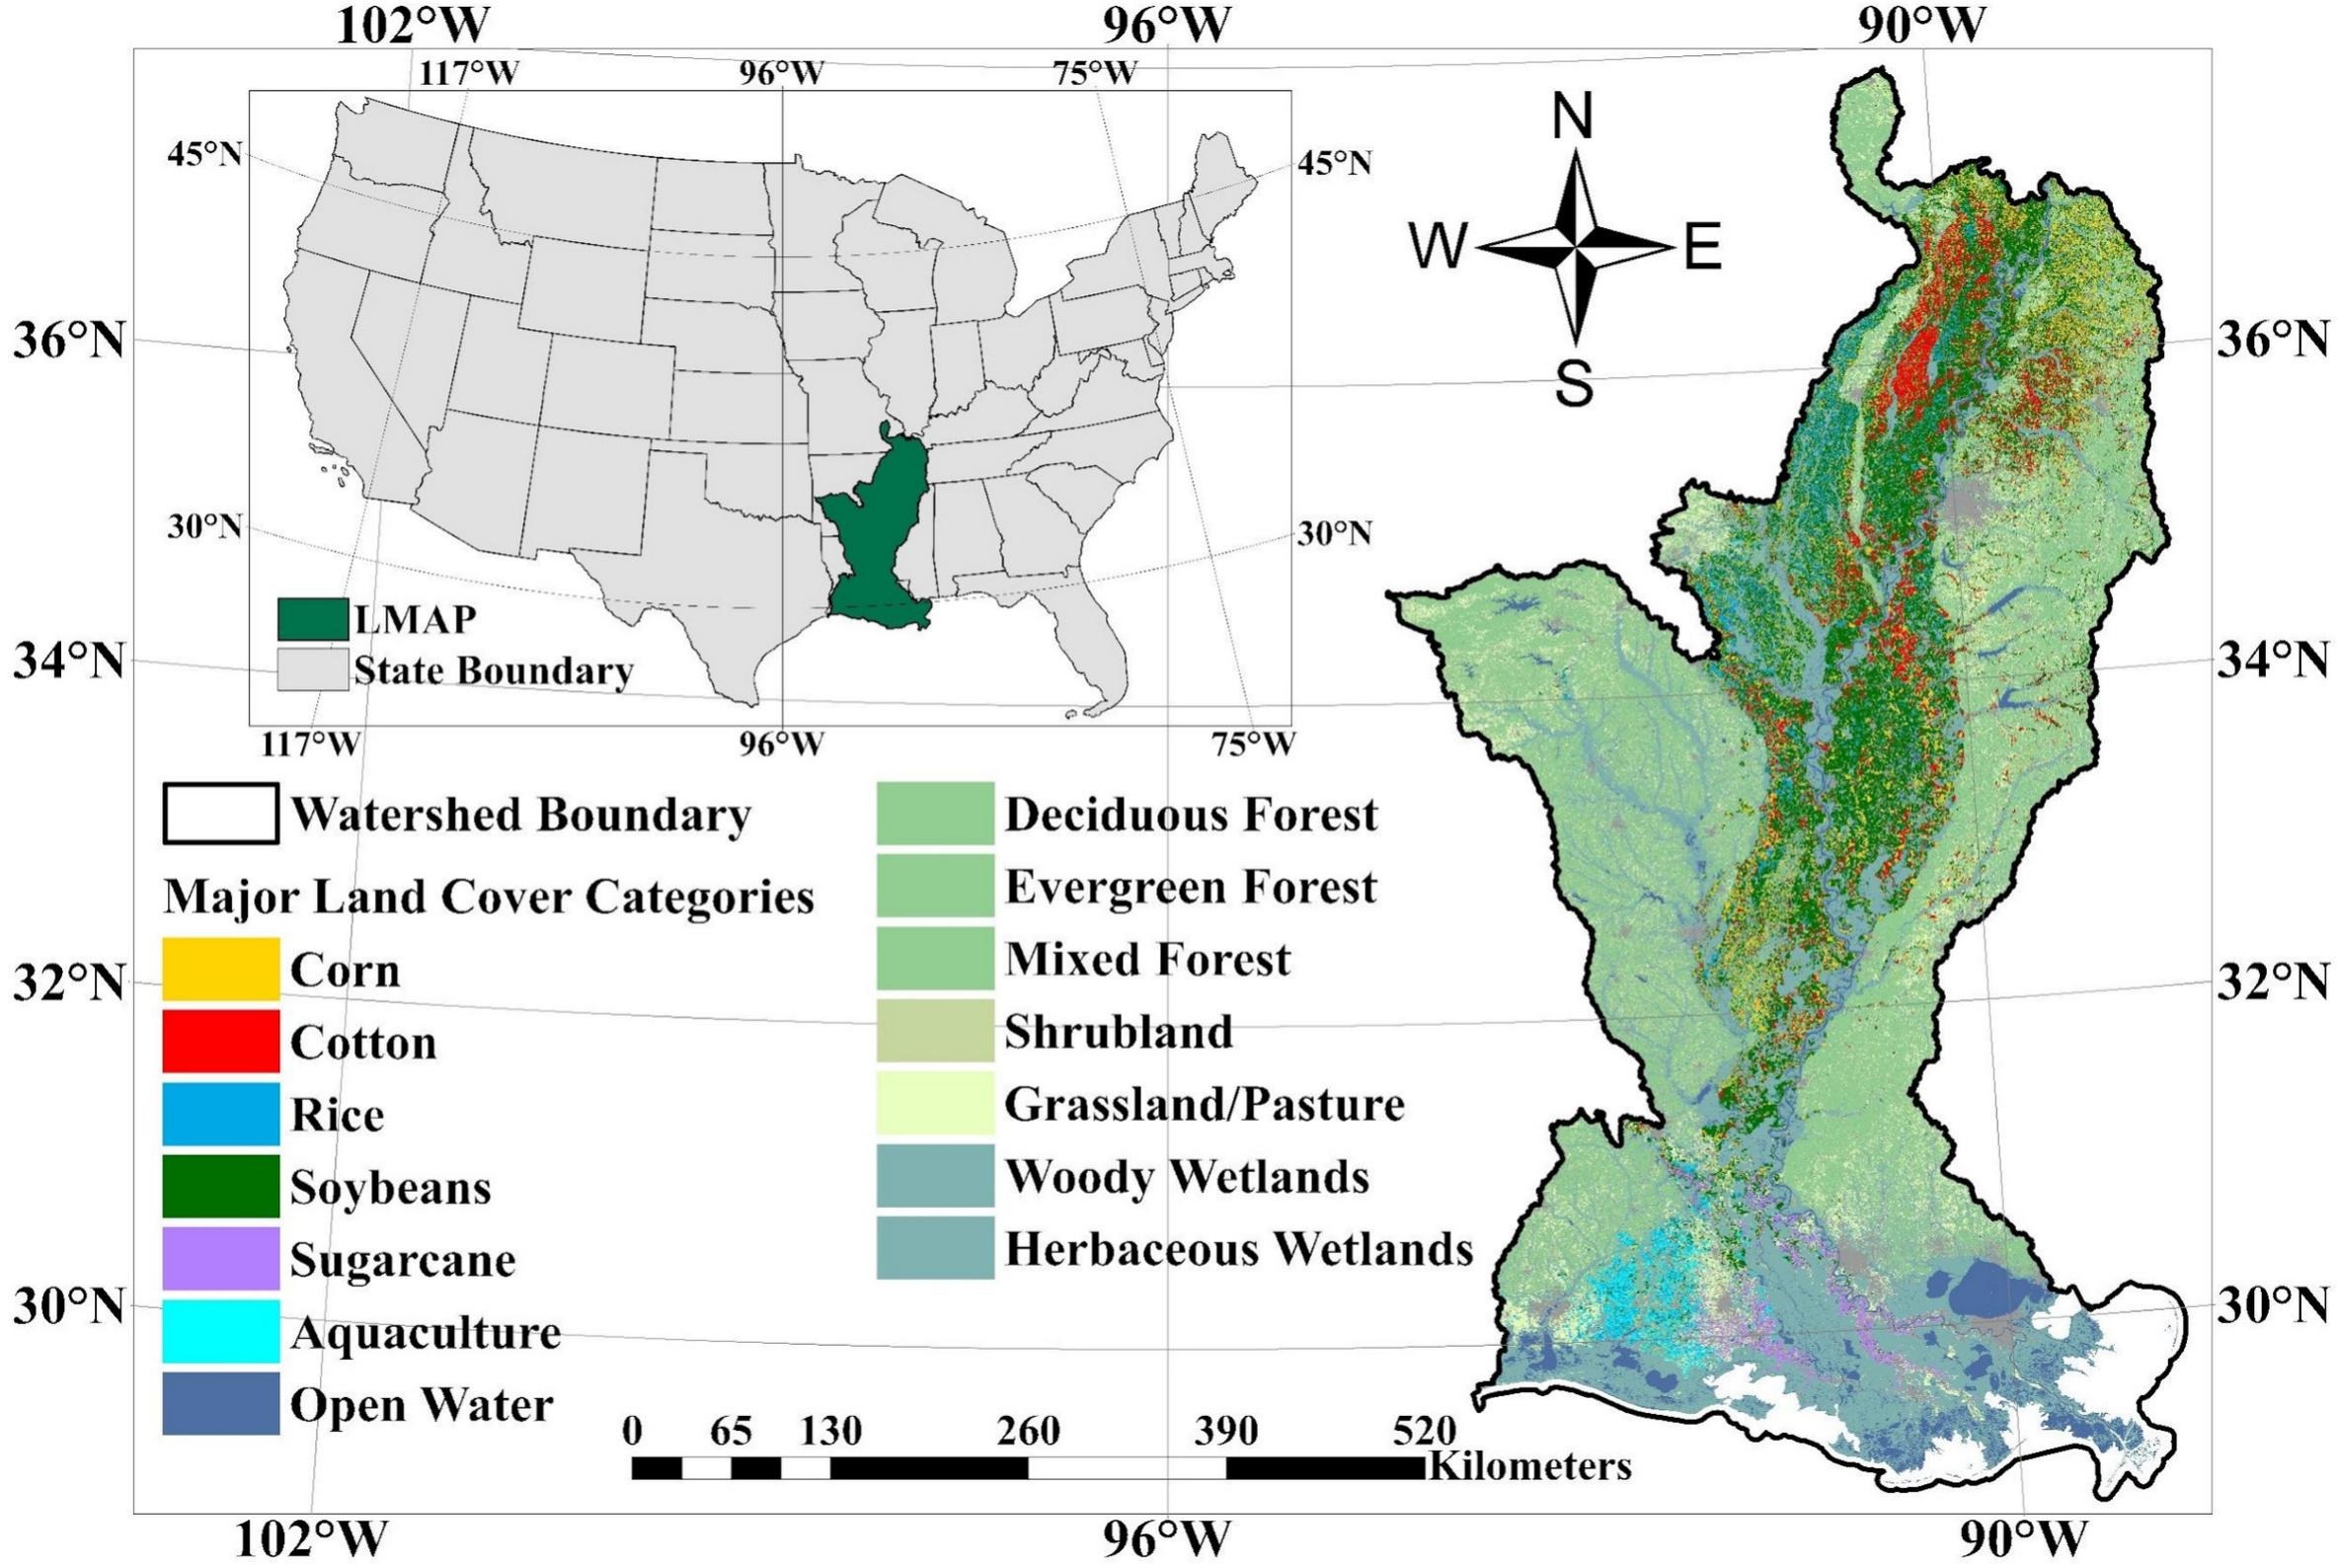
To better understand how water use varies across farms and through drought, Duan et al., 2026, used Landsat satellite data to track water loss from crops and forests at field scale within the LMAP region from 2016 to 2022.
The research was led by Weina Duan, a graduate student from Cornell University’s School of Integrative Plant Science and Soil and Crop Sciences Section. Joining Duan were Christopher Hain from NASA Marshall, John Volk from DRI, and several members of the 2026-2030 Landsat Science Team — Yun Yang, Martha Anderson, Forrest Melton, and Kyle Knipper.
The deeply knowledgeable research team leveraged an online, open-source data platform, OpenET, that uses Landsat data and weather information to track and map evapotranspiration (ET), the total water lost from the land surface to the atmosphere. OpenET combines satellite observations with computer models to estimate how much water evaporates from soil and is released by plants through tiny pores in their leaves into the air (transpiration). Understanding total ET helps farmers estimate how much water their fields lose to the atmosphere: a useful quantity for a farmer’s water budget.
OpenET calculates ET at a 30-meter spatial resolution, with each pixel representing an area 30 meters by 30 meters (about 100 by 100 feet, or 0.22 acres). The platform’s models rely primarily on Landsat observations, including surface-temperature measurements, and combine them with other satellite data, weather inputs, and scientific models to compute ET. The resulting maps can be used to examine water use within fields at daily, monthly and seasonal timescales.
Using OpenET, the researchers tracked seasonal crop growth and estimated water loss across the LMAP during the study period to understand how different landscapes respond to drought. The authors used OpenET’s monthly, 30-meter ET data for 2016-2022, then analyzed and compared it across crop types, forests, seasons, and drought conditions. They estimated water loss from four major crops — soybeans, corn, cotton, and rice — as well as water loss from nearby forests. Forests were studied as a reference group, helping show how the seasonal water use and drought stress of managed crops compared to a less-managed ecosystem. Researchers also used the U.S. Drought Monitor data to assess drought effects.
The study revealed that all four crops and nearby forests reached peak ET in July, but crop ET varied more across the study’s observations than forest ET did. Crop ET varied among crop types and fields with different water-management practices. During drought, crop evaporative-stress indicators responded more quickly to worsening conditions than forest indicators, suggesting greater forest resilience to soil-moisture deficits. Forest ET was higher than crop ET overall, and forest stress indicators responded more slowly as drought worsened.
OpenET’s field-scale data reveal how ET varies by crop and season, and how those patterns change during drought events. Crop ET stayed relatively stable despite reduced rainfall, while modeled groundwater-storage changes indicated increasing depletion. This pattern suggests that irrigation may have helped sustain crop ET as drought develops. These findings could inform both irrigation planning and regional water management decisions.
“Our study demonstrates how Landsat-based ET products can reveal differences in water use across crops, forests, and drought conditions at the field scale,” said Yun Yang, Assistant Professor at Cornell University and Principal Investigator of the NASA Acres-supported study. “This information is essential for understanding agricultural water demands and supporting more sustainable water management in regions facing increasing groundwater pressure.”
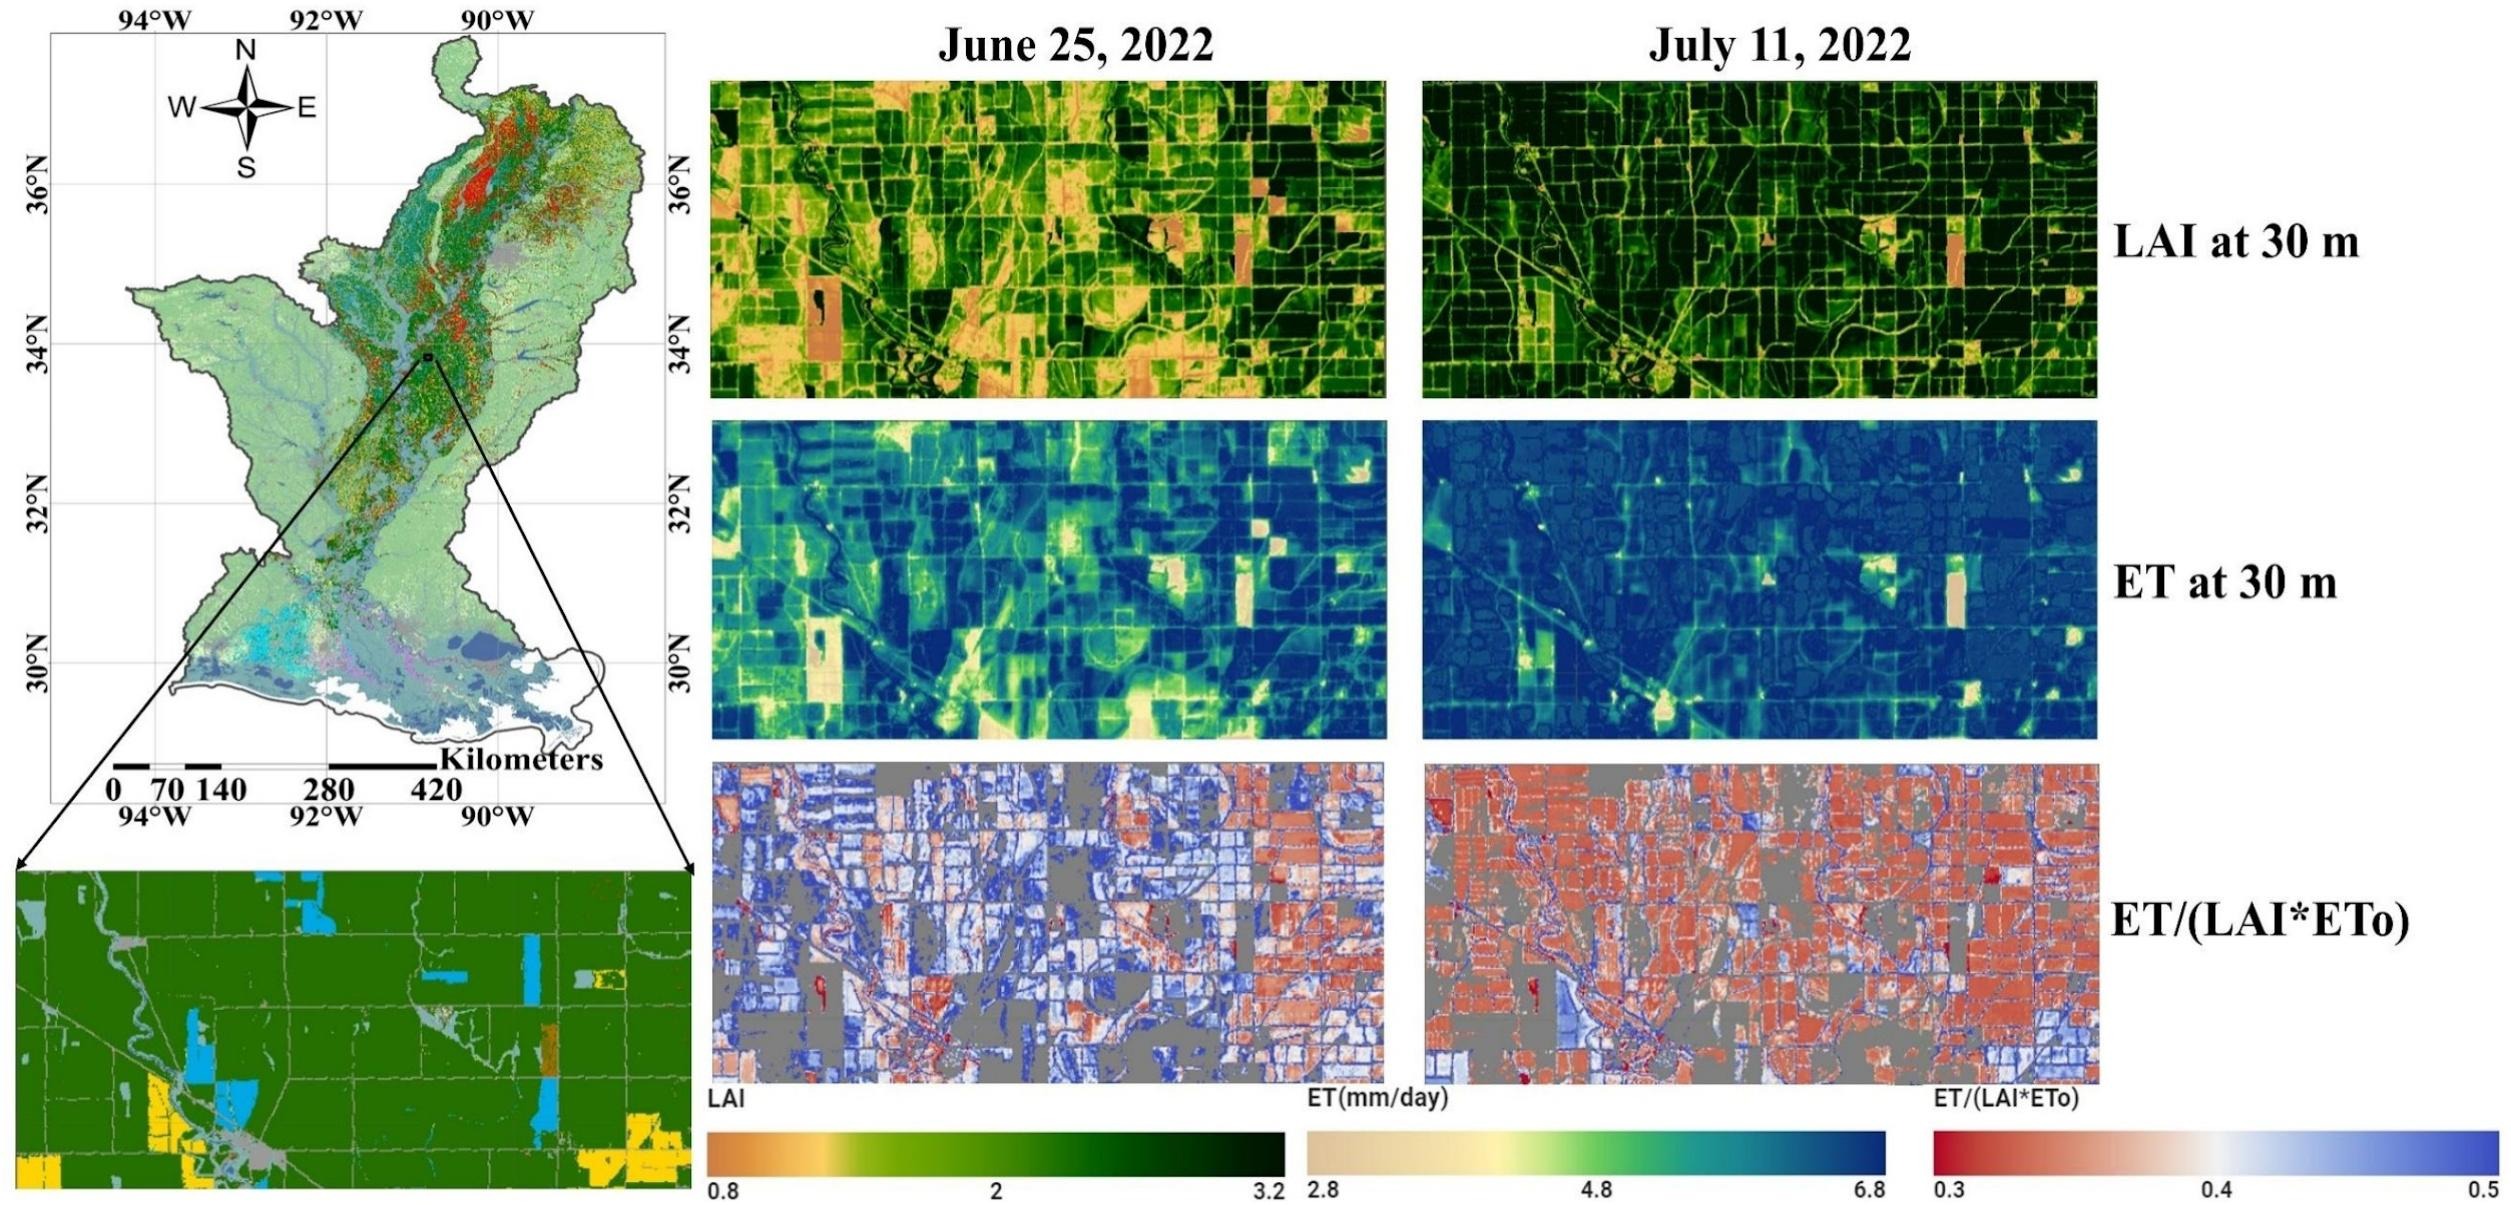
Although the study focuses on the LMAP, its field-by-field tracking of crop water use over time could be applied in other regions where groundwater or surface water supplies are shrinking. By showing how satellite-based measurements can reveal field-scale differences in water use and drought response, the study offers an approach that could help researchers and water managers assess agricultural landscapes far beyond the LMAP.
Monitoring how much water different crops use and where stress may be emerging could help farmers and water managers make smarter irrigation decisions using Landsat and OpenET data before shortages become more severe. The method can also help track crop water use and drought stress more broadly, including pressure on surface-water supplies.
Farmers can use ET measurements to estimate how much water their fields and crops lose, helping them determine how much may need to be replenished through rainfall or irrigation. Knowing how much water is transferred to the air allows agriculturalists to better calculate crop water requirements, helping them to use water more efficiently and better plan irrigation.
Comparing farmland with forests helps show that water use depends not only on weather, but also on land cover and how plants access water. In this study, forests used more water than crops and their water use changed less during drought, possibly because deep roots let trees draw on groundwater. That gives researchers a useful comparison, but also highlights a key point: forests are valuable ecosystems, yet their water use can add pressure to groundwater supplies, especially during dry periods.
Study lead Weina Duan noted: “By providing a field-by-field picture of water use, OpenET provides farmers and water managers new tools to better understand crop water use and make more informed decisions about limited water resources.”
Related Links
- OpenET, the open-source, satellite-based evapotranspiration platform
- Duan, W., Yang, Y., Anderson, M.C., Hain, C.R., Melton, F.S., Volk, J.M., & Knipper, K. R., 2026. Field-scale water use assessment in the Lower Mississippi Alluvial Plain using OpenET. Int. J. Appl. Earth Obs. Geoinf., doi:10.1016/j.jag.2026.105172
- The NASA Acres Consortium