


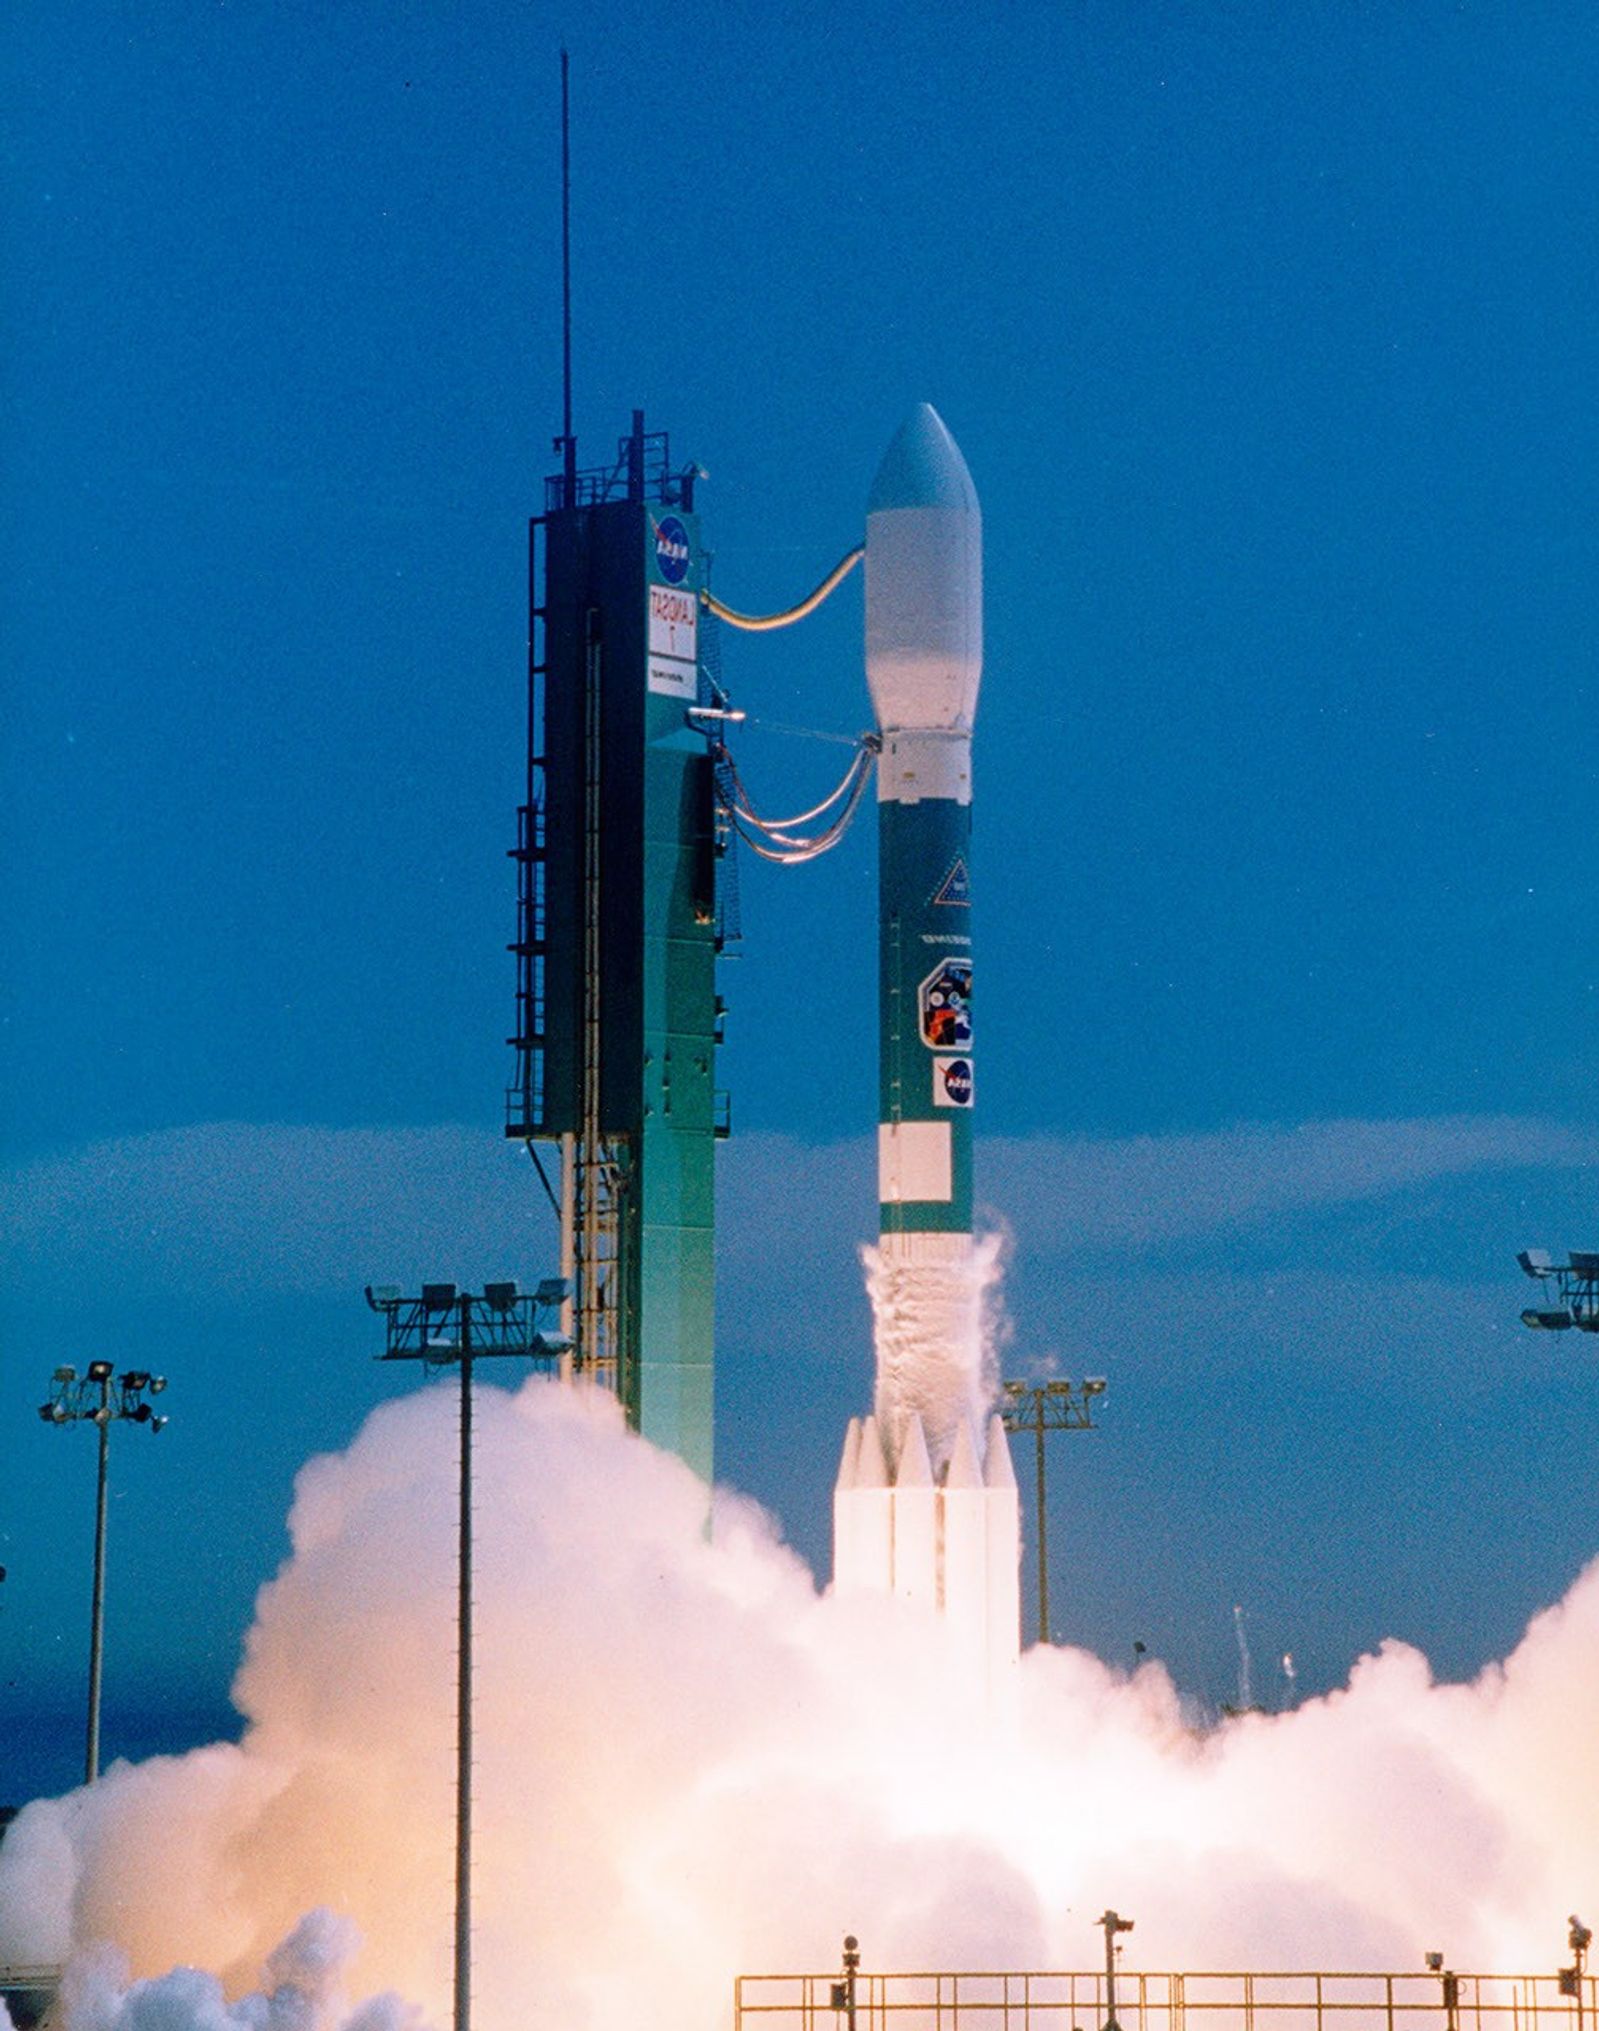
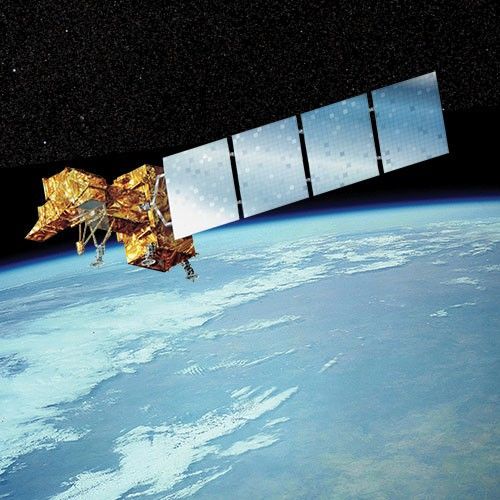
Landsat 7
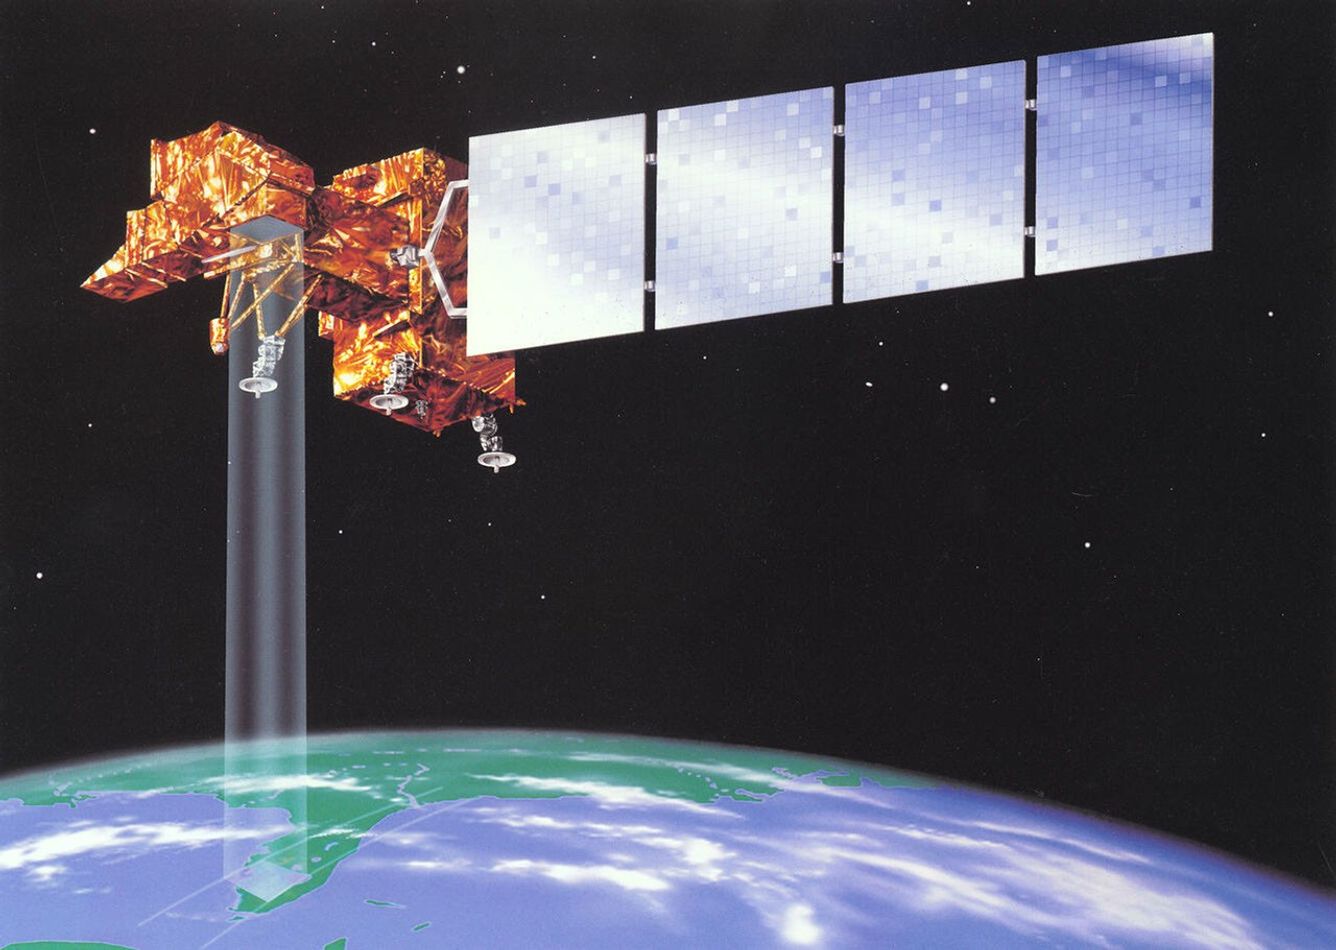
Launched on April 15, 1999, Landsat 7 continued the legacy of the program by providing consistent, systematic data of Earth that proved invaluable to scientific research and innovation, environmental monitoring, and global change analysis.
Mission Objective
Partners
Launched
Decommissioned
| Quick Facts | |
|---|---|
| Sensor: ETM+ | Spatial Resolution: 30 meters (VSWIR), 60 meters (thermal), 15 meters (panchromatic) |
| Spectral Resolution: 8 bands | Temporal Resolution: 16 days |
| Radiometric Resolution: 8-bit | Image Data: 550 scenes/day |
| Scene size: 170 km (106 mi) x 185 km (115 mi) | Swath Width: 185 km (115 mi) |
| Global Reference Grid System: WRS-2 | Altitude: 705 km (438 mi) |
| Inclination: 98.2 degrees | Orbit: Polar, sun-synchronous |
| Equatorial Crossing Time: Nominally 9:45 am ± 15 minutes local time (descending node) | Period of Revolution: 99 minutes; ~14.5 orbits/day |
| Design Life: 5 years |
Overview
Over the course of its 26-year lifespan, Landsat 7’s Enhanced Thematic Mapper Plus (ETM+) acquired more than 3 million scenes, providing researchers with critical data to study changing land use, the impacts of disasters like wildfires, carbon storage in forests, and more.
Landsat 7 marked a turning point in the program. In 2008, all Landsat data was made freely available and by 2011, USGS had distributed more than seven million scenes at no cost. The open archive spurred scientific innovation including first-ever global land assessments.
Despite partial data loss due to the failure of the ETM+ Scan Line Corrector, a component of the scanning mechanism, in 2003, Landsat 7 remained operational and contributed to critical programs including carbon accounting, disaster response, and international land monitoring. Its mission demonstrated the global importance of data continuity and instrument redundancy.
Landsat 7’s nominal science mission ended on April 6, 2022. It then entered an extended science mission at a lower orbit until it was officially decommissioned on June 4, 2025.
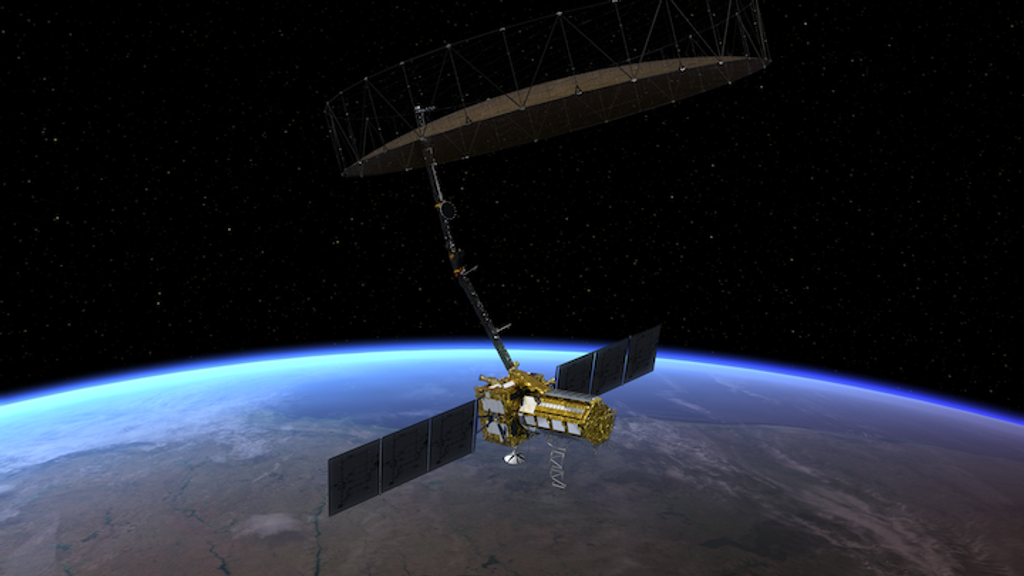
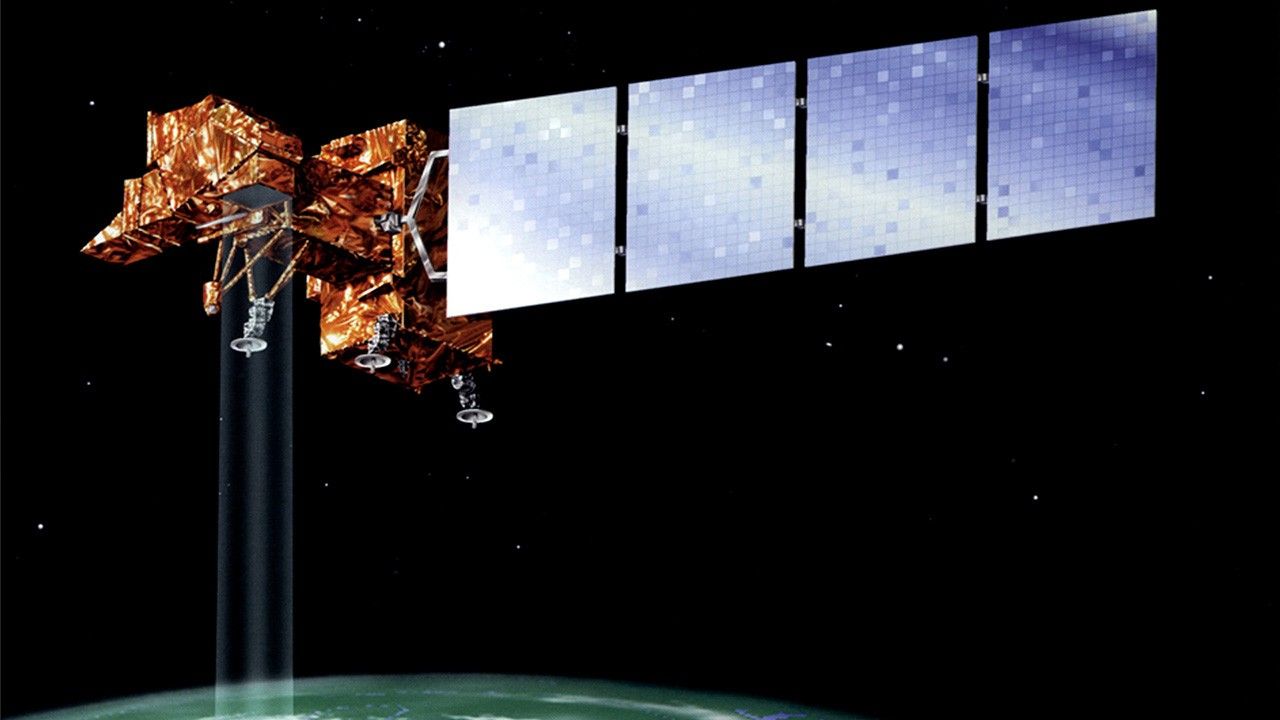
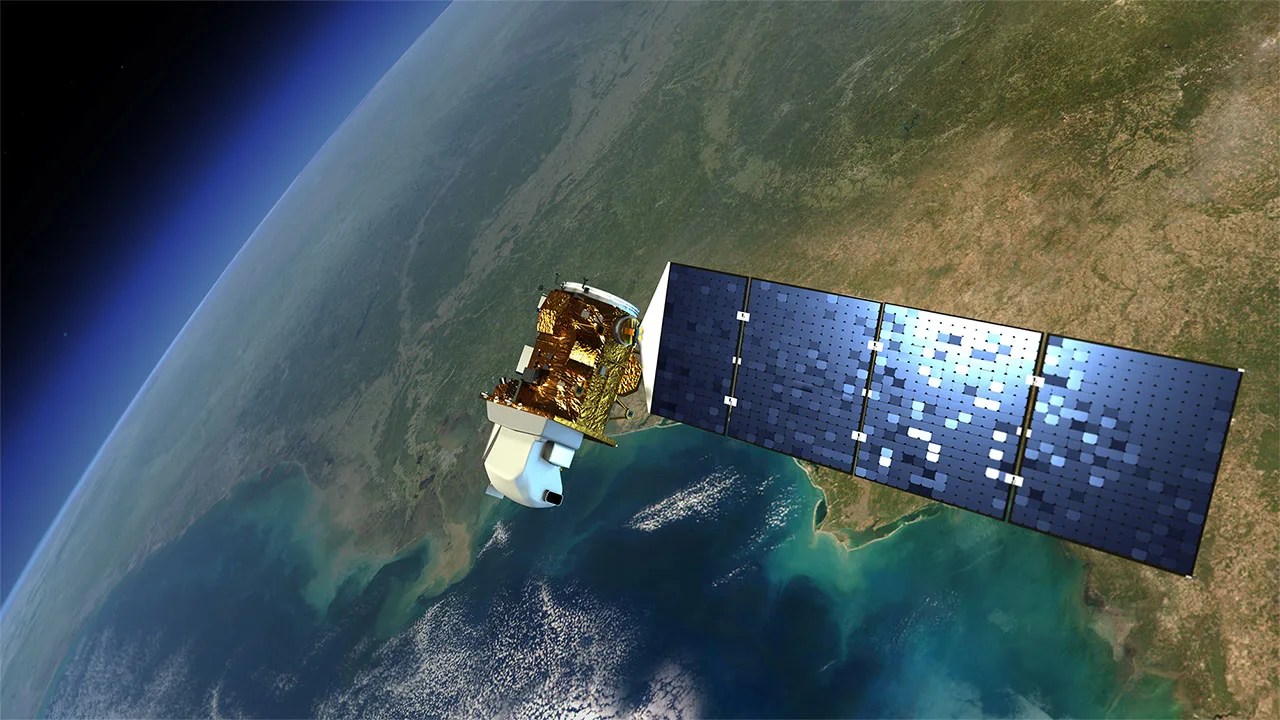
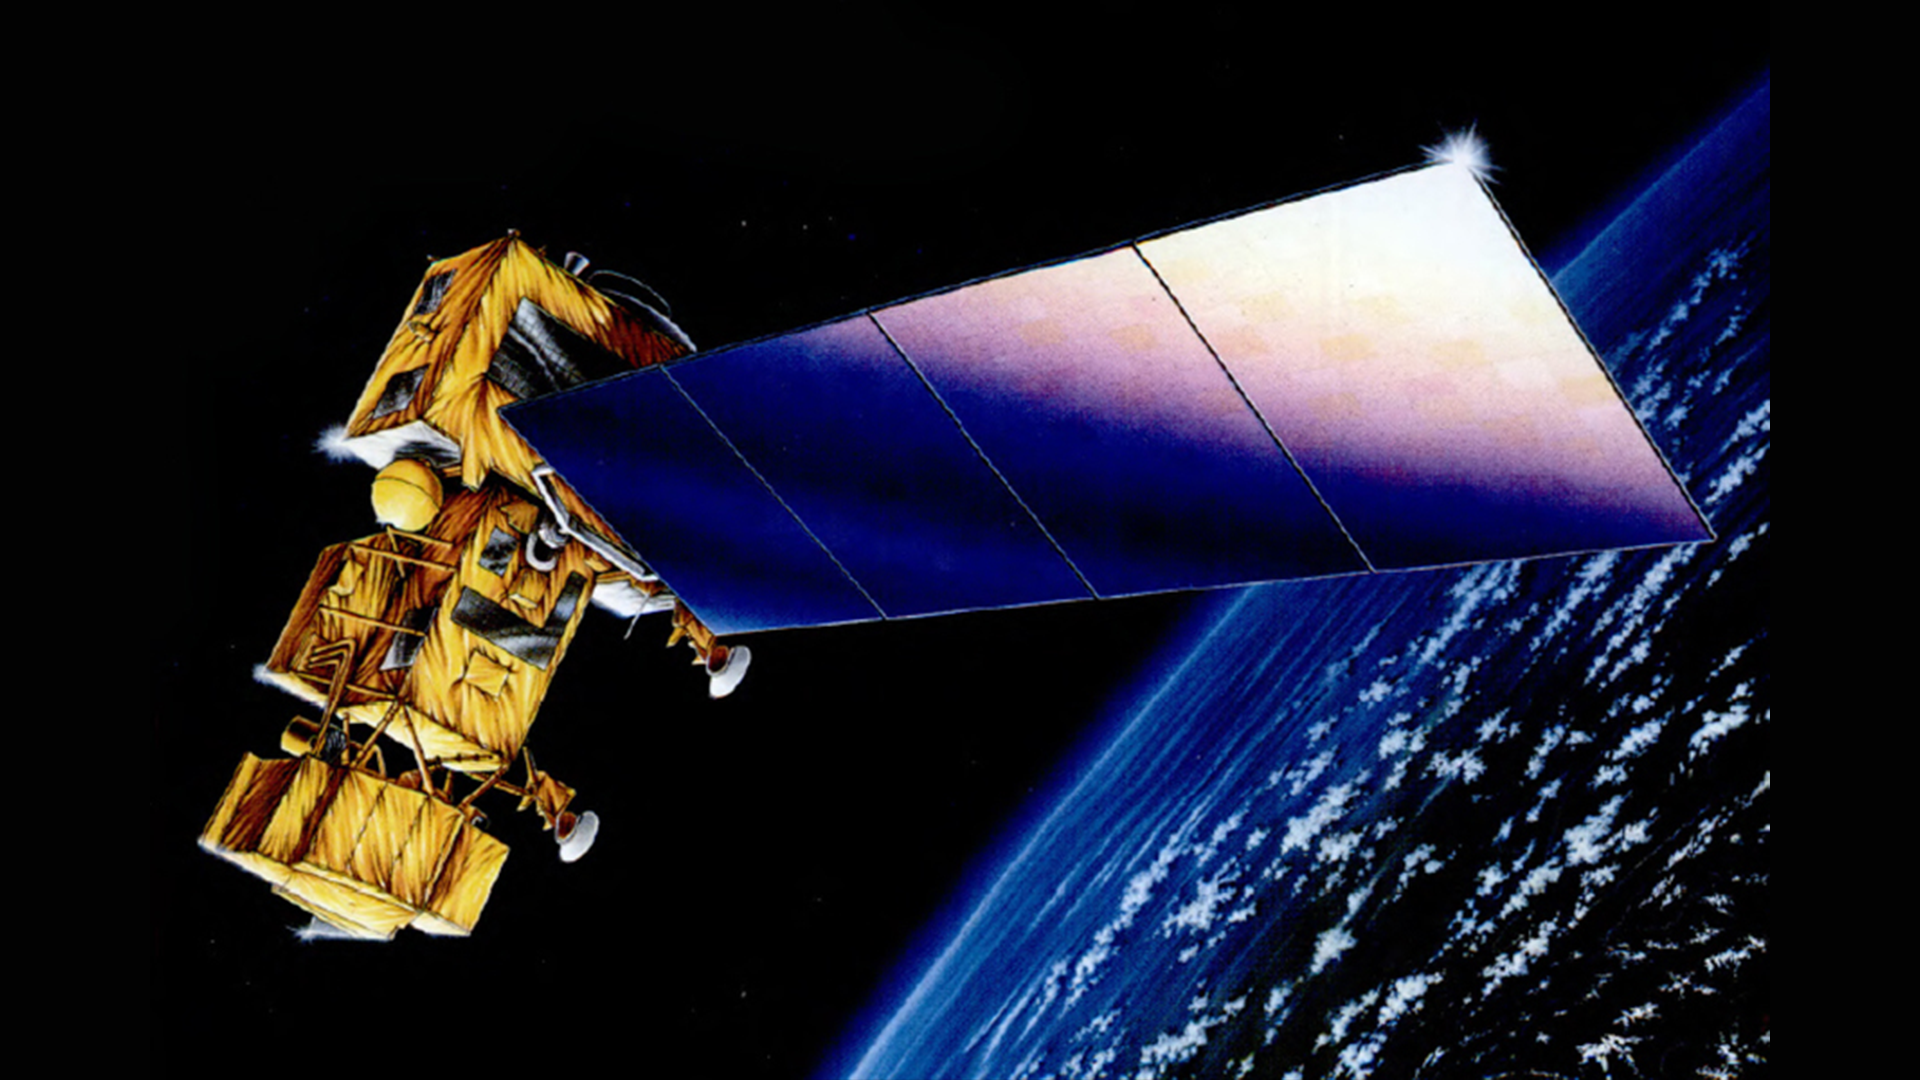
Spacecraft
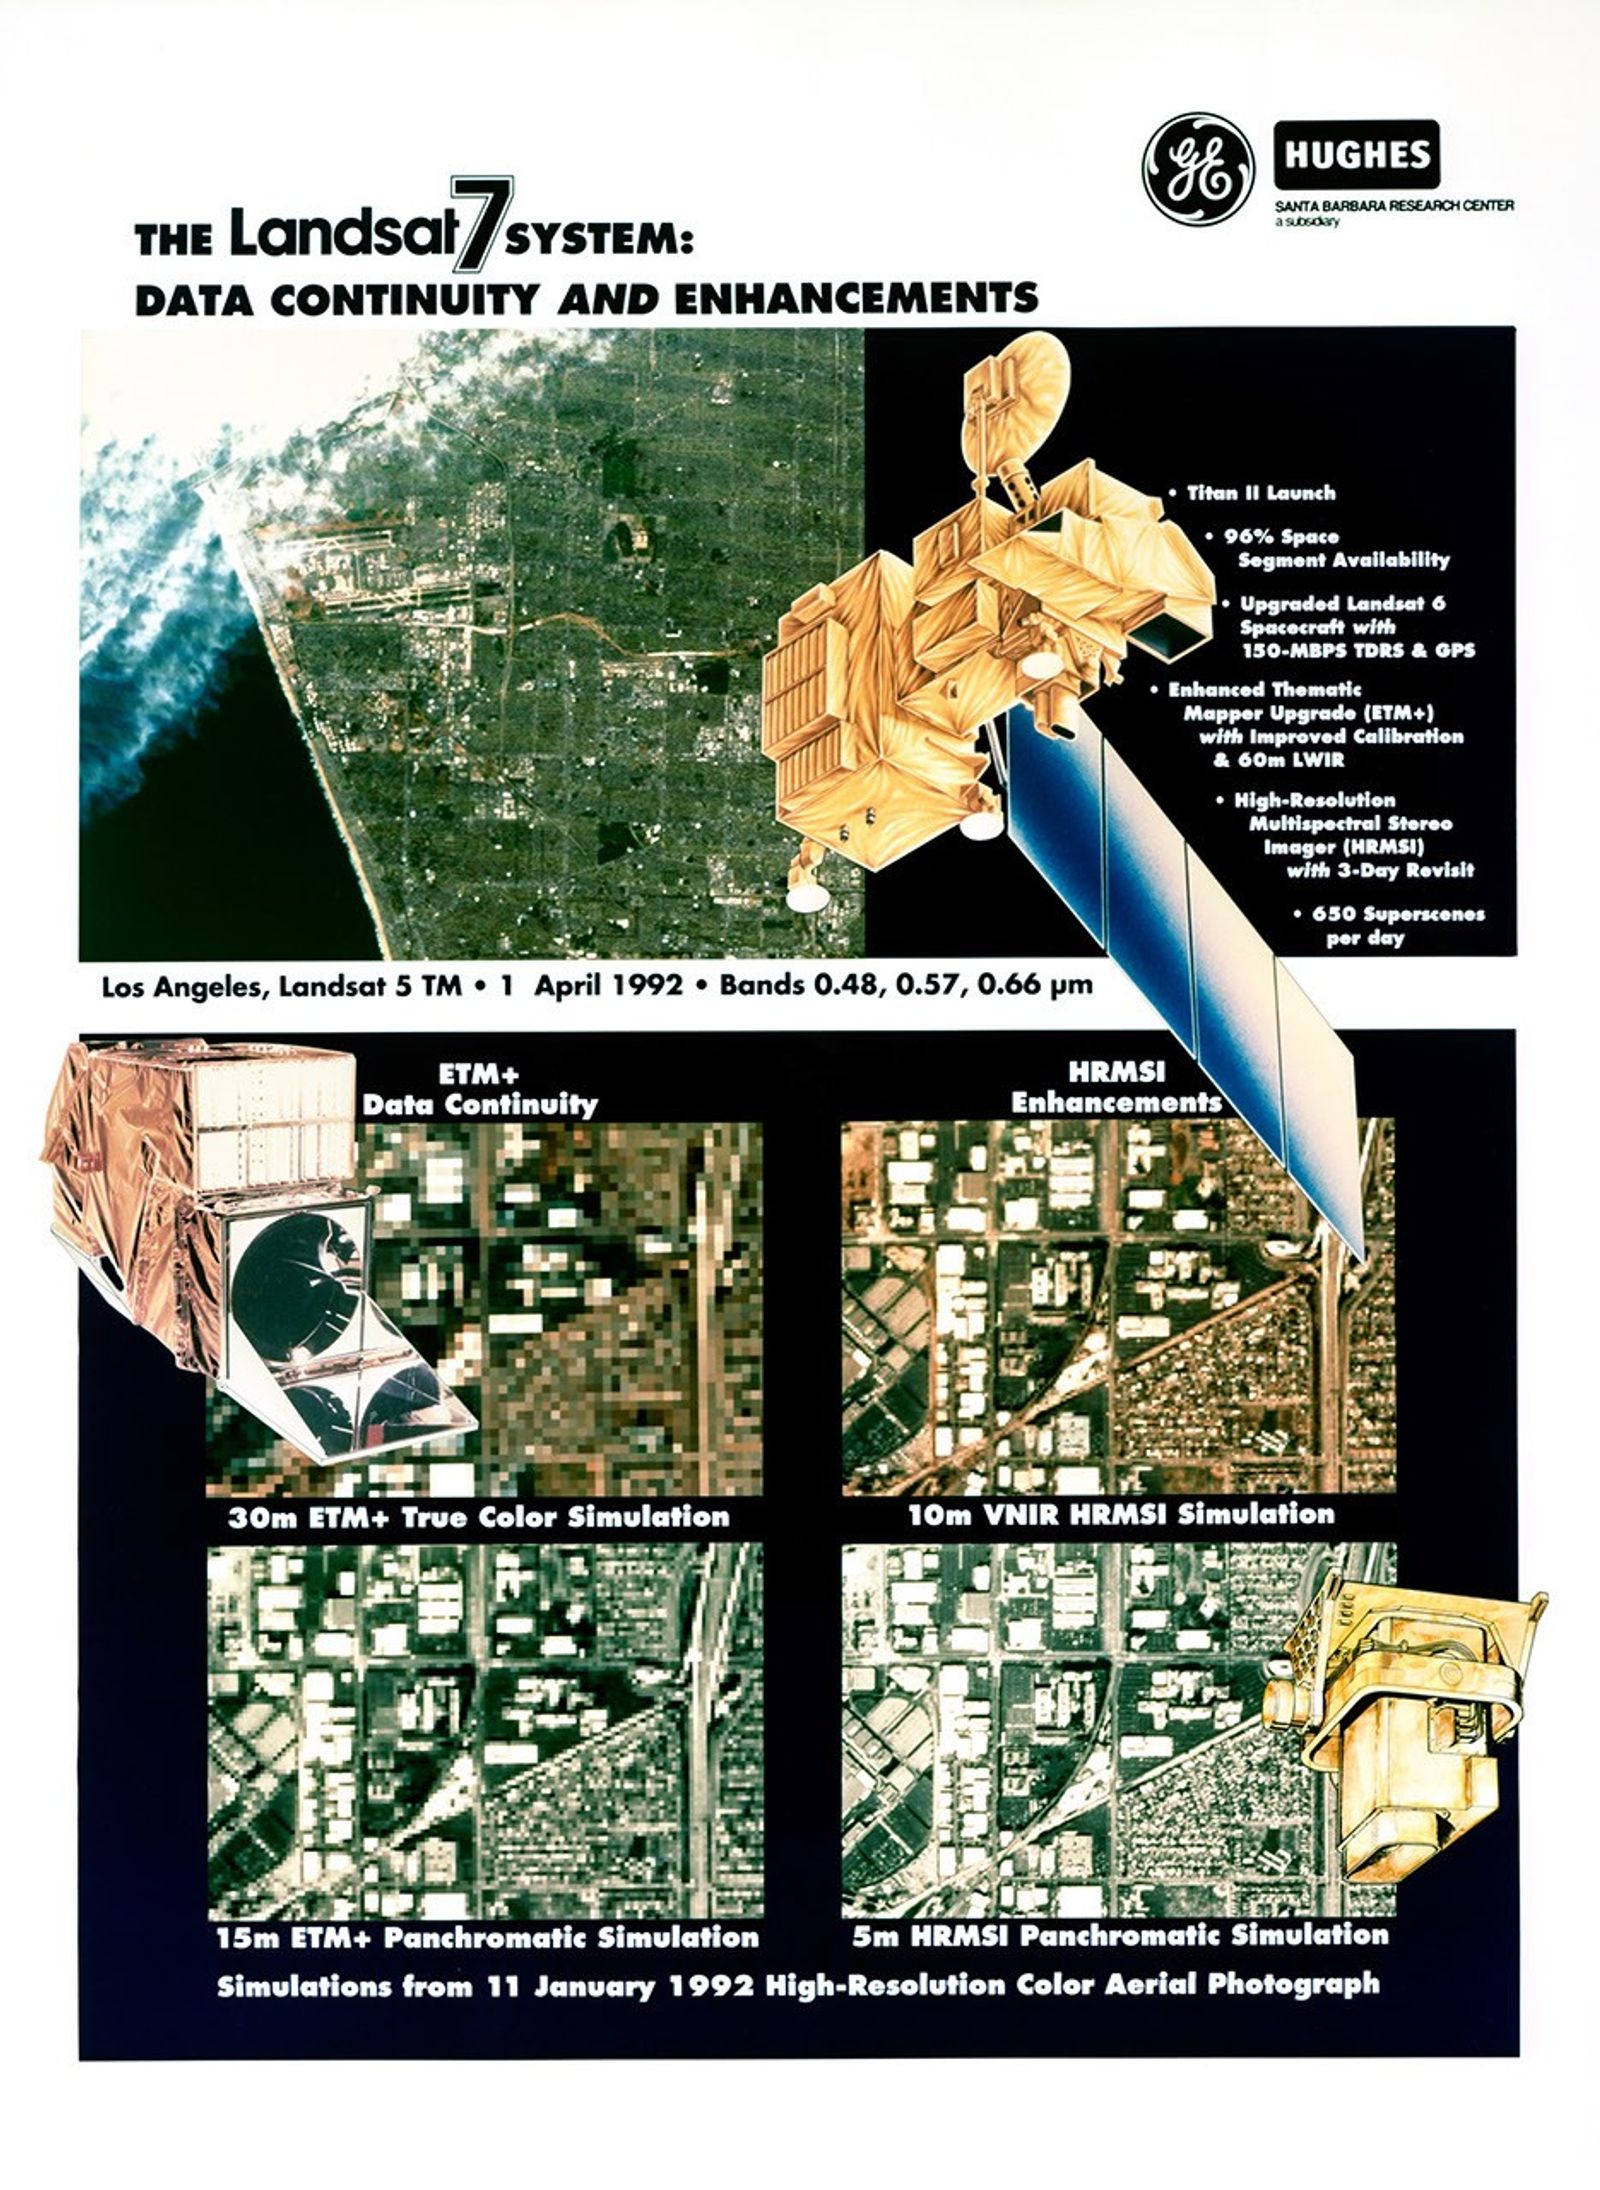
The Landsat 7 spacecraft was an upgraded version of Landsat 6 and carried the Enhanced Thematic Mapper Plus (ETM+) sensor. It joined Landsat 5 in orbit, providing a combined eight-day temporal repeat.
Built by Lockheed Martin Missiles and Space and designed with a five-year mission life, Landsat 7 far exceeded its lifespan, orbiting Earth for over 25 years. This mission success was a result of a well-designed platform that allowed mission operations to control power, orbit and altitude, handle telemetry and communications, and manage data storage.
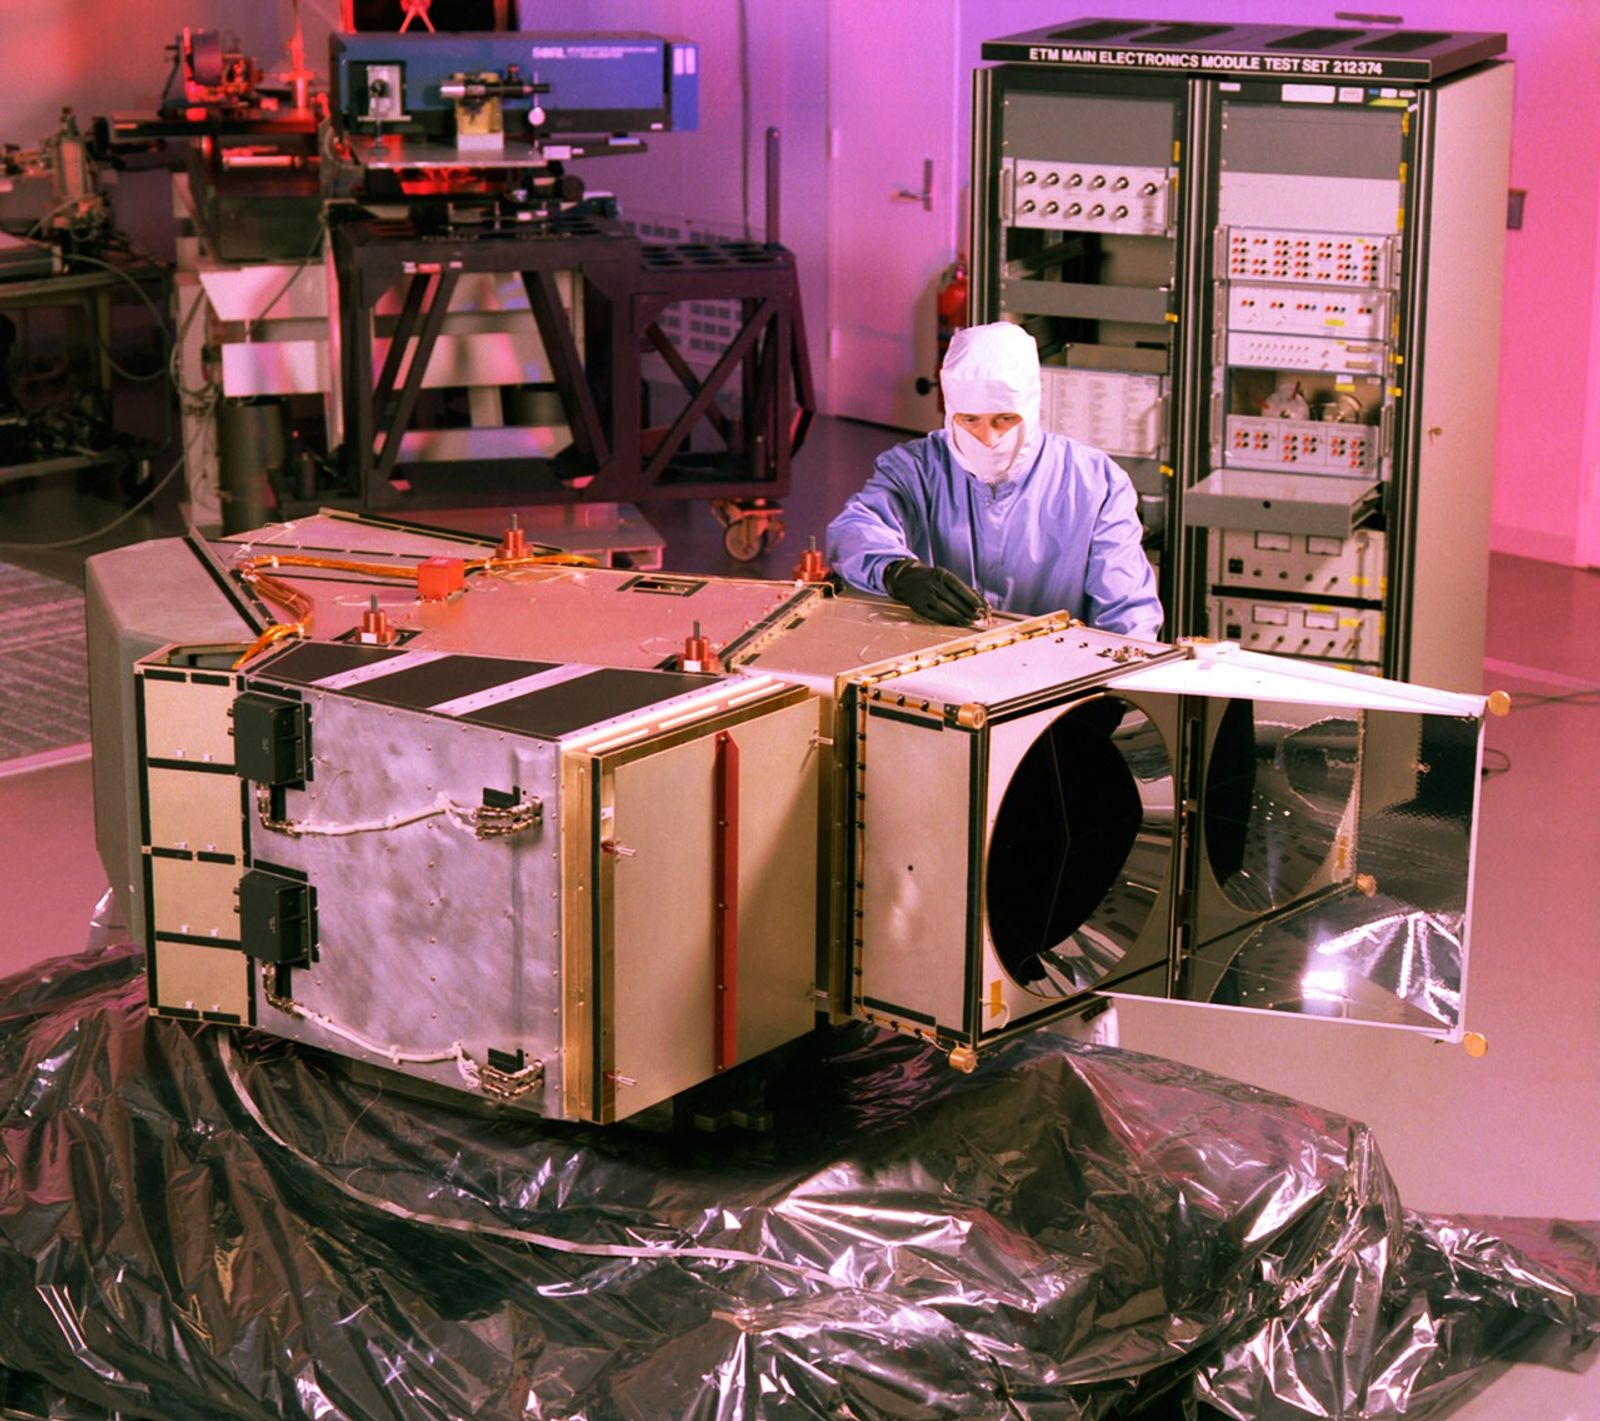
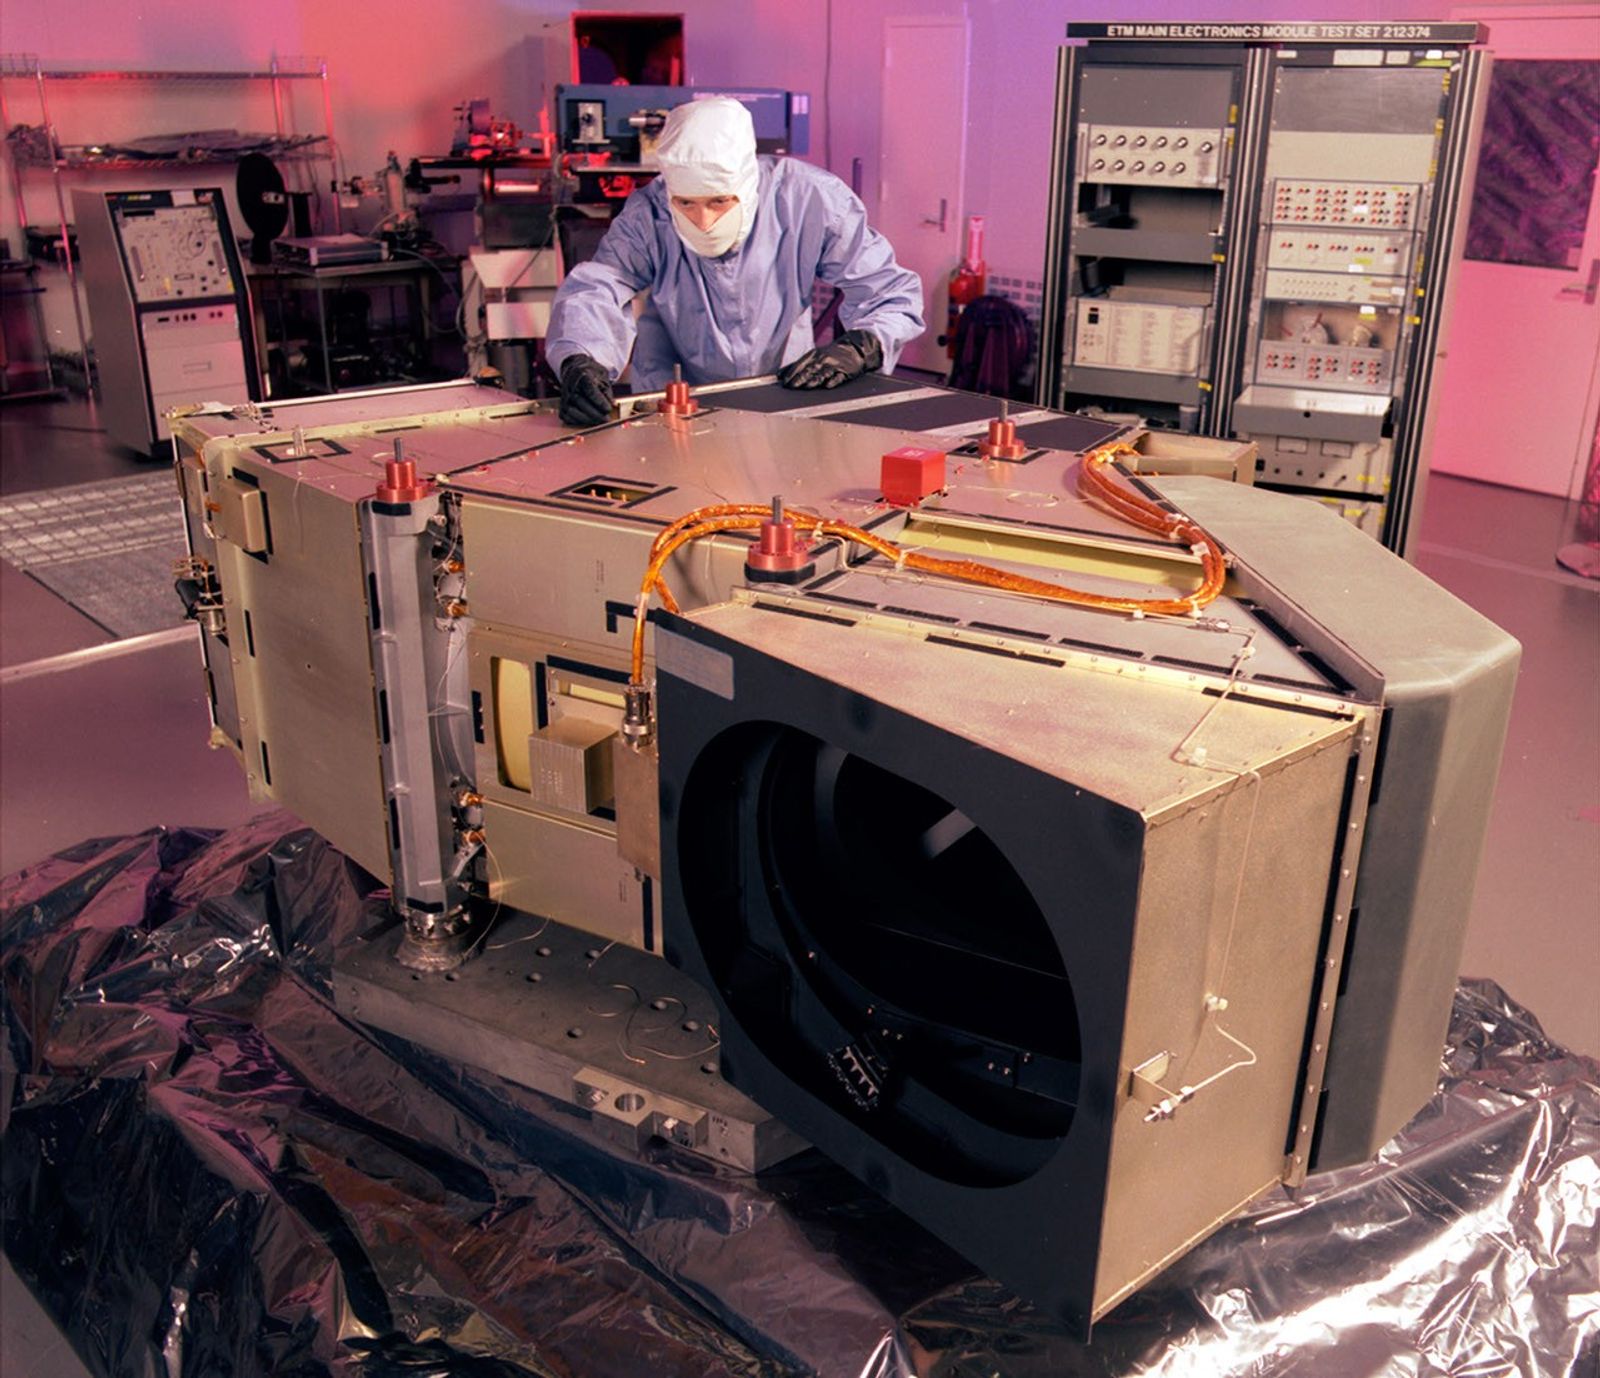
Enhanced Thematic Mapper Plus (ETM+)
The Enhanced Thematic Mapper Plus (ETM+) instrument aboard Landsat 7 was designed to observe Earth’s land surface in visible, near-infrared, shortwave-infrared, and thermal wavelengths of light. It was built by Raytheon Santa Barbara Remote Sensing (SBRS).
Built on its predecessors’ capabilities, ETM+ was an upgraded version of the “whisk-broom” Thematic Mapper (TM) instrument on Landsats 4 and 5. Its 15-meter panchromatic band captured data in sharper detail, refining radiometric calibration for more accurate surface measurements. The thermal-infrared band supported surface temperature studies.
Band 1: Blue (0.45 - 0.52 µm)
Band 2: Green (0.52 - 0.60 µm)
Band 3: Red (0.63 - 0.69 µm)
Band 4: Near-infrared (0.77 - 0.90 µm)
Band 5: Shortwave-infrared 1 (1.55 - 1.75 µm)
Band 6: Thermal-infrared (10.40 - 12.50 µm)
Band 7: Shortwave-infrared 2 (2.08 - 2.35 µm)
Band 8: Panchromatic (0.52 - 0.90 µm)
Spatial resolution: 30 m (VSWIR), 60 m (TIR, resampled to 30 m), 15 m (panchromatic)
Data: 8-bit integers
April 18, 1999
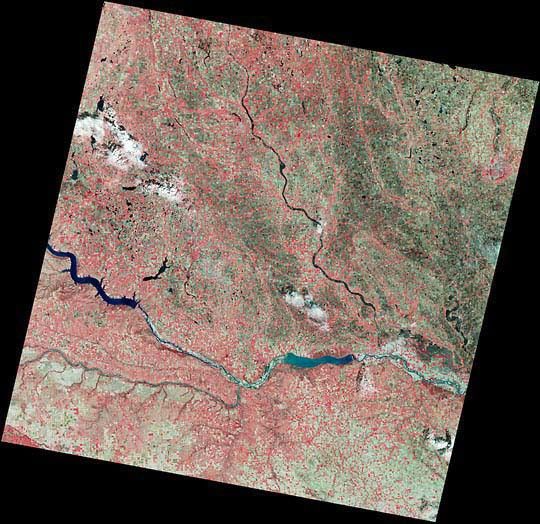
First Light
South Dakota & Nebraska
This false-color image of southeast South Dakota and northeast Nebraska was released as the first image acquired by Landsat 7's Enhanced Thematic Mapper Plus (ETM+) sensor on April 18, 1999.
The Missouri River, flowing in from the left edge of the image, is stopped by first the Fort Randall Dam, then further downstream by the Gavin’s Point Dam near Yankton. The river defines the border between South Dakota and Nebraska. The James River flows from the top center of the image and flows southeast to join the Missouri River east of Yankton.

Communications
Landsat 7 was equipped with a robust communications and data handling system to reliably deliver imagery to users worldwide. Space-to-ground links used S-band for command uplink and spacecraft telemetry, while X-band transmitted high-volume science data. A 380-gigabit solid-state recorder stored roughly 100 scenes for later downlink to U.S. ground stations, with real-time data also transmitted to international receiving sites.
The Landsat 7 ground system, jointly developed by NASA Goddard Space Flight Center and the USGS EROS Data Center, provided mission operations, and data processing, archiving, and distribution. In 2000, operations were transferred fully to the USGS. The system distributed raw ETM+ imagery within 24 hours of receiving it at EROS.
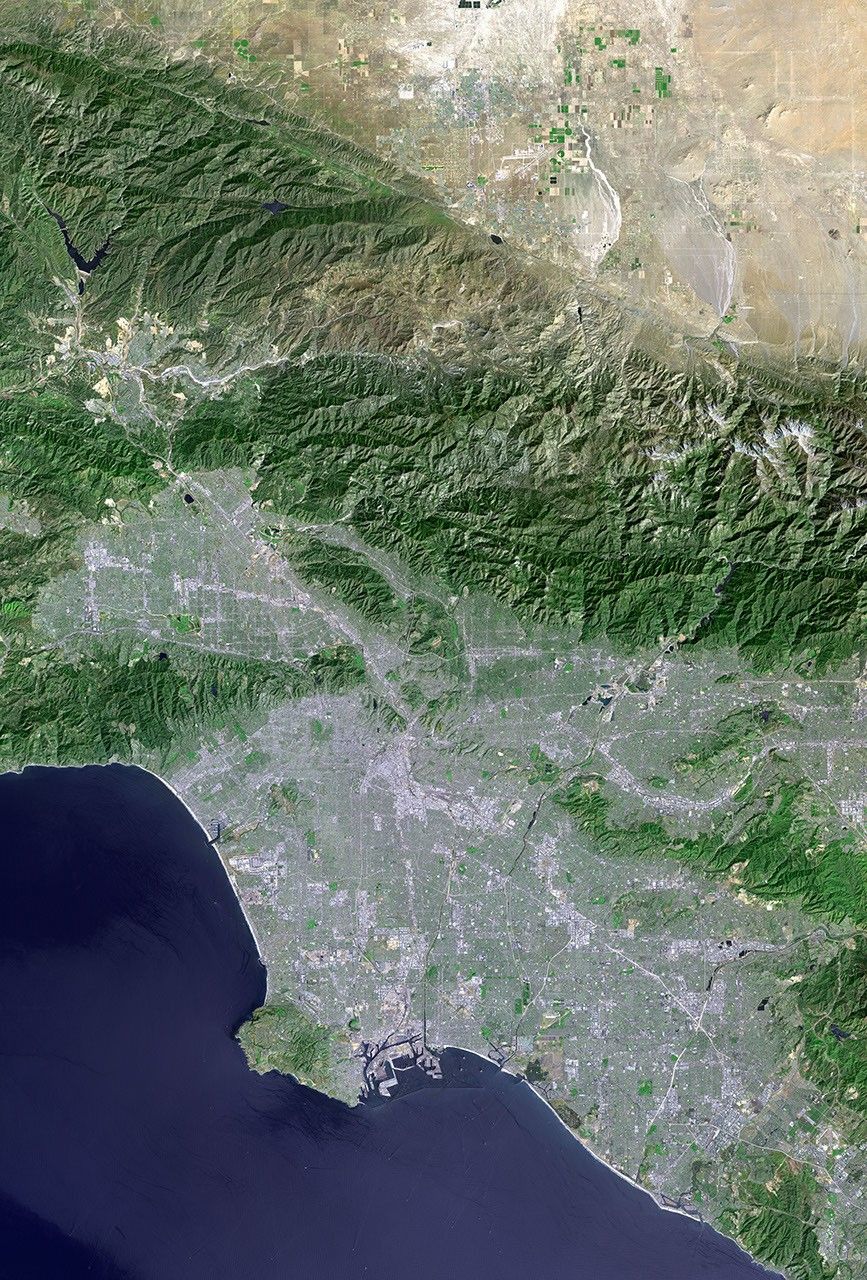
Landsat 7 data have been pivotal in documenting environmental changes such as natural disasters, deforestation, and urban growth over its 25 years. Notably capturing significant events like Hurricane Katrina in 2005, the Haiti earthquake in 2010, the Australian bushfires in 2019 – 2020, the dramatic growth of cities worldwide and more through its long-standing mission.

David Applegate
Former USGS Director
Mission Objectives
- Continuity: Provide data continuity with previous Landsat missions.
- Coverage: Offer 16-day repeat coverage of the Earth’s surface.
- Archive: Build and periodically refresh a global archive of sunlit, substantially cloud-free land and coastal images.
- Availability: Make data widely and freely available.
- Partnerships: Support Government, international, and commercial communities.
- Syngerism: Play a vital role in NASA’s Earth Observing System (EOS) by promoting interdisciplinary research via synergism with other EOS observations. (In particular, by orbiting in tandem with NASA’s Terra satellite to obtain near coincident observations.)
A Planet in Focus: Landsat 7's Legacy
Throughout its 26-year lifetime, Landsat 7 captured over 3 million images of our planet. These data were used in over 2,000 scientific publications, generated billions of dollars in economic benefits, and paved the way for the development of new and improved instruments for future Earth observing missions.
Learn MoreMission Results
-
Data Collection
Landsat 7’s ETM+ acquired 3,316,494 scenes during its 26-year lifetime. However, after the Scan Line Corrector (SLC) failed in 2003, approximately 22% of each subsequent image is missing. The USGS worked to create algorithms to address these data gaps, making the archive usable.
Landsat 7 data was processed by a more reliable network of ground stations than previous missions, which helped maintain a nearly continuous global record to greatly expand the Landsat archive.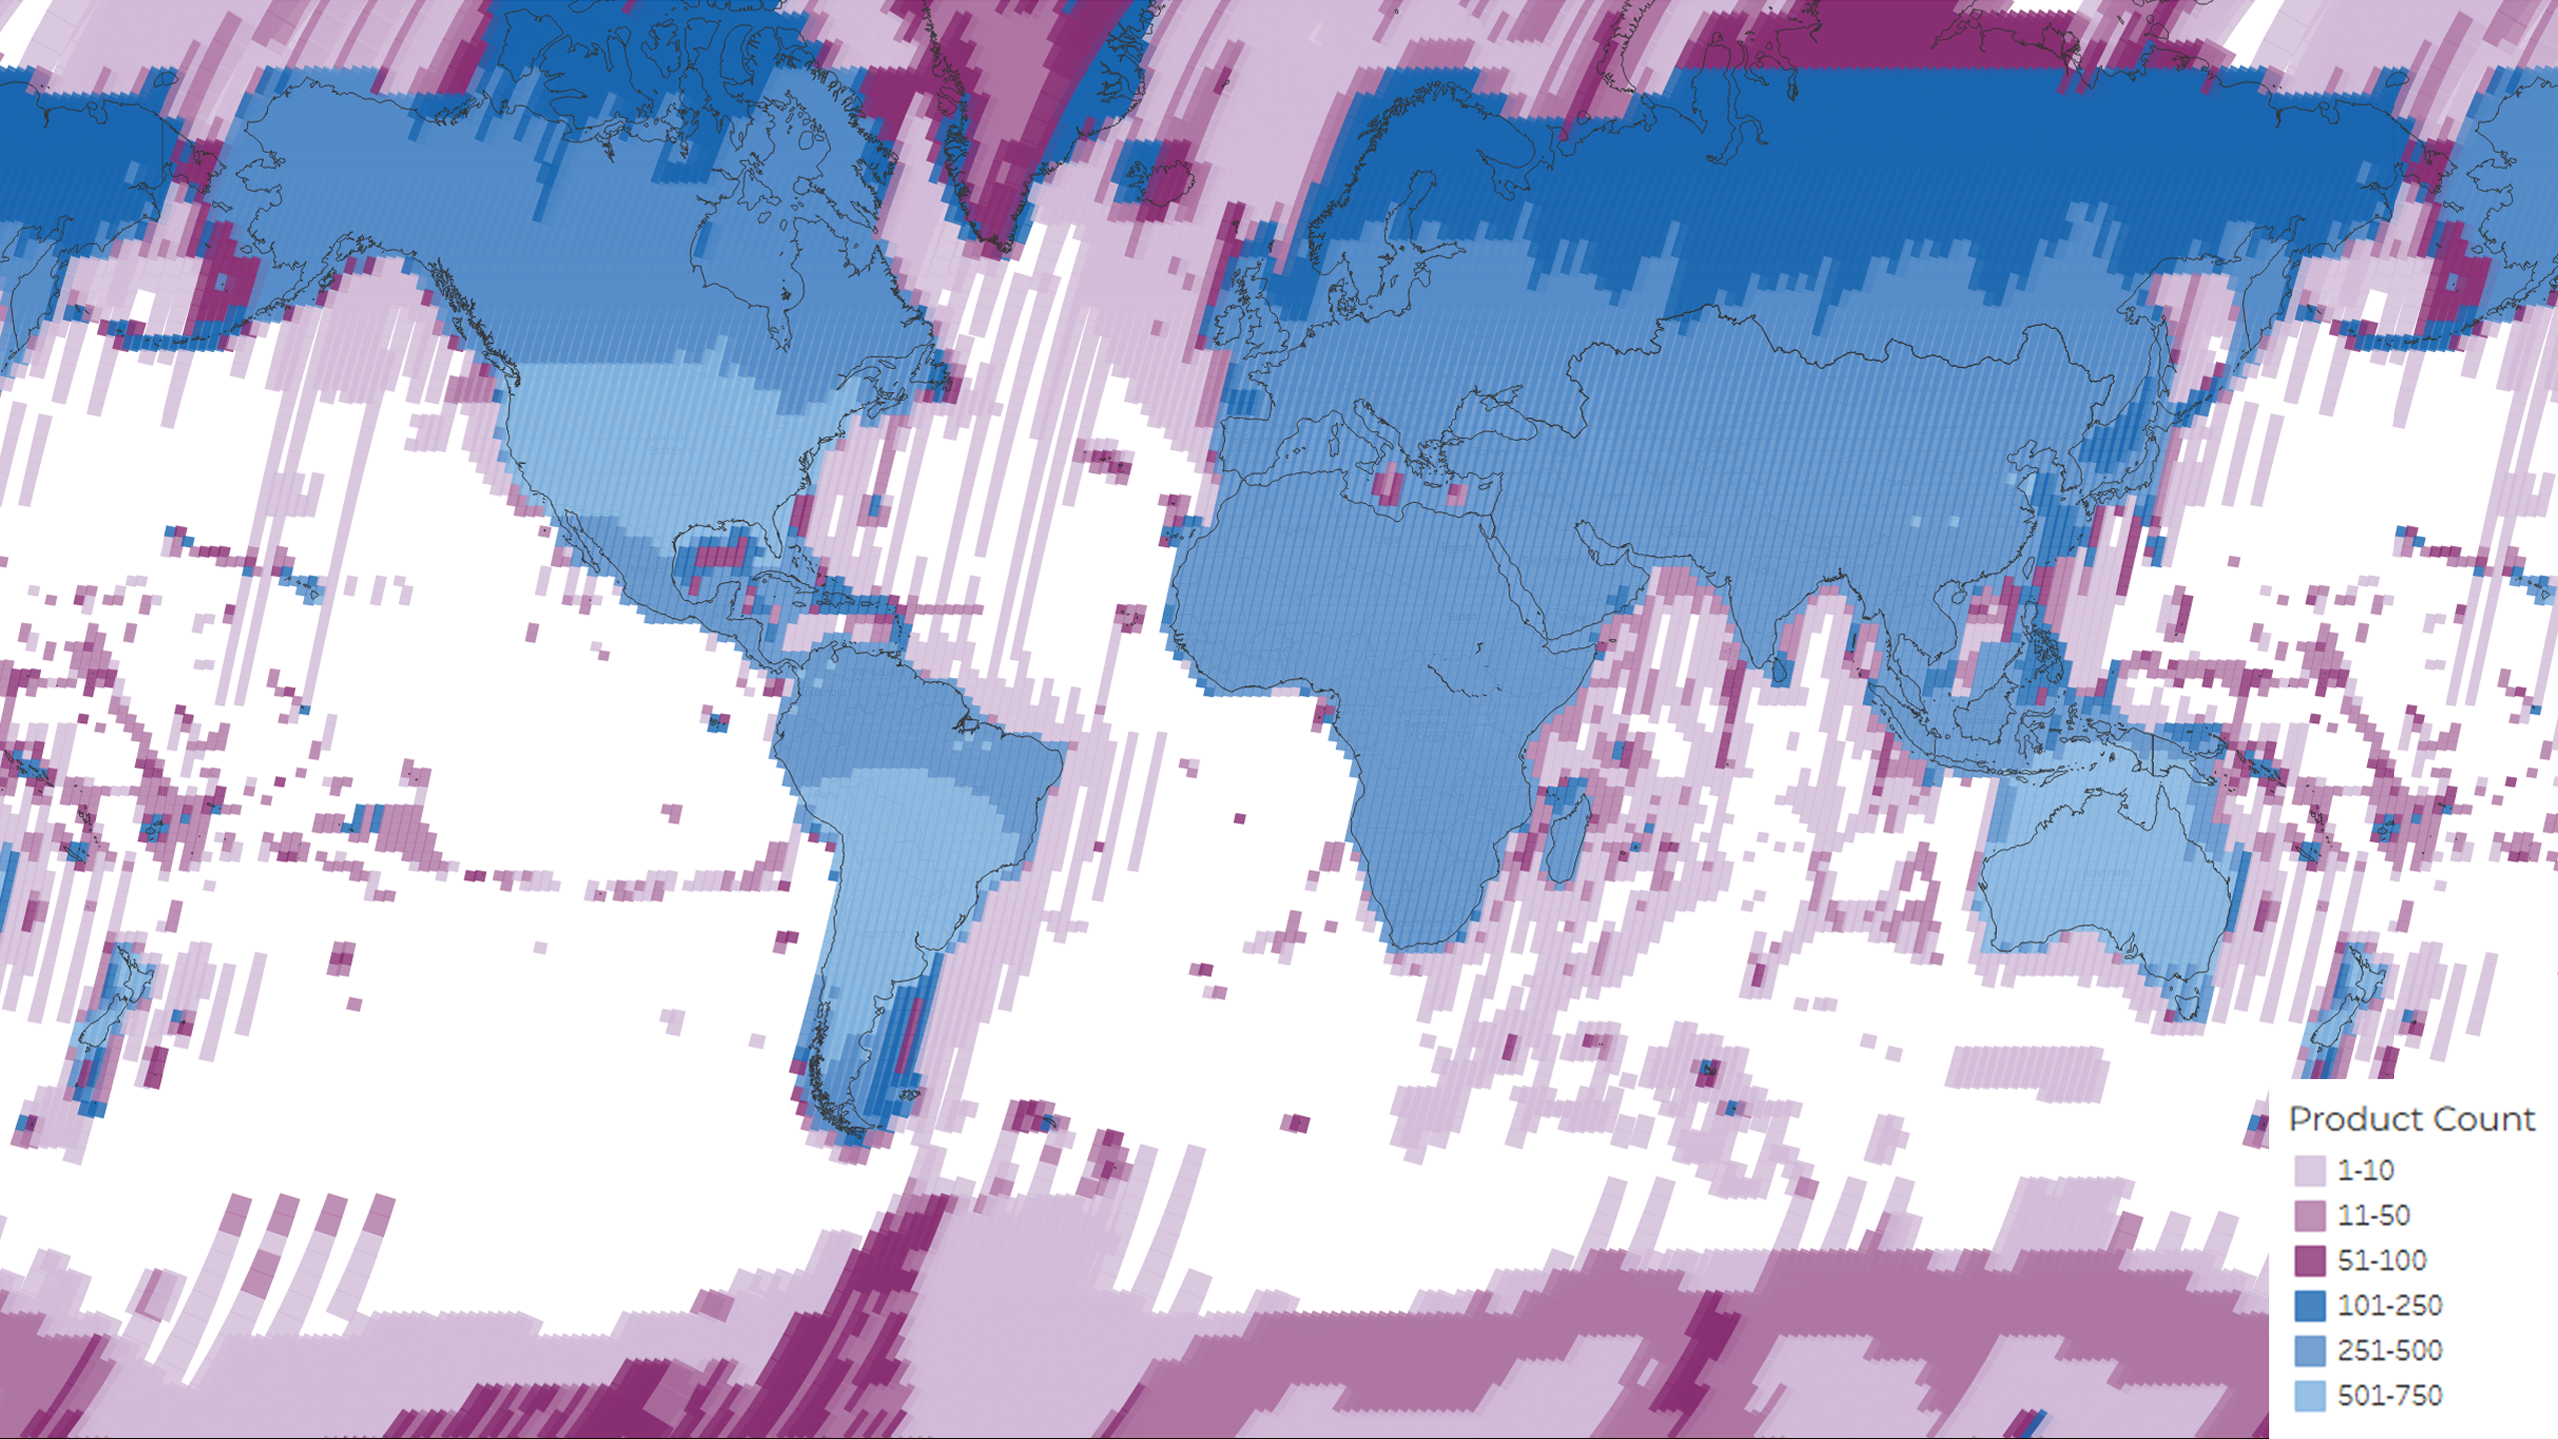 A density map showing the distribution of the total 3,316,494 ETM+ scenes acquired and archived during the lifetime of the Landsat 7 mission. The colors represent the number of products per Path/Row.USGS
 -
Global Coverage
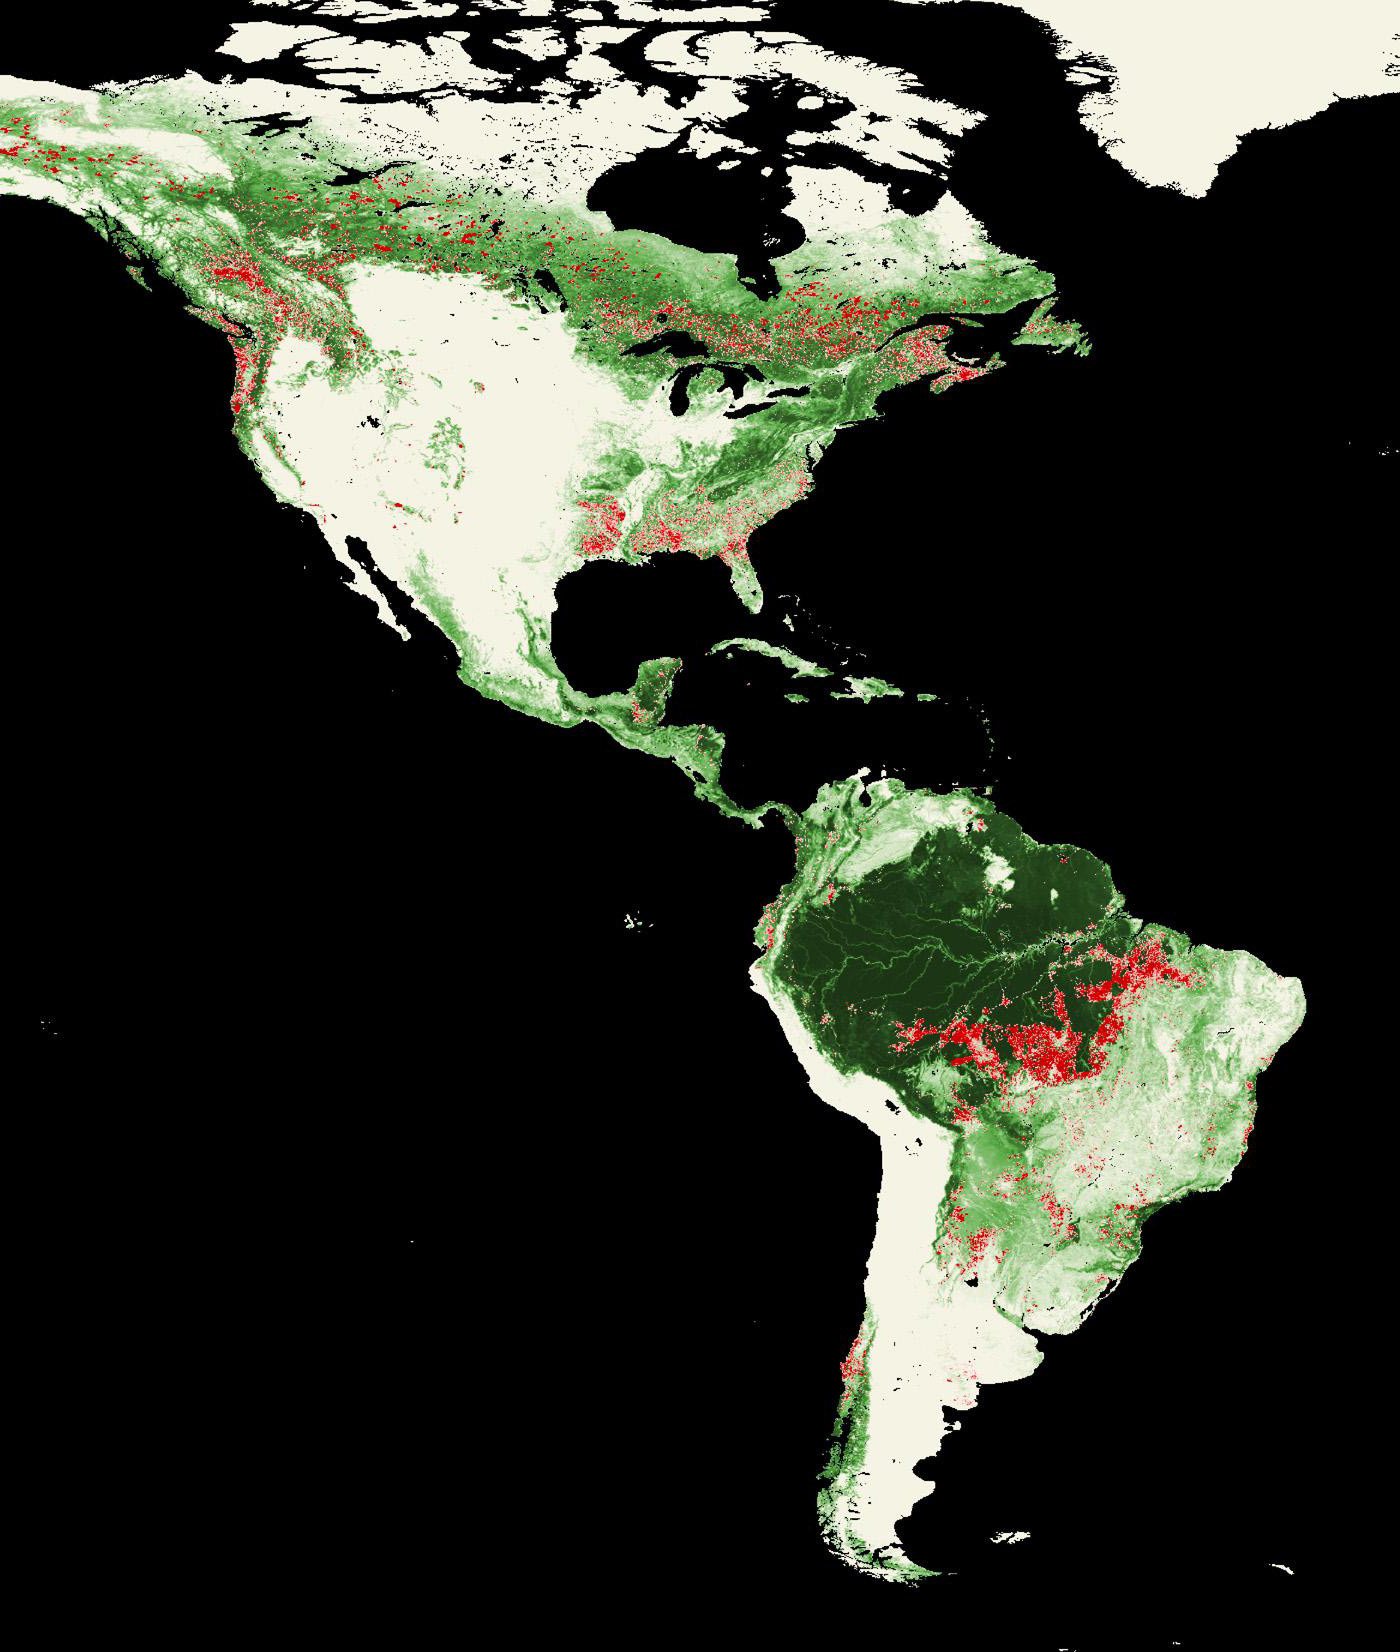
Landsat 7 played a pivotal role in global studies, capturing images of Earth’s surface every 16 days. While Landsats 4 and 5 only collected data over limited regions, Landsat 7 was designed to create and maintain a comprehensive global land data record. This objective formed the basis of the Long-term Acquisition Plan (LTAP)—Landsat 7’s method for systematically imaging Earth, ensuring consistent, sun-lit, nearly cloud-free coverage of land and coastal areas over time.
For the first time, scientists could use Landsat data to address large-scale questions about land cover, vegetation distribution, and forest dynamics. With free and georeferenced data, researchers generated long-term time series, performed data fusion with higher-resolution commercial imagery, and combined Landsat data with radar observations to penetrate through clouds and fog.
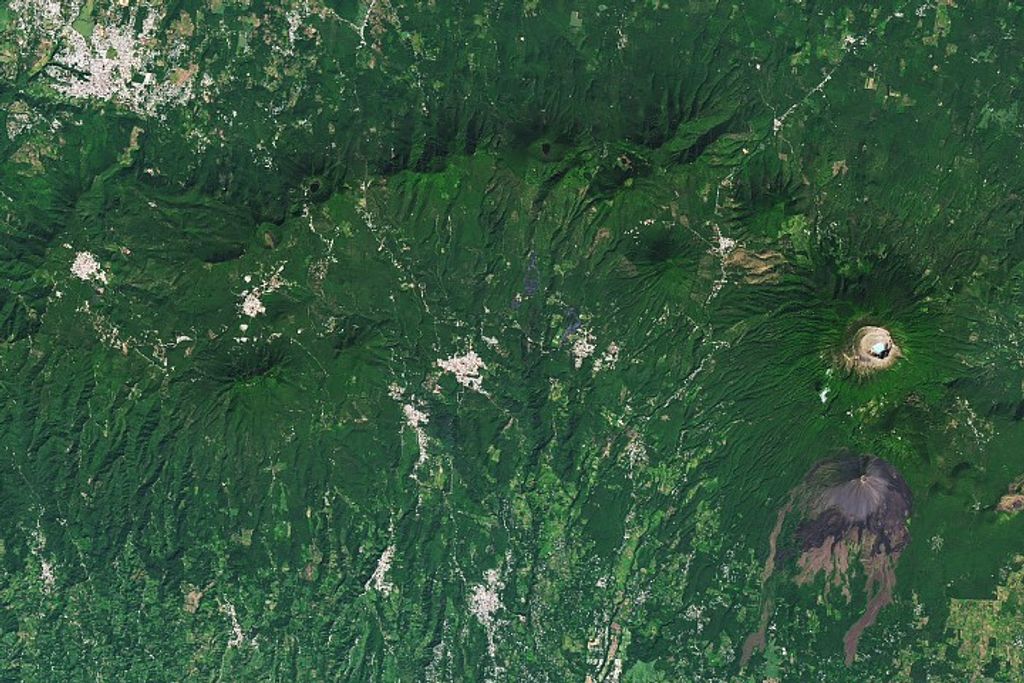
By the late 2000s, organizations including the UN Food and Agriculture Organizations and the European Commission’s Joint Research Center used Landsat data to study ecological areas at both the regional and global scale. The data also contributed to the development of the Global Land Survey (GLS) datasets, which provide standardized, science-quality products for multi-temporal analyses. Global mosaics were compiled using cloud-free imagery acquired over three consecutive years (2000, 2001, and 2002). These mosaics provide a snapshot of the world's land surface during that year.USGS
 -
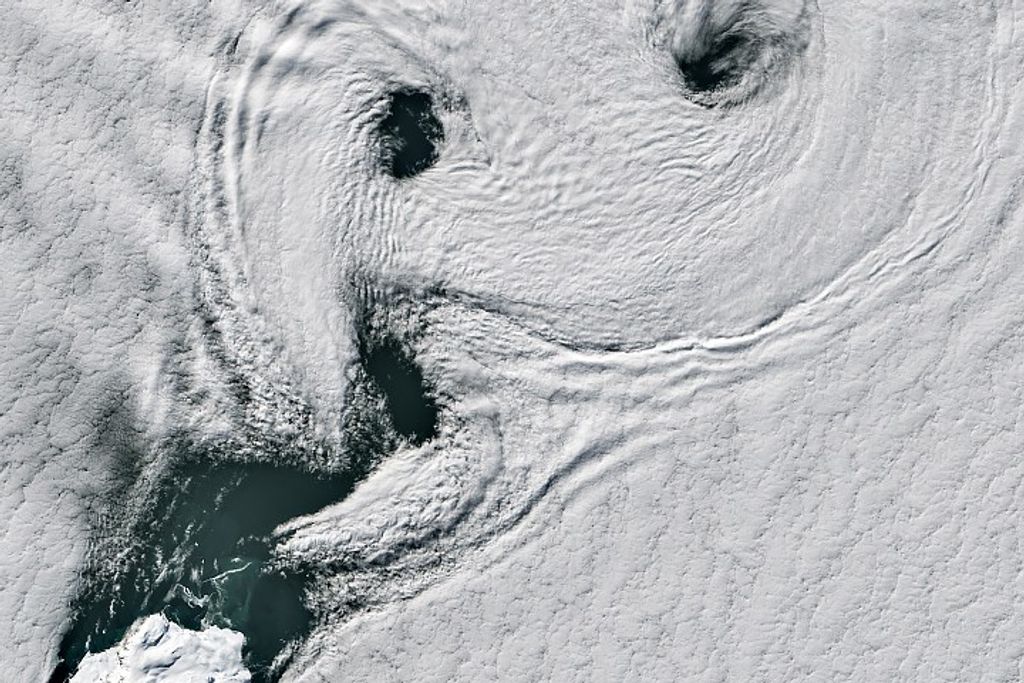
Landsat Image Mosaic of Antarctica (LIMA)
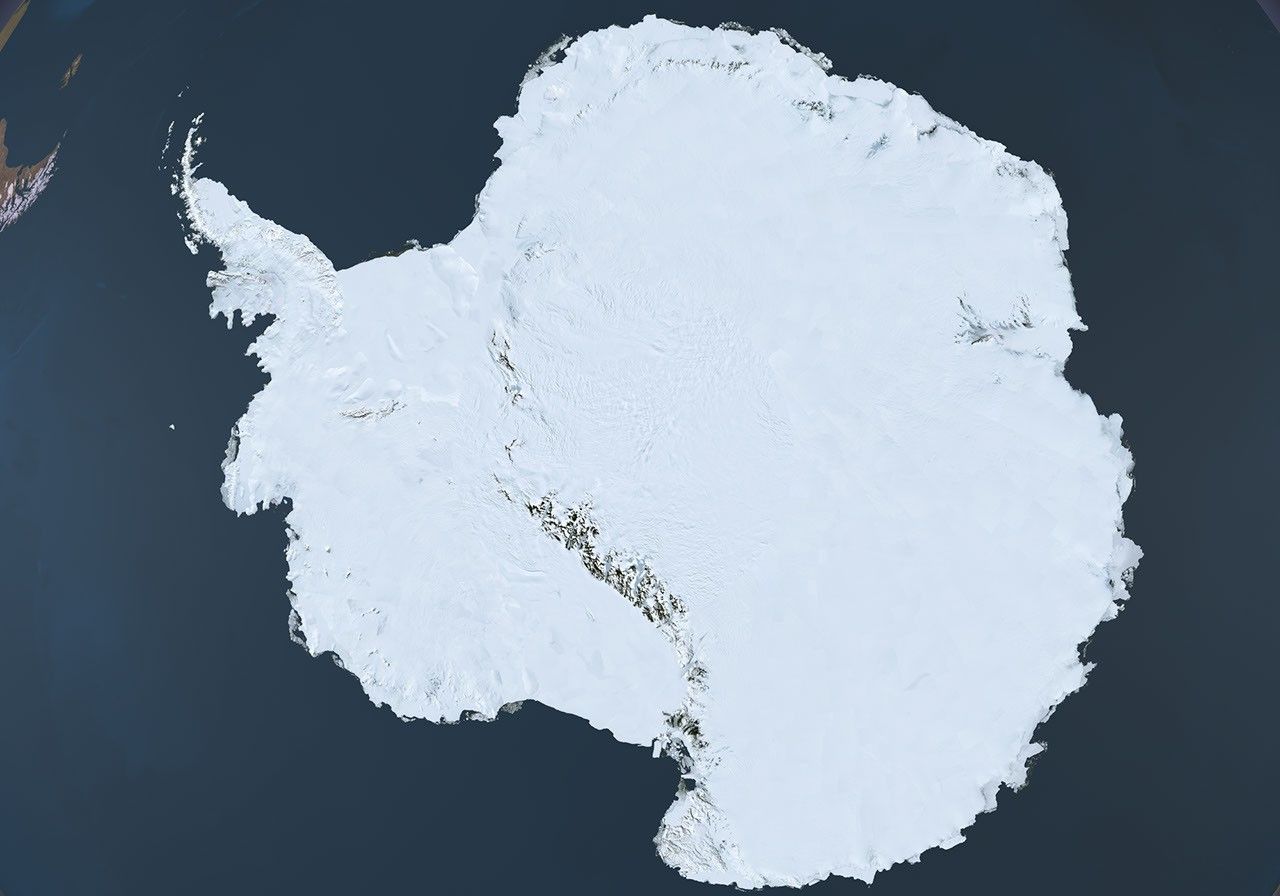
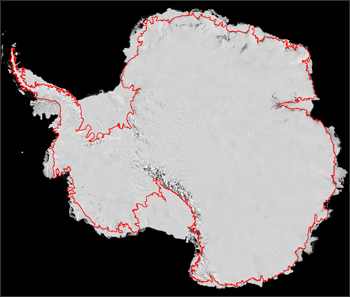
The Landsat Image Mosaic of Antarctica (LIMA), released in 2007, is a high-resolution dataset funded by the National Science Foundation (NSF) and jointly produced by the U.S. Geological Survey (USGS), the British Antarctic Survey (BAS), and NASA. It uses panchromatic 15-meter imagery collected by Landsat 7’s ETM+ sensor between 1999 and 2003, combining over 1,000 scenes to create a nearly cloud-free view of the continent.
Because Landsat does not fly directly over the poles, that area is filled with imagery from NASA’s MODIS Mosaic of Antarctica (MOA). LIMA demonstrates the value of Landsat data for producing large-scale, continuous mosaics and provides one of the most detailed continental-scale views available for cryospheric science.High-resolution image of Antarctica shown using the Landsat Image Mosaic of Antarctica (LIMA) data.NSF, USGS, NASA, BAS
featured image
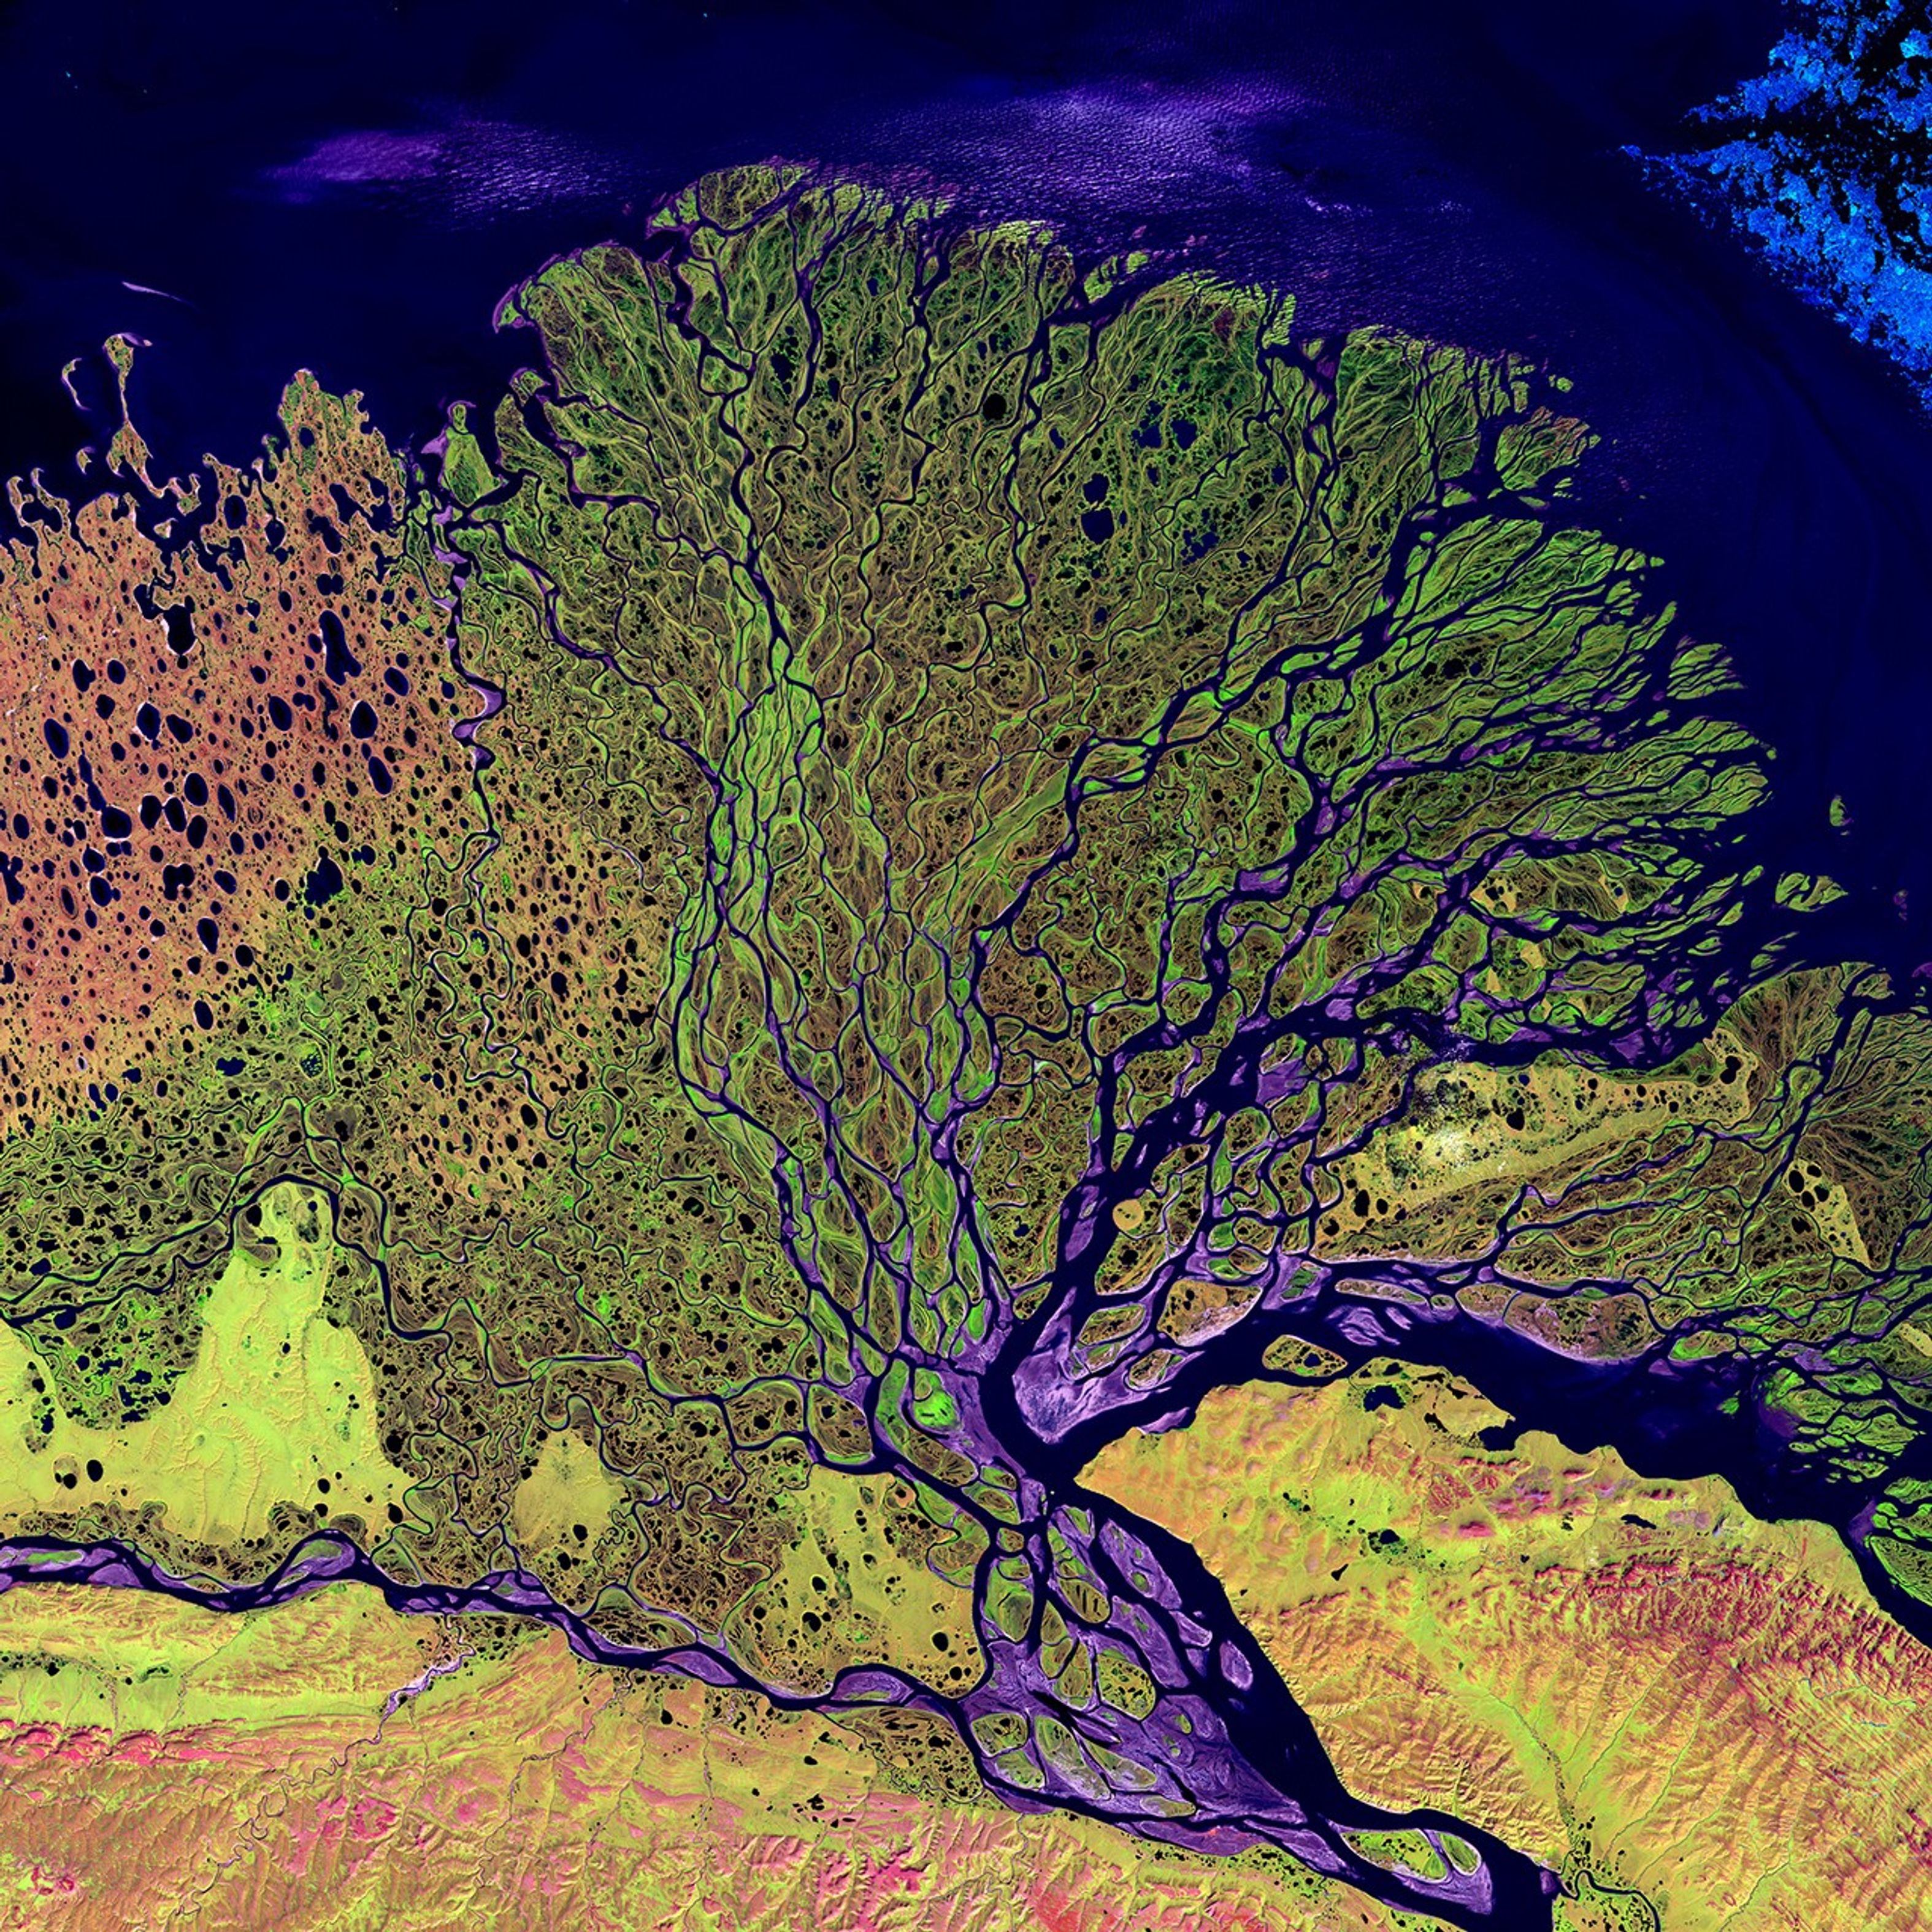
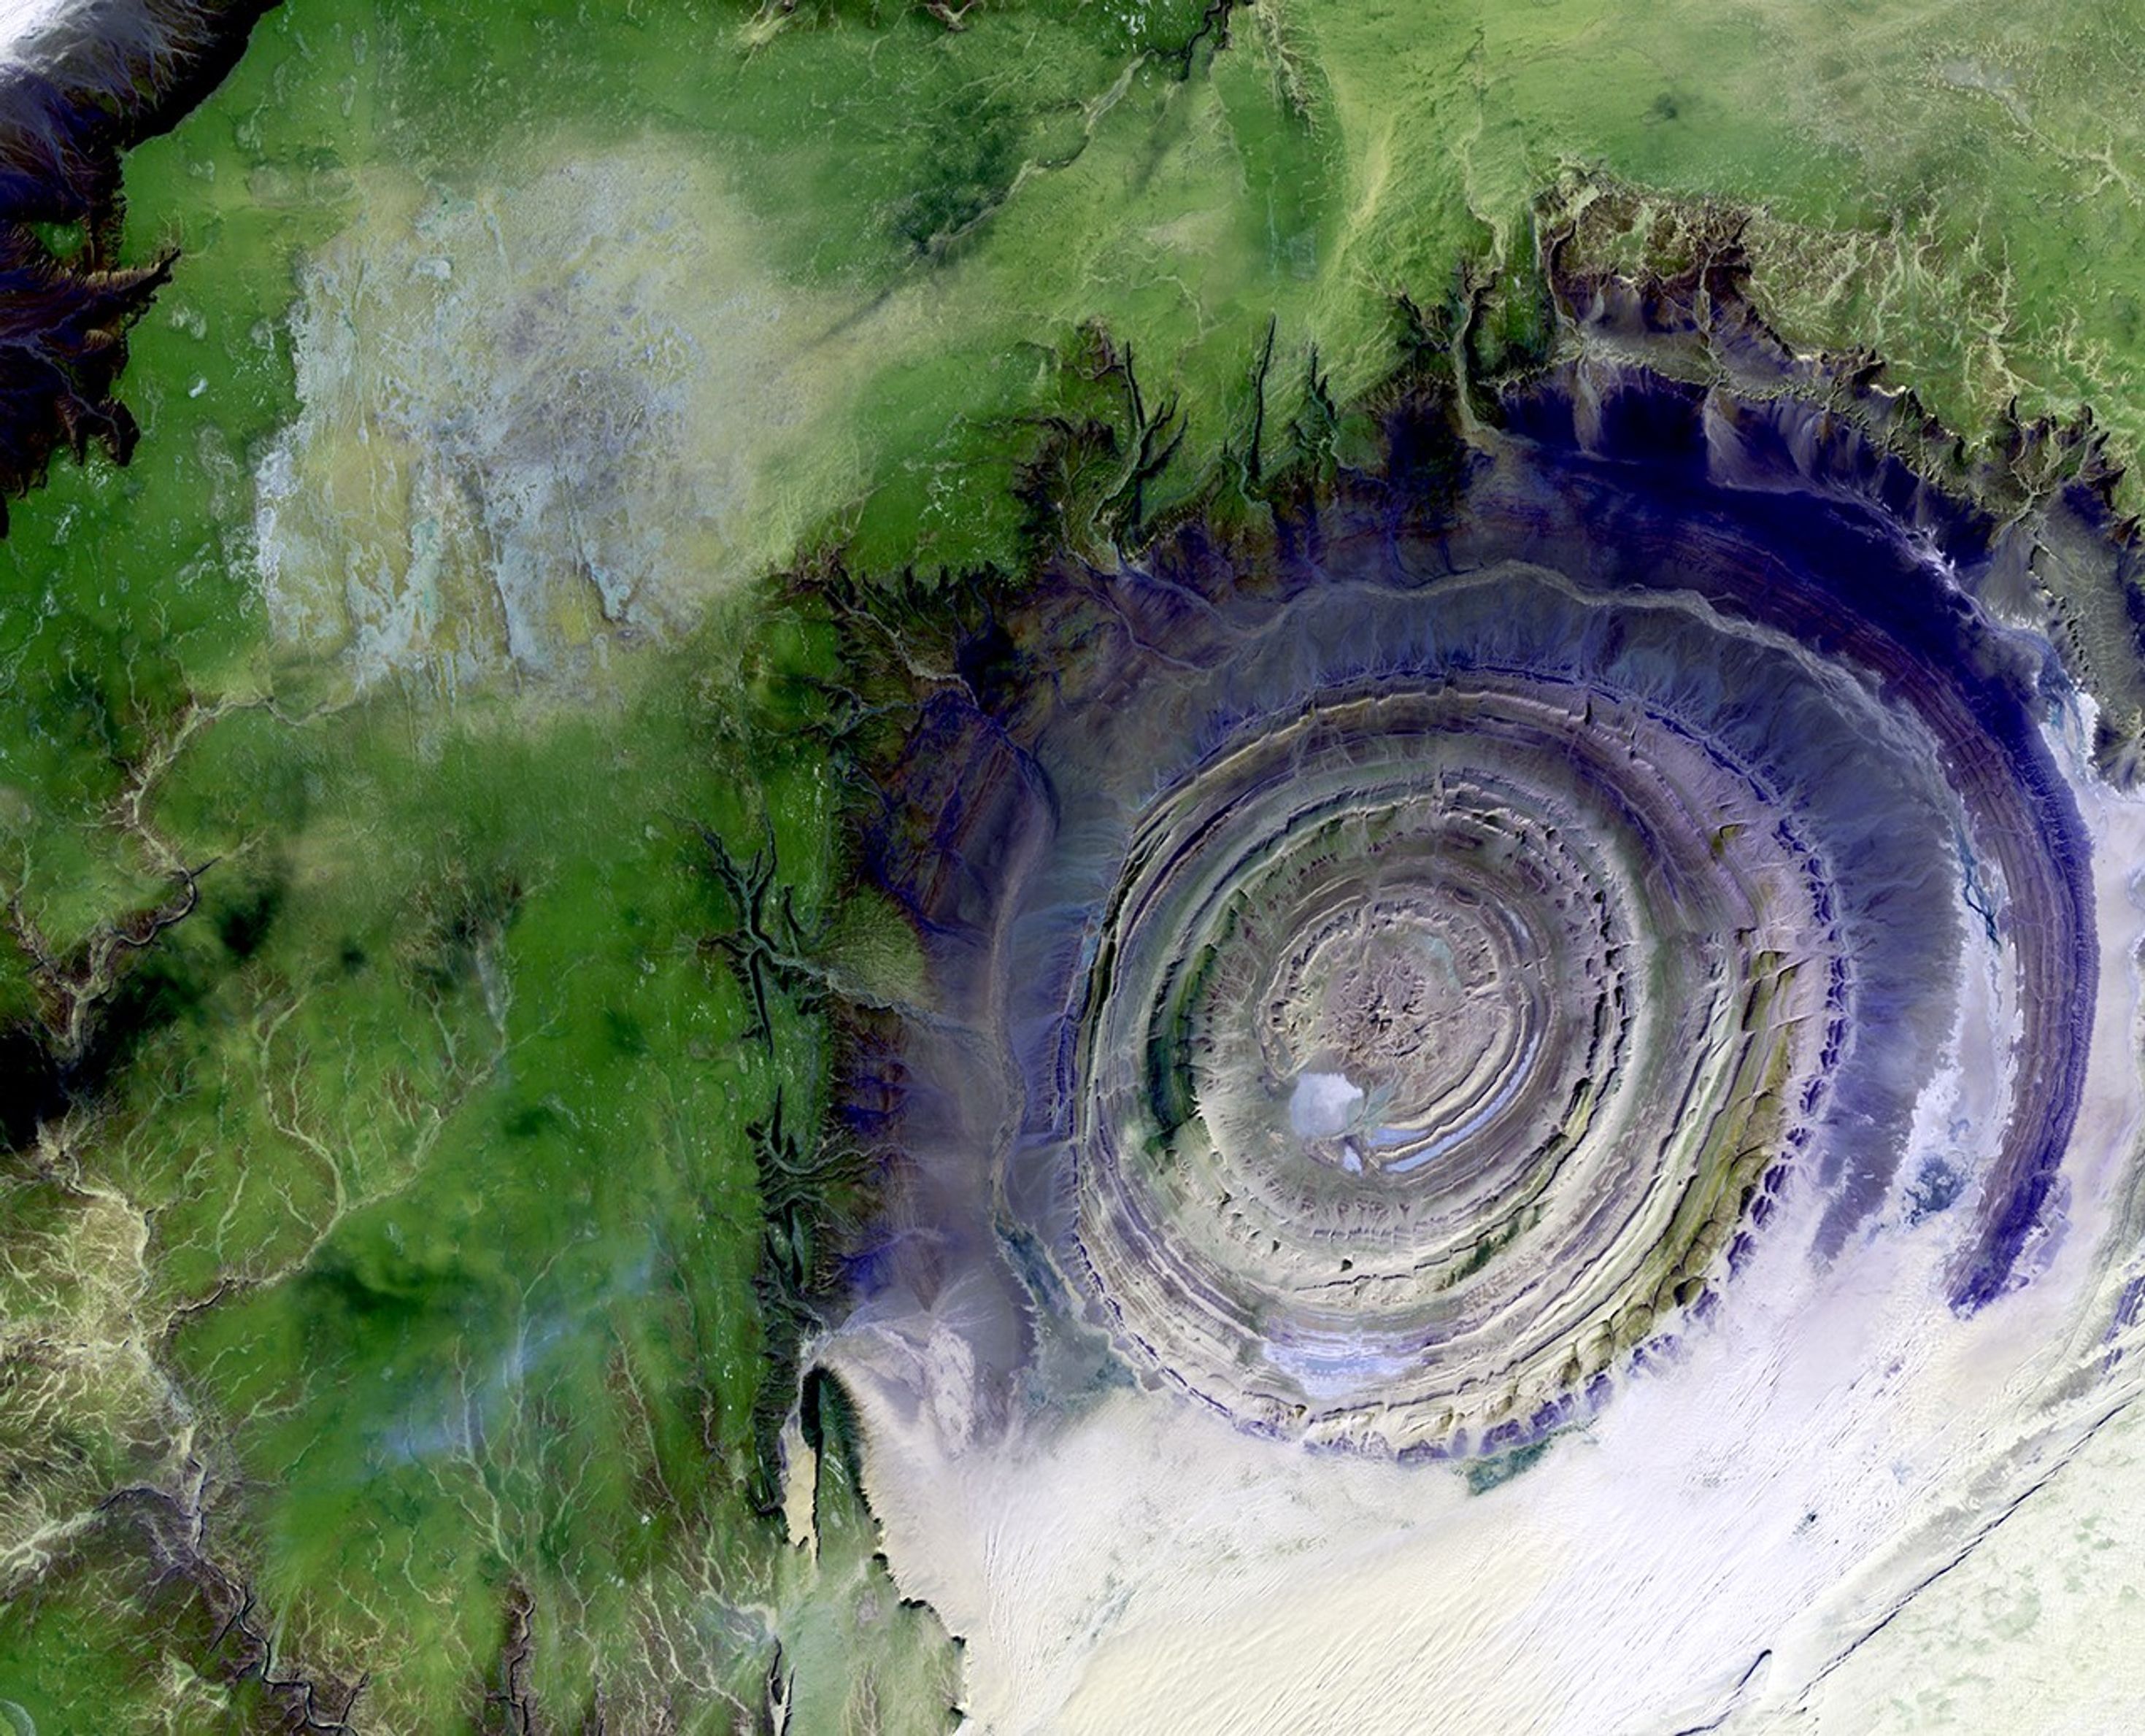
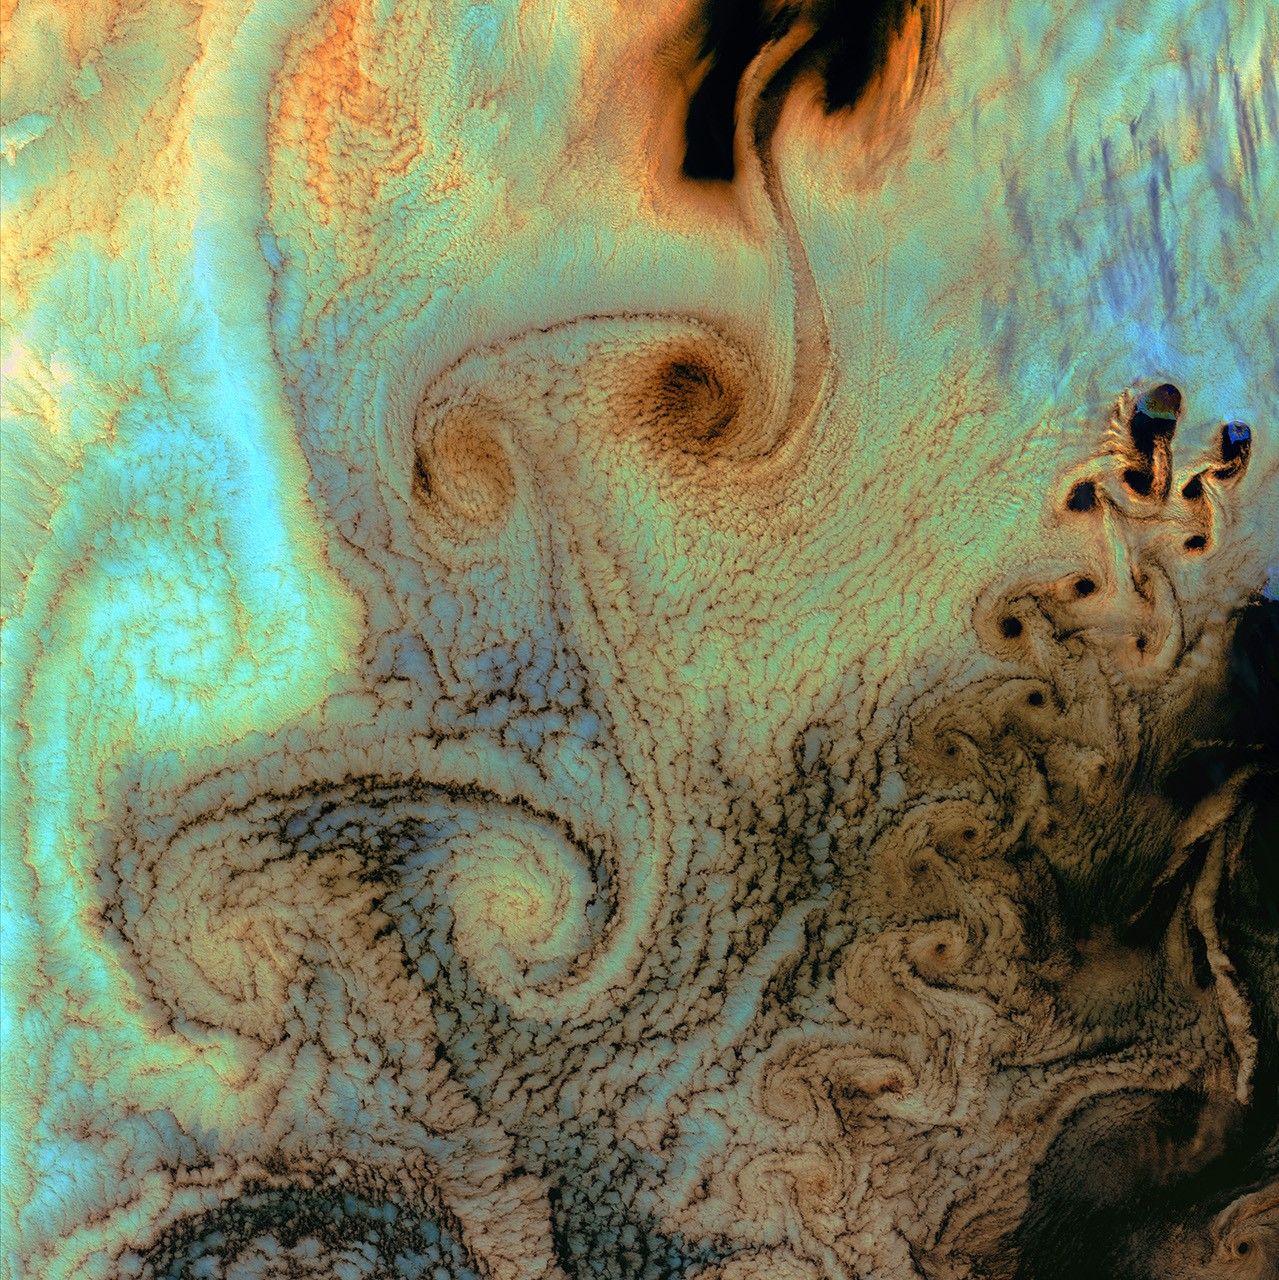
Lena River Delta
The USGS EROS Earth as Art gallery was created to showcase the beauty and diversity of Earth’s surface as seen from space.
This false-color image was acquired by the Landsat 7 ETM+ on July 1, 2000 and shows the Lena River Delta on the Laptev Sea in coastal Siberia. The Lena River Delta is the most extensive protected wilderness area in Russia.
Legacy
-
Scan Line Corrector (SLC) Failure
Within the first few years of its mission life, Landsat 7 experienced several hardware issues that were mitigated with built-in redundancies, or backup systems designed to take over if components fail. However, the Scan Line Corrector (SLC), a critical mechanism designed to compensate for the satellite’s forward motion during imaging, did not have a redundant unit. On May 31, 2003, the SLC malfunctioned due to a power supply issue, causing the oscillating mirror to stop steering the sensor’s view. This failure resulted in image gaps towards the edges of each scene as Landsat 7 moved along its orbit.
ETM+ imaging was temporarily suspended while engineers investigated the issue. After months of testing, they determined the SLC failure was irreversible. Landsat 7 continued acquiring data, but 22% of each image was lost. To ensure the data was still useful, the USGS developed products that filled the gaps in the images by merging several consecutive scenes. The SLC failure highlighted the importance of onboard redundancy for critical sensor components and informed the design of future satellites. Landsat 7 ETM+ geometrically-corrected ETM+ sub-scenes of the San Francisco Bay area acquired left: before, and right: after, the scan line corrector (SLC) failure. Each shows only the western half of a whole scene; note a “sweet spot” of no gaps toward the right side of the post-failure (right) image (this corresponds to the center of the full scene).USGS/L. Rocchio
 -
Free and Open Data
In the early years of the Landsat program, data were expensive—nearly $4,000 per scene in the 1980s and ‘90s. This changed in 2008 when the USGS opened the EROS Landsat data archive to all completely free of charge. Barbara Ryan, USGS Associate Director of Geography at the time, spearheaded this effort in response to the growing recognition that Landsat data were essential for environmental monitoring and decision-making, and that the pay-per-scene model was limiting scientific innovation.
Removing cost barriers for Landsat data enabled a new era of Earth science. The open archive prompted the development of large-scale land cover studies, vegetation indices, and long-term change over time assessments. Researchers used Landsat 7 data to create products such as the Web-enabled Landsat data (WELD), the Landsat Ecosystem Disturbance Adaptive Processing System (LEDAPS), and the Australian National Carbon Accounting System (NCAS).
The policy dramatically expanded the Landsat data user community and set a precedent for open-access satellite programs worldwide, like the European Space Agency (ESA) Copernicus Program.
“We show governments across the world that it makes financial sense to release broadly and openly the data that the taxpayer has already paid for. It will build your economy, it is certainly good for transparent government, and it is a boon for capacity building and education,“ said Barbara Ryan in a presentation at Geospatial World in 2017. The number of Landsat-related citations (orange line) and the cost per scene (blue line) from 1970 to 2022.USGS
Project and Program Management

Darrel Williams
Landsat 7 Project Scientist
Jim Irons
Deputy Landsat 7 Project Scientist
Phil Sabelhaus
Landsat 7 Project Manager
George J. Komar
NASA Headquarters Program Executive

Tom Loveland
USGS Landsat 7 Project Scientist

R.J. Thompson
USGS Landsat 7 Project Manager
Related Resources
Landsat 7 Data Users Handbook
This USGS EROS document provides information about the Landsat 7 mission and its science products.
Landsat 7 Press Kit
This NASA press kit details the spacecraft history, science objectives, research projects, and other information prior to the launch of Landsat 7.
Landsat 7 Graphics Library

Selected Publications
Arvidson, T., Gasch, J., & Goward, S. N. (2001). Landsat 7’s long-term acquisition plan — an innovative approach to building a global imagery archive. Remote Sensing of Environment, 78(1-2), 13–26. https://doi.org/10.1016/s0034-4257(01)00263-2
Goward, S. N., Masek, J. G., Williams, D. L., Irons, J. R., & Thompson, R. J. (2001). The Landsat 7 mission: Terrestrial research and applications for the 21st century. Remote Sensing of Environment, 78(1-2), 3–12. https://doi.org/10.1016/s0034-4257(01)00262-0
Kovalskyy, V., & Roy, D. P. (2013). The global availability of Landsat 5 TM and Landsat 7 ETM+ land surface observations and implications for global 30m Landsat data product generation. Remote Sensing of Environment, 130, 280–293. https://doi.org/10.1016/j.rse.2012.12.003
Markham, B. L., Haque, Md. O., Barsi, J. A., Micijevic, E., Helder, D. L., Thome, K. J., Aaron, D., & Czapla-Myers, J. S. (2012). Landsat-7 ETM+: 12 Years On-Orbit Reflective-Band Radiometric Performance. IEEE Transactions on Geoscience and Remote Sensing, 50(5), 2056–2062. https://doi.org/10.1109/tgrs.2011.2169803
Masek, J. G., Honzak, M., Goward, S. N., Liu, P., & Pak, E. (2001). Landsat-7 ETM+ as an observatory for land cover. Remote Sensing of Environment, 78(1-2), 118–130. https://doi.org/10.1016/s0034-4257(01)00254-1
Roy, D. P., Ju, J., Kline, K., Scaramuzza, P. L., Kovalskyy, V., Hansen, M., Loveland, T. R., Vermote, E., & Zhang, C. (2010). Web-enabled Landsat Data (WELD): Landsat ETM+ composited mosaics of the conterminous United States. Remote Sensing of Environment, 114(1), 35–49. https://doi.org/10.1016/j.rse.2009.08.011
Roy, D. P., Kovalskyy, V., Zhang, H. K., Vermote, E. F., Yan, L., Kumar, S. S., & Egorov, A. (2016). Characterization of Landsat-7 to Landsat-8 reflective wavelength and normalized difference vegetation index continuity. Remote Sensing of Environment, 185, 57–70. https://doi.org/10.1016/j.rse.2015.12.024
Storey, J. C., Scaramuzza, P., Schmidt, G. L., & Barsi, J. (2025). Landsat 7 scan line corrector-off gap-filled product development. Usgs.gov. https://pubs.usgs.gov/publication/70259127
Thome, K. J. (2001). Absolute radiometric calibration of Landsat 7 ETM+ using the reflectance-based method. Remote Sensing of Environment, 78(1-2), 27–38. https://doi.org/10.1016/s0034-4257(01)00247-4
Wulder, M. A., Masek, J. G., Cohen, W. B., Loveland, T. R., & Woodcock, C. E. (2012). Opening the archive: How free data has enabled the science and monitoring promise of Landsat. Remote Sensing of Environment, 122, 2–10. https://doi.org/10.1016/j.rse.2012.01.010
Zhu, Z., Wulder, M. A., Roy, D. P., Woodcock, C. E., Hansen, M. C., Radeloff, V. C., Healey, S. P., Schaaf, C., Hostert, P., Strobl, P., Pekel, J.-F., Lymburner, L., Pahlevan, N., & Scambos, T. A. (2019). Benefits of the free and open Landsat data policy. Remote Sensing of Environment, 224, 382–385. https://doi.org/10.1016/j.rse.2019.02.016