Suggested Searches

5 min read

What Can We Learn from the Universe’s Baby Picture?

Scientists examine the universe’s “baby picture” for clues about how it grew into the cosmos we know now.

If you look at your baby photos, you might see hints of the person you are today — a certain look in the eyes, maybe the hint of your future nose or ears. In the same way, scientists examine the universe’s “baby picture” for clues about how it grew into the cosmos we know now. This baby photo is the cosmic microwave background (CMB), a faint glow that permeates the universe in all directions.

Over the years, several telescopes have been tasked with observing the universe’s baby picture. One of them is PIPER, the Primordial Inflation Polarization Explorer, which flies at the edge of our atmosphere on a balloon to look for subtle patterns in the CMB.

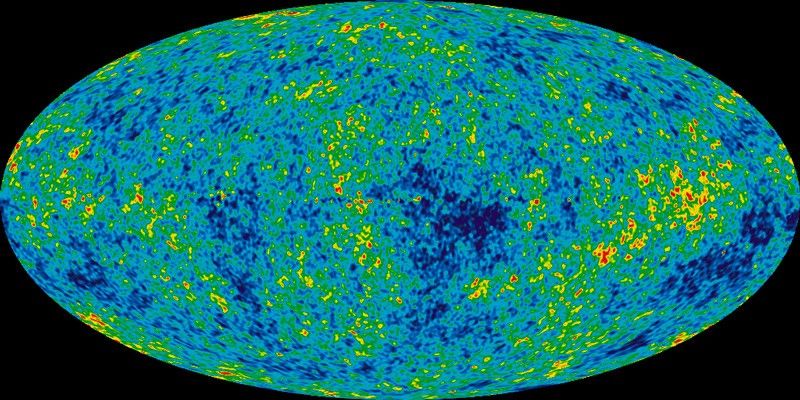
This image shows an oval that represents the whole sky if you folded it out onto a flat piece of paper. The oval is dotted with many regions ranging from blue, green, yellow, and red in color. While the image looks chaotic, the blue regions are nearly always surrounded by green. The yellow are embedded in the green, and red embedded in the yellow. These show temperature differences in the early universe, which ultimately lead us to see where matter clumped together to form the structures we see today.
This detailed, all-sky picture of the infant universe created from nine years of WMAP data reveals 13.77-billion-year-old temperature fluctuations (shown as color differences) that correspond to the seeds that grew to become the galaxies.
NASA/WMAP Science Team

The CMB is cold. Really, really cold. The average temperature is around minus 455 degrees Fahrenheit. It formed 380,000 years after the big bang, which scientists think happened about 13.8 billion years ago. When it was first discovered, the CMB temperature looked very uniform, but researchers later found there are slight variations like hot and cold spots. The CMB is the oldest light in the universe that we can see. Anything before the CMB is foggy — literally.

Before the CMB, the universe was a fog of hot, dense plasma. (By hot, we’re talking about 500 million degrees F.) That’s so hot that atoms couldn’t exist yet – there was just a soup of electrons and protons. Electrons are great at deflecting light. So, any light that existed in the first few hundred thousand years after the big bang couldn’t travel very far before bouncing off electrons, similar to the way a car’s headlights get diffused in fog.
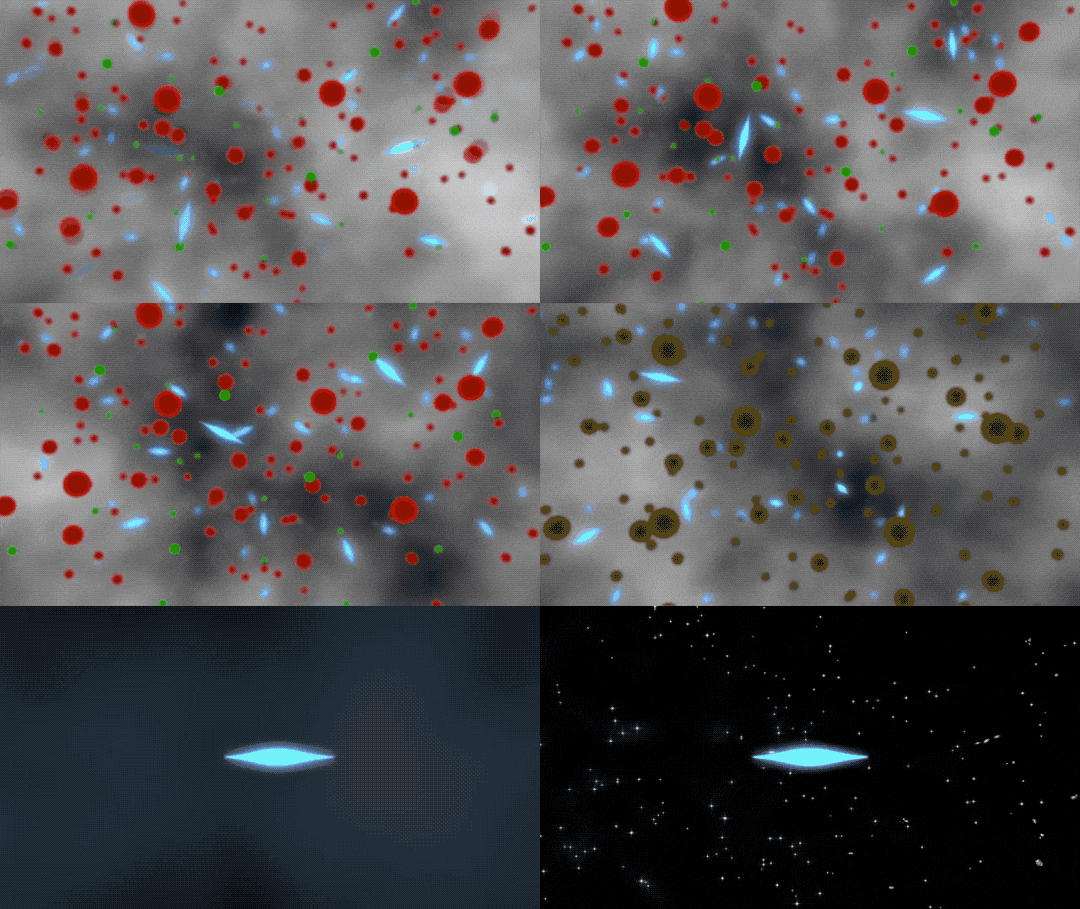
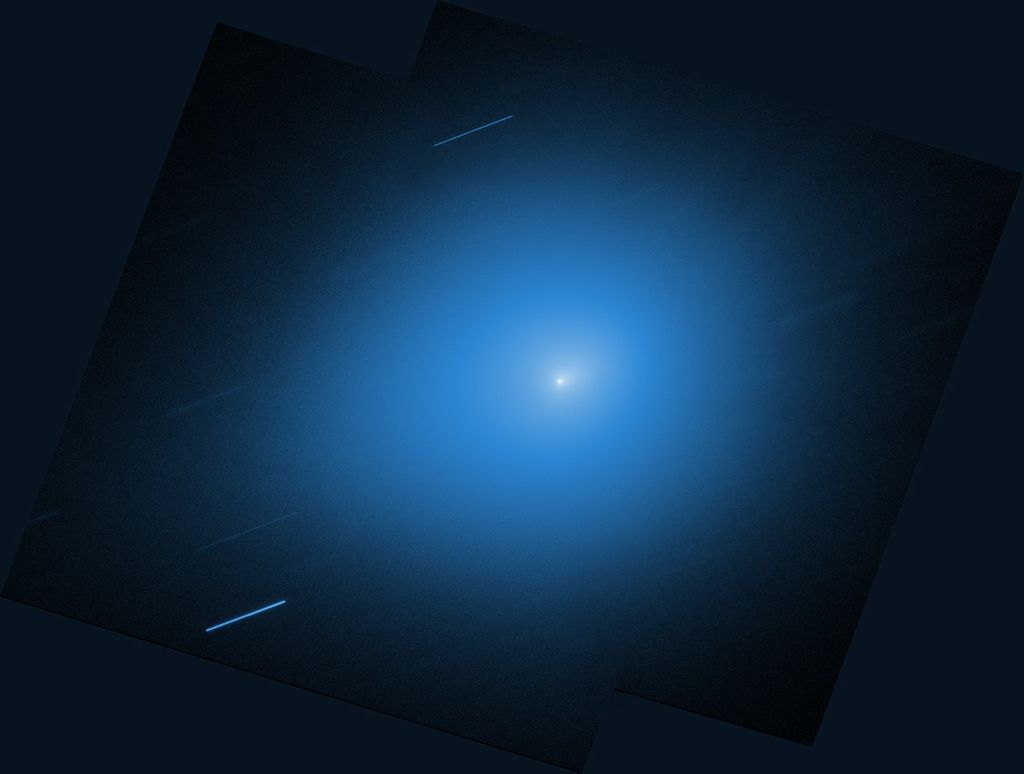
Against a background looking like a fog, a number of red and green particles appear to dance with blue blobs. Then, the red and green particles combine into grey particles, and the blue blobs zoom off. The camera follows one blob as the background turns from a fog, to black, and finally to a starry sky.
Just 370,000 years after the universe began, all that existed was a hot plasma similar to a candle flame. Protons and electrons (red and green balls) were bouncing around scattering the light. Particles of light, called photons (blue), couldn’t go far without colliding with an electron. As the universe cooled, the protons and electrons could pair up, forming hydrogen atoms, and the light was free to travel.
NASA/JPL

After the big bang, the universe started expanding rapidly in all directions. This expansion is still happening today. As the universe continued to expand, it cooled. By the time the universe reached its 380,000th birthday, it had cooled enough that electrons and protons could combine into hydrogen atoms for the first time. (Scientists call this era recombination.) Hydrogen atoms don’t deflect light nearly as well as loose electrons and the fog lifted. Light could now travel long distances across the universe.

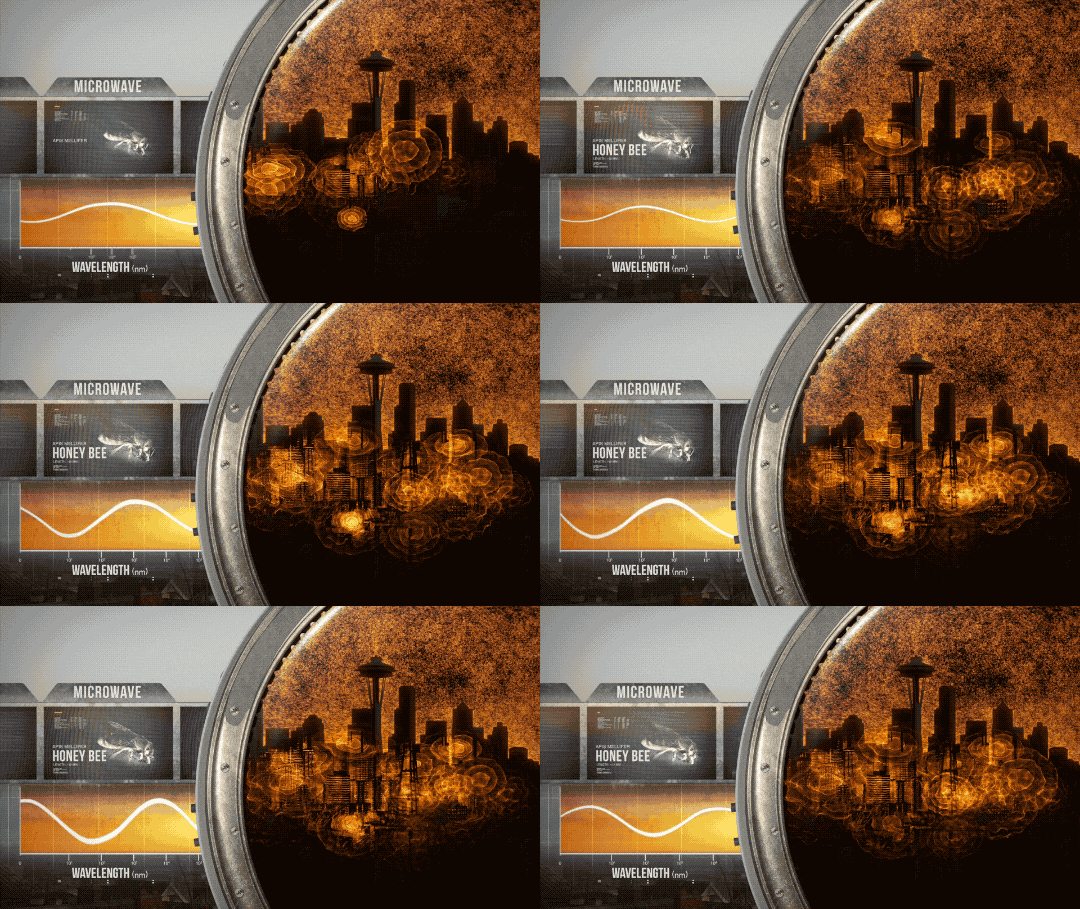
This animation shows some characteristics of microwave light and where it is seen in a city like Seattle. A honeybee cleans its antennae in a box on the left side, representing the physical size of microwave wavelengths. In a circle on the rights is an image of Seattle silhouetted by an orange sky, which emanates microwaves. There are also small circles of orange throughout the city, showing where people use them, especially in cooking.
This animation depicts the microwave segment of the electromagnetic spectrum.
NASA’s Goddard Space Flight Center/Conceptual Image Lab

The light we see in the CMB comes from the recombination era. As it traveled across the universe, through the formation of stars and galaxies, it lost energy. Now we observe it in the microwave part of the electromagnetic spectrum, which is less energetic than visible light and therefore invisible to our eyes. The first baby photo of the CMB – really, a map of the sky in microwaves – came from our Cosmic Background Explorer, which operated from 1989 to 1993.

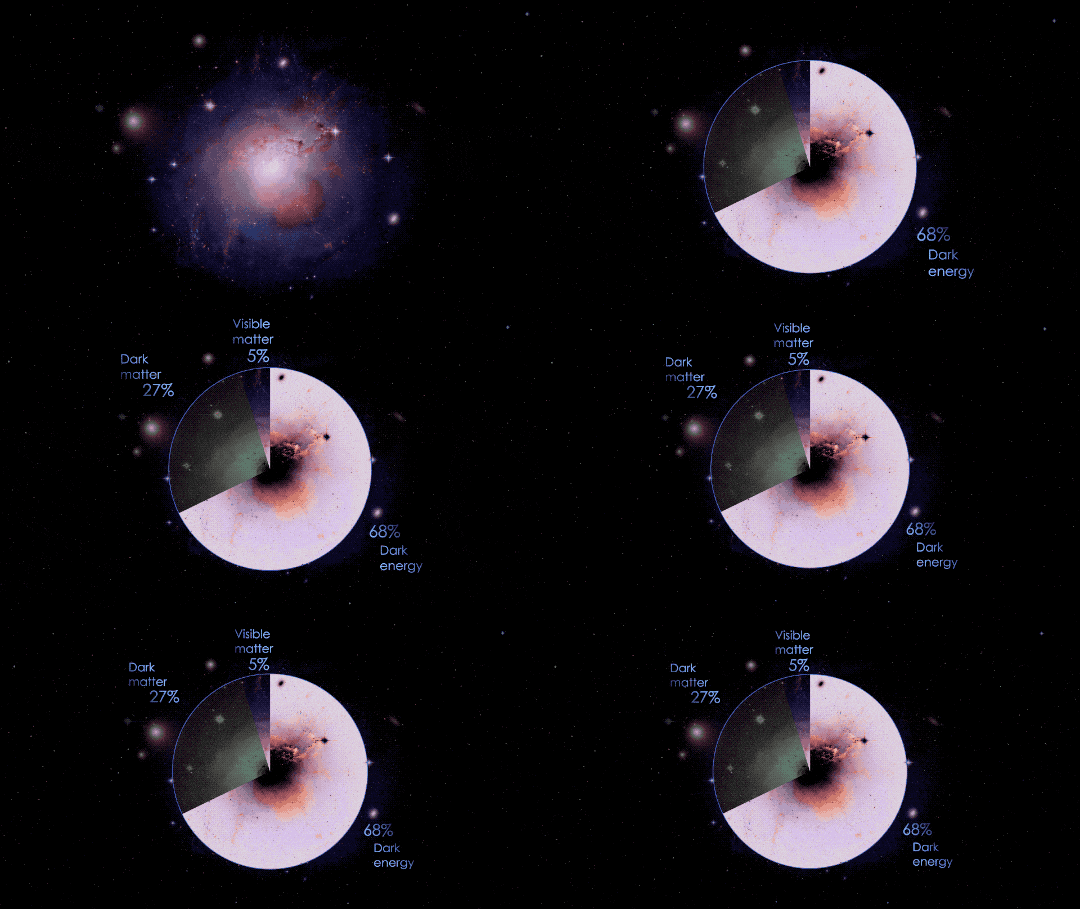
This animated GIF opens on a galaxy in the background upon which a pie chart is drawn. A radius of the circular chart sweeps around counterclockwise, the first 5% of the circle represents visible matter at 5% of the known matter of the universe. The next 27% is dark matter. The final 68% is dark energy.
This animated pie chart shows the values for the three known components of the universe: normal matter (5%), dark matter (27%), and dark energy (68%).
NASA’s Goddard Space Flight Center

Why are we so interested in the universe’s baby picture? Well, it’s helped us learn a lot about the structure of the universe around us today. For example, the Wilkinson Microwave Anisotropy Probe produced a detailed map of the CMB and helped us learn that the universe is 68 percent dark energy, 27 percent dark matter and just 5 percent normal matter — the stuff that you and stars are made of.

This animation opens on a bright explosion which fills the screen with white, which then fades back to a point at the center of the screen. As the point fades, galaxies rush from the center of the image off the screen, as though passing by the viewer.
Astronomers think the universe began about 13.8 billion years ago, expanding rapidly from a very dense and incredibly hot state, as shown in this animation.
NASA’s Goddard Space Flight Center/Conceptual Image Lab

Right after the big bang, we’re pretty sure the universe was tiny. Really tiny. Everything we see today would have been stuffed into something smaller than a proton. If the universe started out that small, then it would have followed the rules of quantum mechanics. Quantum mechanics allows all sorts of strange things to happen. Matter and energy can be “borrowed” from the future then crash back into nothingness. And then cosmic inflation happened and the universe suddenly expanded by a trillion trillion times.

This illustration shows the difference between two types of polarization, which is a measure of the organization of light. The top of the image says “Polarization.” On the left is “E-Mode.” At the beginning of the animation, there is a circle of lines that forms a kind of 8-pointed star similar to an asterisk, but with the middle of the star missing. A second copy of this figure “folds” out to the right. Then the second figure slides back to the position of the original one, exactly covering the original. The two figures, the original and the “folded out” one are the same. On the right side of the figure is “B-Mode” polarization. The starting figure here shows a circle of eight lines, this time each one is at an angle from an imaginary central circle, kind of like a pinwheel that opens up clockwise. A second copy of this figure folds out to the left, making a second copy that is like a pinwheel that opens counterclockwise. When the second copy slides back onto the original, the lines make x’s on the top, right, bottom, and left, and plus signs between each of the x’s. This shows that the original figure and its folded-out version are not the same.
The cosmic microwave background (CMB) is a faint glow that permeates the universe in all directions. When scientists look closely, they can see distinct patterns in the light of the CMB called E-mode and B-mode. B-mode patterns change value when reflected in a mirror, while E-mode patterns do not.
NASA’s Goddard Space Flight Center

All this chaos creates a sea of gravitational waves. (These are called “primordial” gravitational waves and come from a different source than the gravitational waves you may have heard about from merging neutron stars and black holes.) The signal of the primordial gravitational waves is a bit like white noise, where the signal from merging dead stars is like a whistle you can pick up over the noise.

These gravitational waves filled the baby universe and created distinct patterns, called B-mode polarization, in the CMB light. These patterns have handedness, which means even though they’re mirror images of each other, they’re not symmetrical — like trying to wear a left-hand glove on your right hand. They’re distinct from another kind of polarization called E-mode, which is symmetrical and echoes the distribution of matter in the universe.

That’s where PIPER comes in. PIPER’s two telescopes sit in a hot-tub-sized container of liquid helium, which runs about minus 452 degrees F. It looks at 85 percent of the sky and is extremely sensitive, so it helps us learn even more about the early days of the universe. By telling us more about polarization and those primordial gravitational waves, PIPER helps us understand how the early universe grew from that first baby picture.

This infographic shows many factoids about the PIPER (Primordial Inflation Polarization Explorer) balloon mission. At the top, there is part of an image of the cosmic microwave background with the text, “The cosmic microwave background (CMB) is heat left over from the big bang and is the oldest light we can see in the universe.” Just below that, near a circular, bright “explosion” is the text, “Scientists are studying the CMB for proof that the universe expanded rapidly immediately after the big bang.” Next is an image of two circles of yellow lines that look like 8-pointed pinwheels that would swirls in opposite directions with text, “This process, called inflation, should have created gravitational waves. If so, light from the CMB should contain a distinct twisting polarization pattern called B-mode.” There is a cut-out line drawing of the PIPER payload with the silhouette of a person standing next to it, showing that it is about two persons’ high. The text says, “PIPER is a microwave telescope flown on a high-altitude balloon. The instrument has twin telescopes in a hot-tub-sized container of liquid helium.” Next there is text with icicles below it that reads, “Liquid helium keeps the instrument at -452 degrees Fahrenheit (-269 Celsius).” Near a map of the United States with a telescope by Maryland and a lightbulb near California is the text, “The detectors on PIPER could spot a 60-watt incandescent light bulb in California from PIPER's base of operations at NASA's Goddard Space Flight Center in Maryland.” A silhouette of a hippopotamus accompanies the text, “PIPER's total weight, including instrument, balloon and ballast, is about 8,000 pounds (3,600 kilograms), as much as a full-grown male hippopotamus.” An illustration of the fully inflated balloon appears with the text, “Width of fully inflated balloon: 430 feet (130 meters).” Underneath the balloon are three houses. The text nearby explains, “The balloon expands to approximately 40 million cubic feet (1.1 million cubic meters) when it reaches maximum altitude. It's made from polyethylene film comparable in thickness to ordinary plastic sandwich wrap.” A drawing of Australia, Texas and New Mexico is accompanied by the text, “Flights are planned from Ft. Sumner, New Mexico, Palestine, Texas and Alice Springs, Australia. Overnight flights from these three locations will allow PIPER to cover 85 percent of the sky.” And finally, a commercial airplane near the bottom has text, “PIPER's maximum altitude is about 120,000 feet (36,000 meters). That's more than three times the cruising altitude of a commercial airplane.”
The Primordial Inflation Polarization Explorer (PIPER) is a NASA scientific balloon mission that flies to the edge of Earth’s atmosphere to study twisty patterns of light in the universe’s “baby picture.” This infographic highlights some facts about PIPER’s instruments, capabilities, and goals.
NASA’s Goddard Space Flight Center
Keep Exploring

Discover More Topics From NASA