


An extreme rainfall event in October 2015 inundated eastern U.S. states with a staggering amount of water. The Southeast was hit particularly hard. Some areas of South Carolina saw record-setting rainfall in just 48 hours, which overwhelmed streams and lakes, and saturated the soil.
Venkat Lakshmi, a remote sensing and soil moisture scientist at University of South Carolina, lives in the vicinity of flooding that affected the state’s capital of Columbia. His residence was spared, but he noted that in many areas the water rose above the maximum level that ground-based gauges could record. “Remote sensing may be our only way of trying to get good maps of this,” he said.
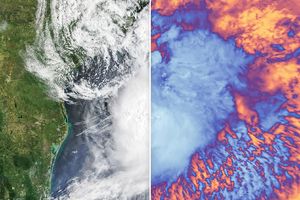
Already, maps have shown satellite-based estimates of rainfall in the northwestern Atlantic Ocean and eastern United States. The map above looks at the storm’s consequences from a different but complimentary perspective: the wetness of the soil.
The map is based on data acquired on October 5, 2015, by the Soil Moisture Active Passive (SMAP) satellite. The satellite’s radiometer measures soil moisture in the top 5 centimeters of the ground. Data were then mapped as the fraction of the volume of water contained in a volume of soil. Most of the dark blue areas, where soil is completely saturated, have a ratio of about 0.5.
There is good correspondence between areas where meteorologists observed the highest rainfall accumulation and areas of maximum soil moisture. But they are not identical. More rainfall generally means the soil will be wetter. But soil moisture also depends on the state of the soil preceding an event.
“Soil moisture controls the partition between how much precipitation infiltrates into the ground and how much turns into runoff,” said Rajat Bindlish, a remote sensing and soil moisture scientist working with USDA’s Agricultural Research Service. For example, rainfall over dry soil will first take time to infiltrate into the soil. Rainfall over soil that is already wet, however, can quickly result in runoff and flooding.
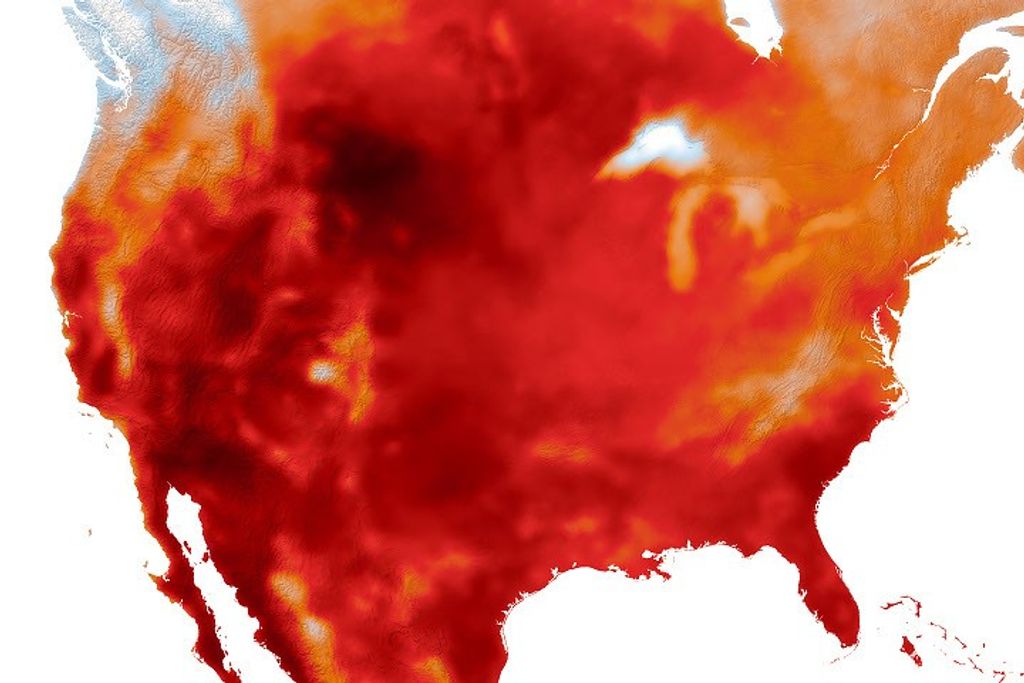
For nearly the entire first week of October, much of the eastern United States had been soaked with rainfall. South Carolina was hit particularly hard due to the relentless flow of tropical moisture from warm Atlantic waters and from the fringes of Hurricane Joaquin.
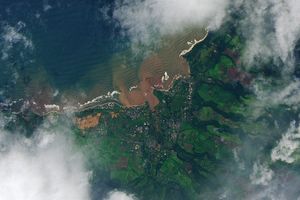
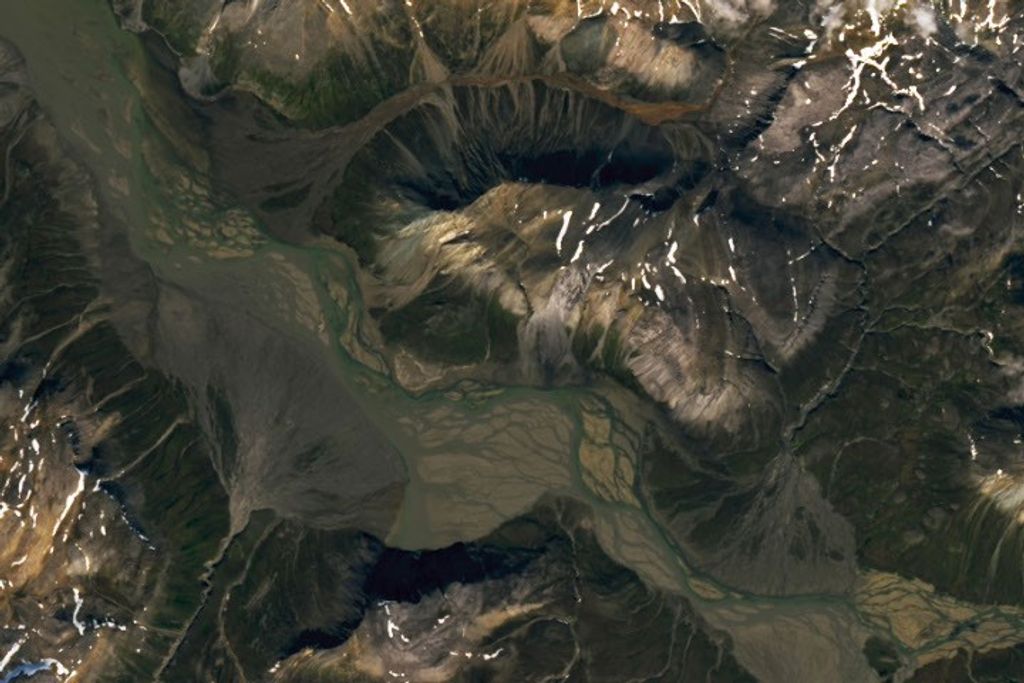
Lakshmi and colleagues at NASA also plan to look at other types of satellite data, including natural-color images, to get additional insight at the local level. After storm clouds clear, images from satellites such as Landsat, Terra, and Aqua can show landscape differences before and after a flood. In Columbia, Lakshmi said, there were pockets where everything was fine, and other areas where flooding was severe—an issue that was made worse by the failure of small dams peppered throughout the city.
"The water in Columbia is already receding," Lakshmi said. But the abundant data, maps, and images from the storm should help experts understand why certain areas were inundated, and to plan for the future.
References & Resources
- Bob Henson and Jeff Masters via Weather Underground (2015, October 5) More than Two Feet of Rain in South Carolina; Joaquin Heads to Sea. Accessed October 7, 2015.
- Jeff Masters via Weather Underground (2015, October 6) Carloina Floods Breach 18 Dams and Kill 16 People. Accessed October 7, 2015.
- NASA's Jet Propulsion Laboratory (2015) Soil Moisture Active Passive.
- WATCH Fox 57 (2015, October 7) Tracking SC Flooding From Space.
NASA Earth Observatory map by Joshua Stevens, using soil moisture data courtesy of JPL and the SMAP science team . Caption by Kathryn Hansen.