


![Request for Information – Potential [Placeholder for Prize]](https://assets.science.nasa.gov/dynamicimage/assets/science/psd/solar/2023/09/s/solarsystem_0.jpg?w=1024)


Space Weather History Presentation
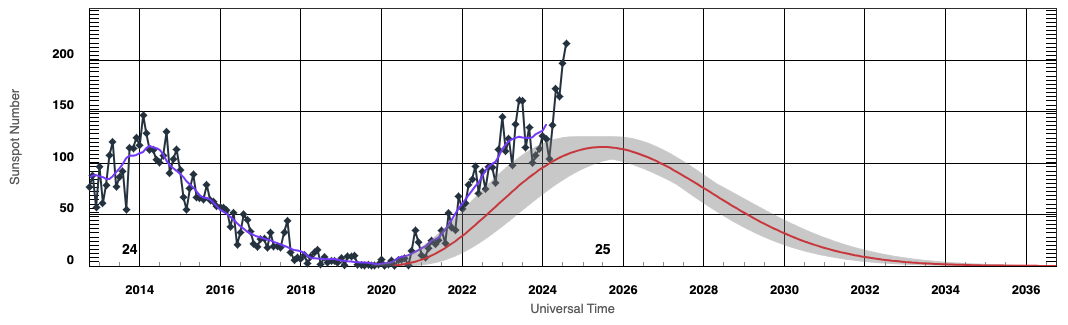
An interactive graph of sunspot numbers from the National Oceanic and Atmospheric Administration’s Space Weather Prediction Center reveals the up-and-down pattern of sunspot numbers all the way to the beginning of solar cycle 1 in the 1750s.
NOAA SWPC
| Levels |
|
|---|---|
| Material Type |
|
| Heliophysics Big Ideas |
|
| NGSS |
|
| Heliophysics Topics |
|
| Material Cost per Learner | Free |
| Language | English |
In this 41-slide presentation, you'll journey through the evolution of space weather research from ancient Egyptian observations to modern scientific understanding.
This slide deck traces the fascinating history of humanity's relationship with space weather phenomena across millennia. Beginning with early observations by ancient Egyptian astronomers and progressing through key historical discoveries, the presentation chronicles how our understanding of solar-terrestrial connections has developed over time. The 41 slides showcase important milestones, influential scientists, technological breakthroughs, and the gradual emergence of space weather as a formal scientific discipline in the modern era.
Download the presentation below.