


1 min read
Centaurus A in Different Wavelengths (Hubble, Spitzer, Chandra, VLA)
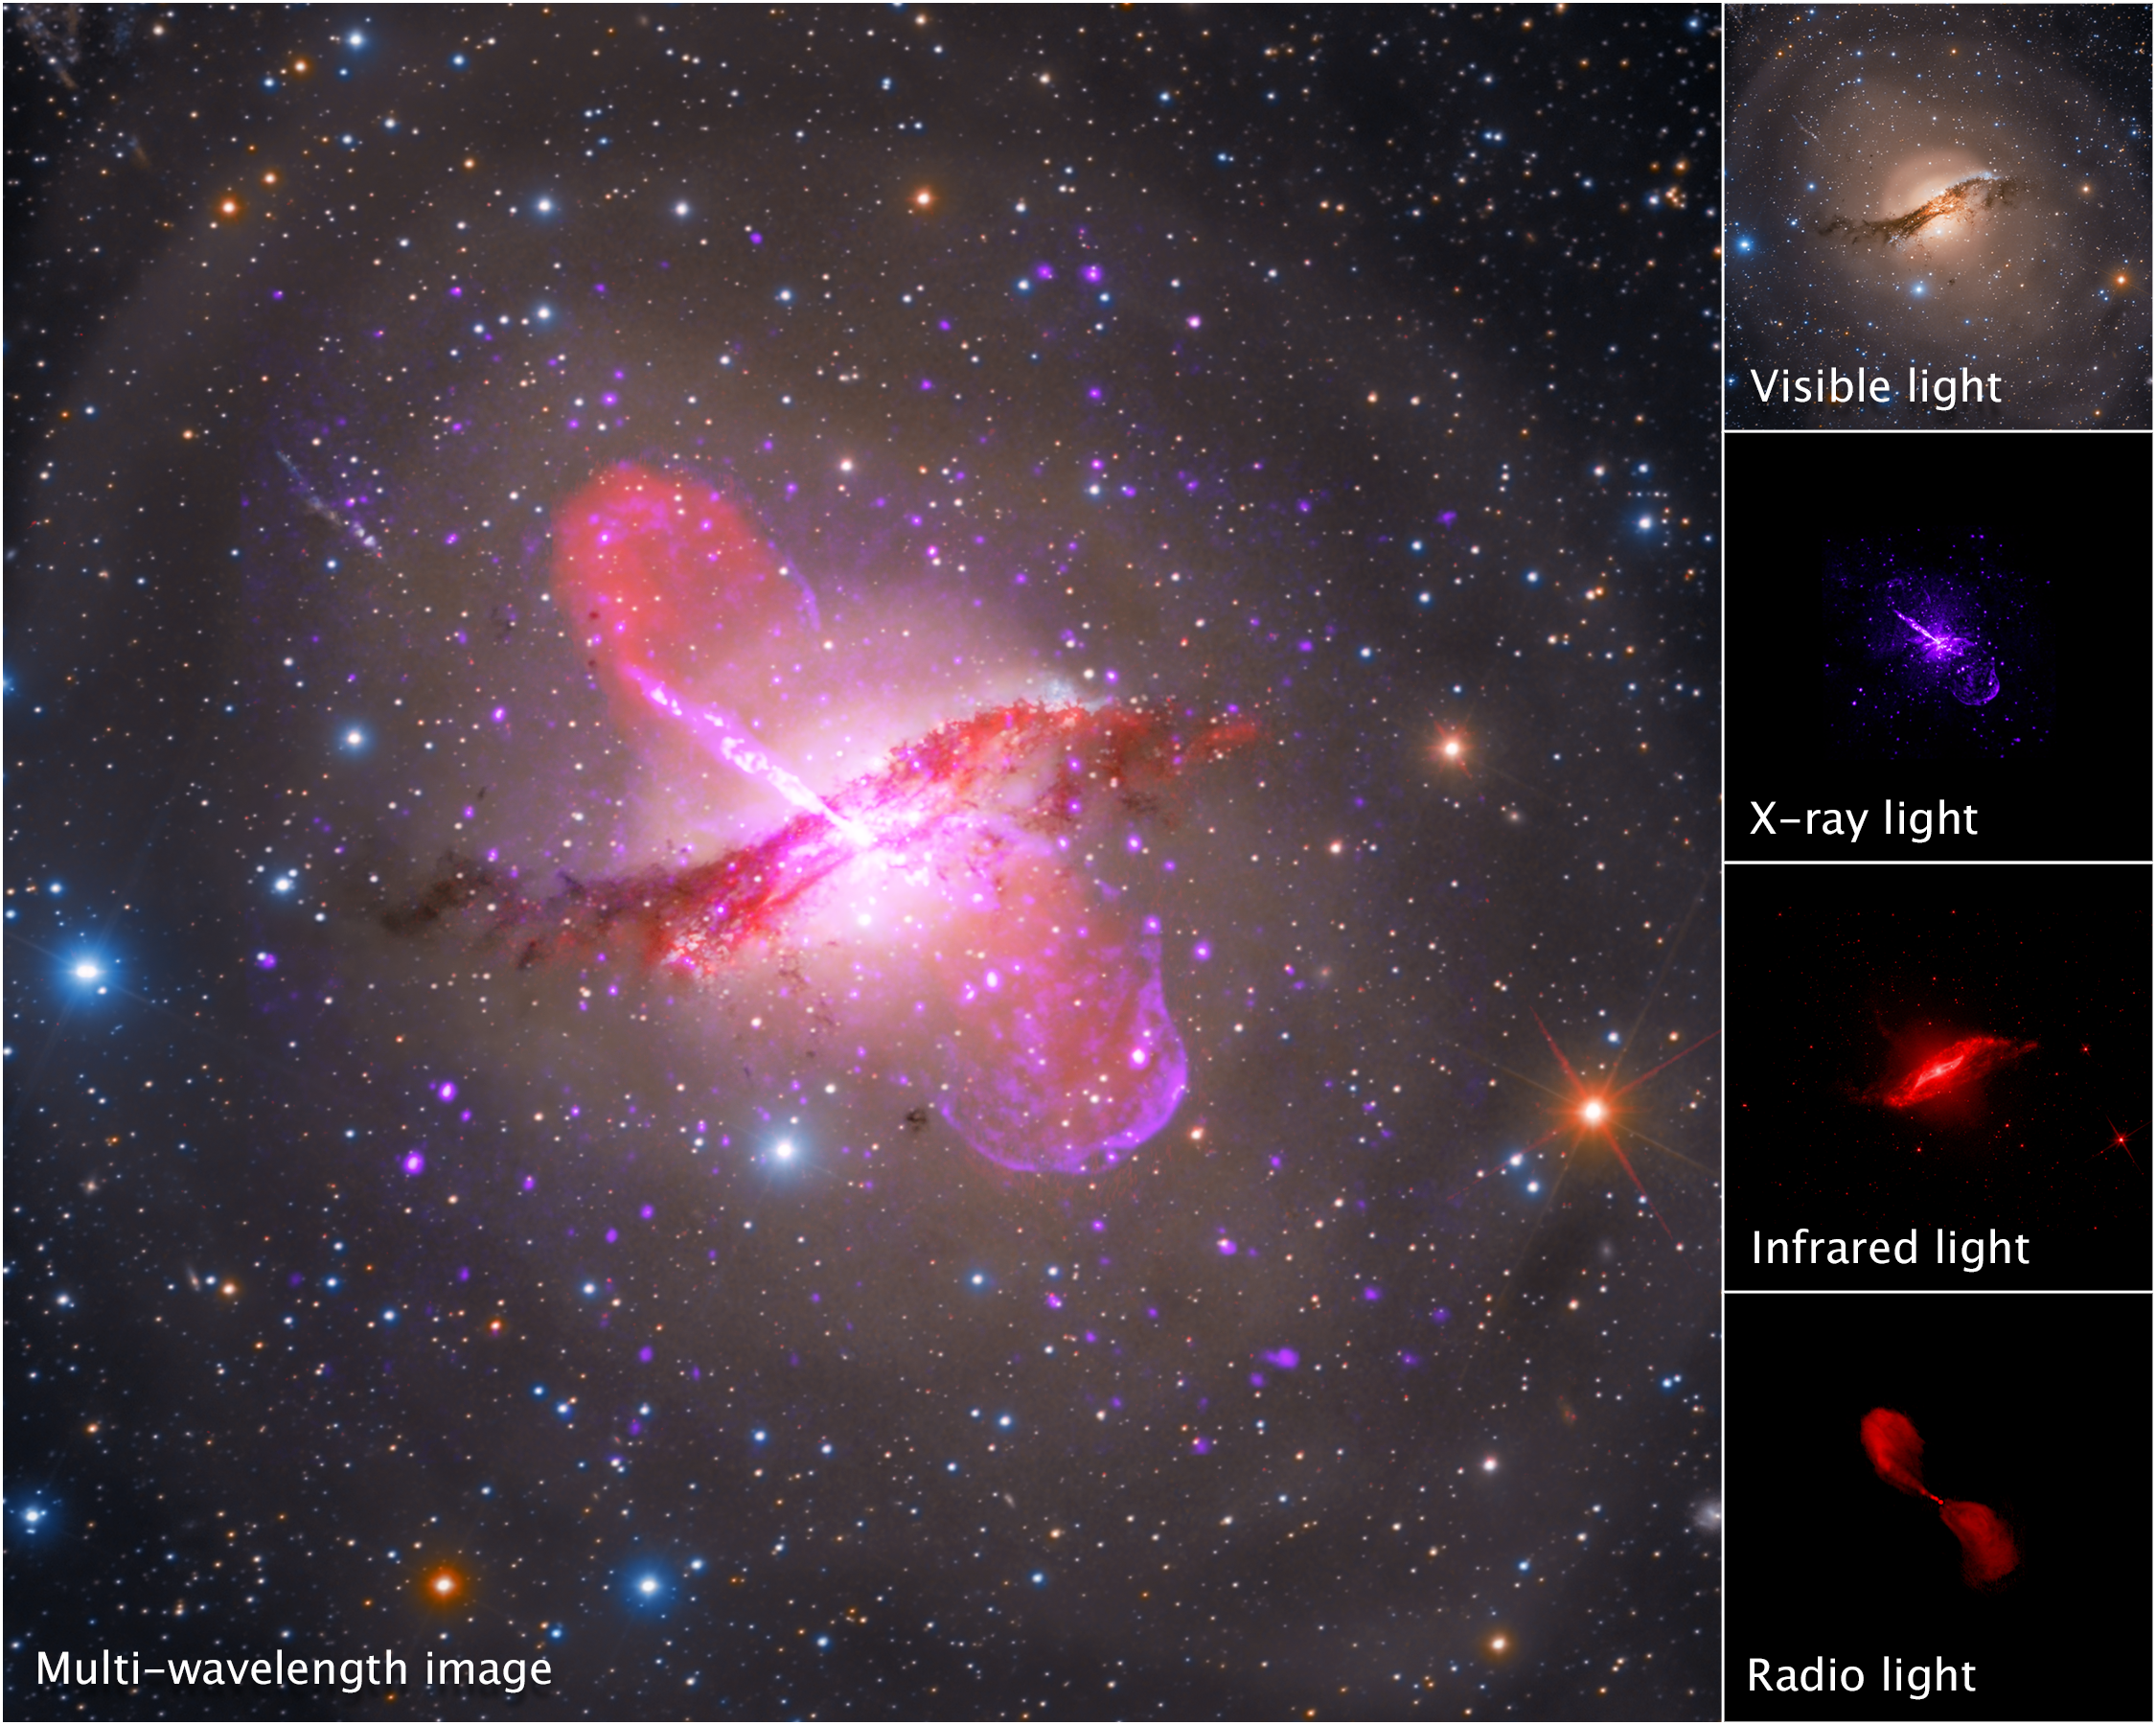
A breakdown of a multi-wavelength image of galaxy Centaurus A shows light collected by Hubble (visible), Chandra (X-ray), Spitzer (infrared), and the Very Large Array (radio). Centaurus A's dusty core is apparent in visible light, but its jets are best viewed in X-ray and radio light. With upcoming observations from NASA's James Webb Space Telescope in infrared light, researchers hope to better pinpoint the mass of the galaxy's central supermassive black hole as well as evidence that shows where the jets were ejected.
Extended Description and Image Alt Text
Extended Description
A large multi-wavelength image of galaxy Centaurus A appears at left, taking up the bulk of the image. At right is a slim column of four images showing the same object in individual wavelengths of light. From top to bottom: visible light, X-ray light, infrared light, and radio light.
The multi-wavelength image is marked by a prominent, fluffy X shape that takes up about a quarter of the field of view. A wavy, deep pink horizontal line that looks like a tilde forms part of the X and is a combination of visible and infrared light. From 11 o’clock to four o’clock, a lighter pink line that ends in bulbous plumes forms the other side of the X shape, this is a combination of X-ray and radio light. Hazy light brown concentric rings of light extend from the center, each ring becoming more transparent toward the image’s edges.
The background is dotted with stars in a variety of sizes and colors. Large blue stars appear toward the edges of the frame, and many smaller purple stars appear throughout the center. Orange and white stars appear throughout.
In the right-hand column, from top to bottom: The visible light image shows the same horizontal tilde, but its dust lanes are dark brown. The central region is bright, extending like a halo about halfway across the dust lane. A series of dimmer, but still bright circles extend almost to the edges of the frame. The background is dotted with blue and orange stars.
The X-ray light image shows a purple line angled from top left to bottom right, but it is significantly smaller than the line in the multi-wavelength image. There is a slight purple haze that ends in a rounded edge toward the right end. The background is black.
The infrared light image shows a portion of the horizonal tilde in red. It is not quite as long as the multi-wavelength image and takes up more of the central portion. In the red material is a diamond-shaped structure. There is a bright white dot at the center. A few red dots appear toward the bottom right area over the black background.
The radio light image shows the line in the multi-wavelength image that is tilted 11 o’clock to four o’clock. A thin, bright red line and dot in the center connects to fluffy regions at top left and bottom right. The background is black.
Image Alt Text
A large multi-wavelength image of galaxy Centaurus A appears at left, taking up the bulk of the image. At right is a slim column showing the same target in visible light, X-ray light, infrared light, and radio light.
About the Object
- R.A. PositionR.A. PositionRight ascension – analogous to longitude – is one component of an object's position.13h 25m 28s
- Dec. PositionDec. PositionDeclination – analogous to latitude – is one component of an object's position.-43° 1′ 9″
- ConstellationConstellationOne of 88 recognized regions of the celestial sphere in which the object appears.Centaurus
- DistanceDistanceThe physical distance from Earth to the astronomical object. Distances within our solar system are usually measured in Astronomical Units (AU). Distances between stars are usually measured in light-years. Interstellar distances can also be measured in parsecs.13 million light-years
- DimensionsDimensionsThe physical size of the object or the apparent angle it subtends on the sky.Image is 24 arcmin across. (about 147,000 light years)
About the Data
- Data DescriptionData DescriptionProposal: A description of the observations, their scientific justification, and the links to the data available in the science archive.
Science Team: The astronomers who planned the observations and analyzed the data. "PI" refers to the Principal Investigator. - InstrumentInstrumentThe science instrument used to produce the data.CXC>ACIS, HST, SPITZER>IRAC, VLA
- Object NameObject NameA name or catalog number that astronomers use to identify an astronomical object.Centaurus A
- Object DescriptionObject DescriptionThe type of astronomical object.Elliptical/Active Galaxy
- Release DateMarch 17, 2021
- Science ReleasePeering into a Galaxy’s Dusty Core to Study an Active Supermassive Black Hole
- CreditImage: NASA, CXC, SAO, Astrophotography by Rolf Olsen, NASA-JPL, Caltech, NRAO, AUI, NSF, UOH, M. Hardcastle
X-ray (Purple); Optical (Blue, Red); Infrared (Red), Radio (Red)
Related Images & Videos
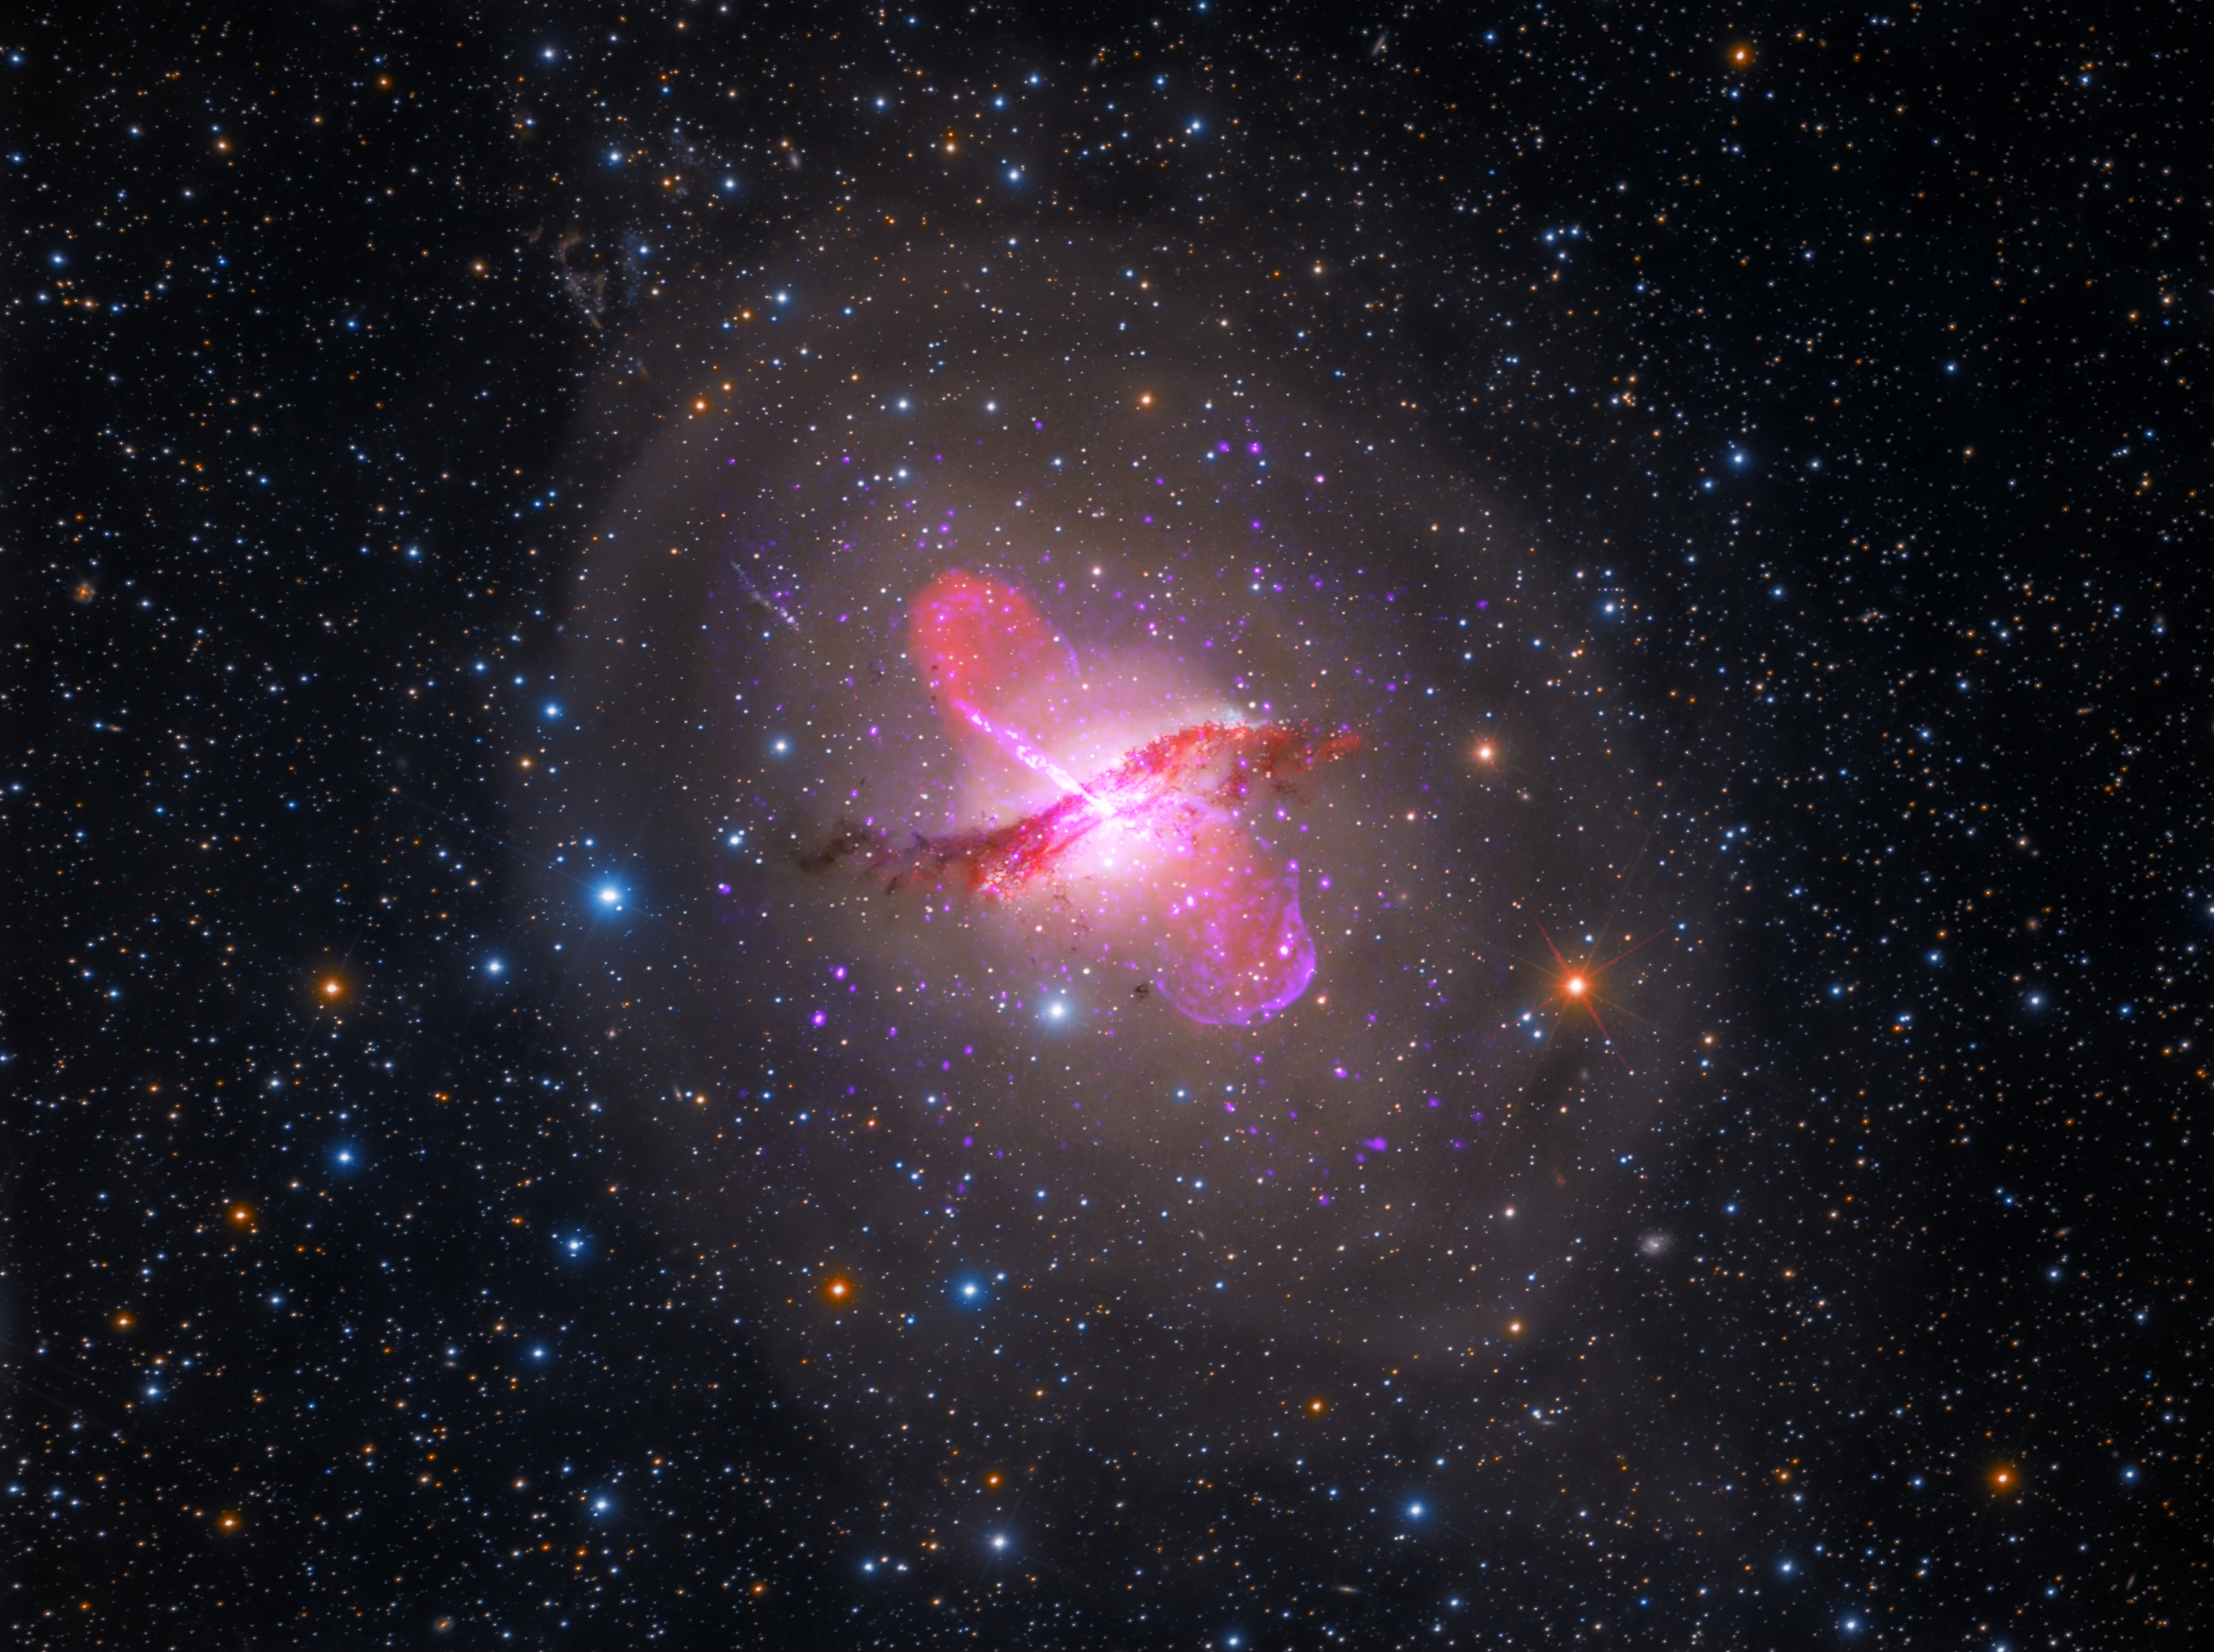
Multiwavelength View of Centaurus A (Hubble, Spitzer, Chandra, VLA)
Centaurus A sports a warped central disk of gas and dust, which is evidence of a past collision and merger with another galaxy. It also has an active galactic nucleus that periodically emits jets. It is the fifth brightest galaxy in the sky and only about 13 million light-years...
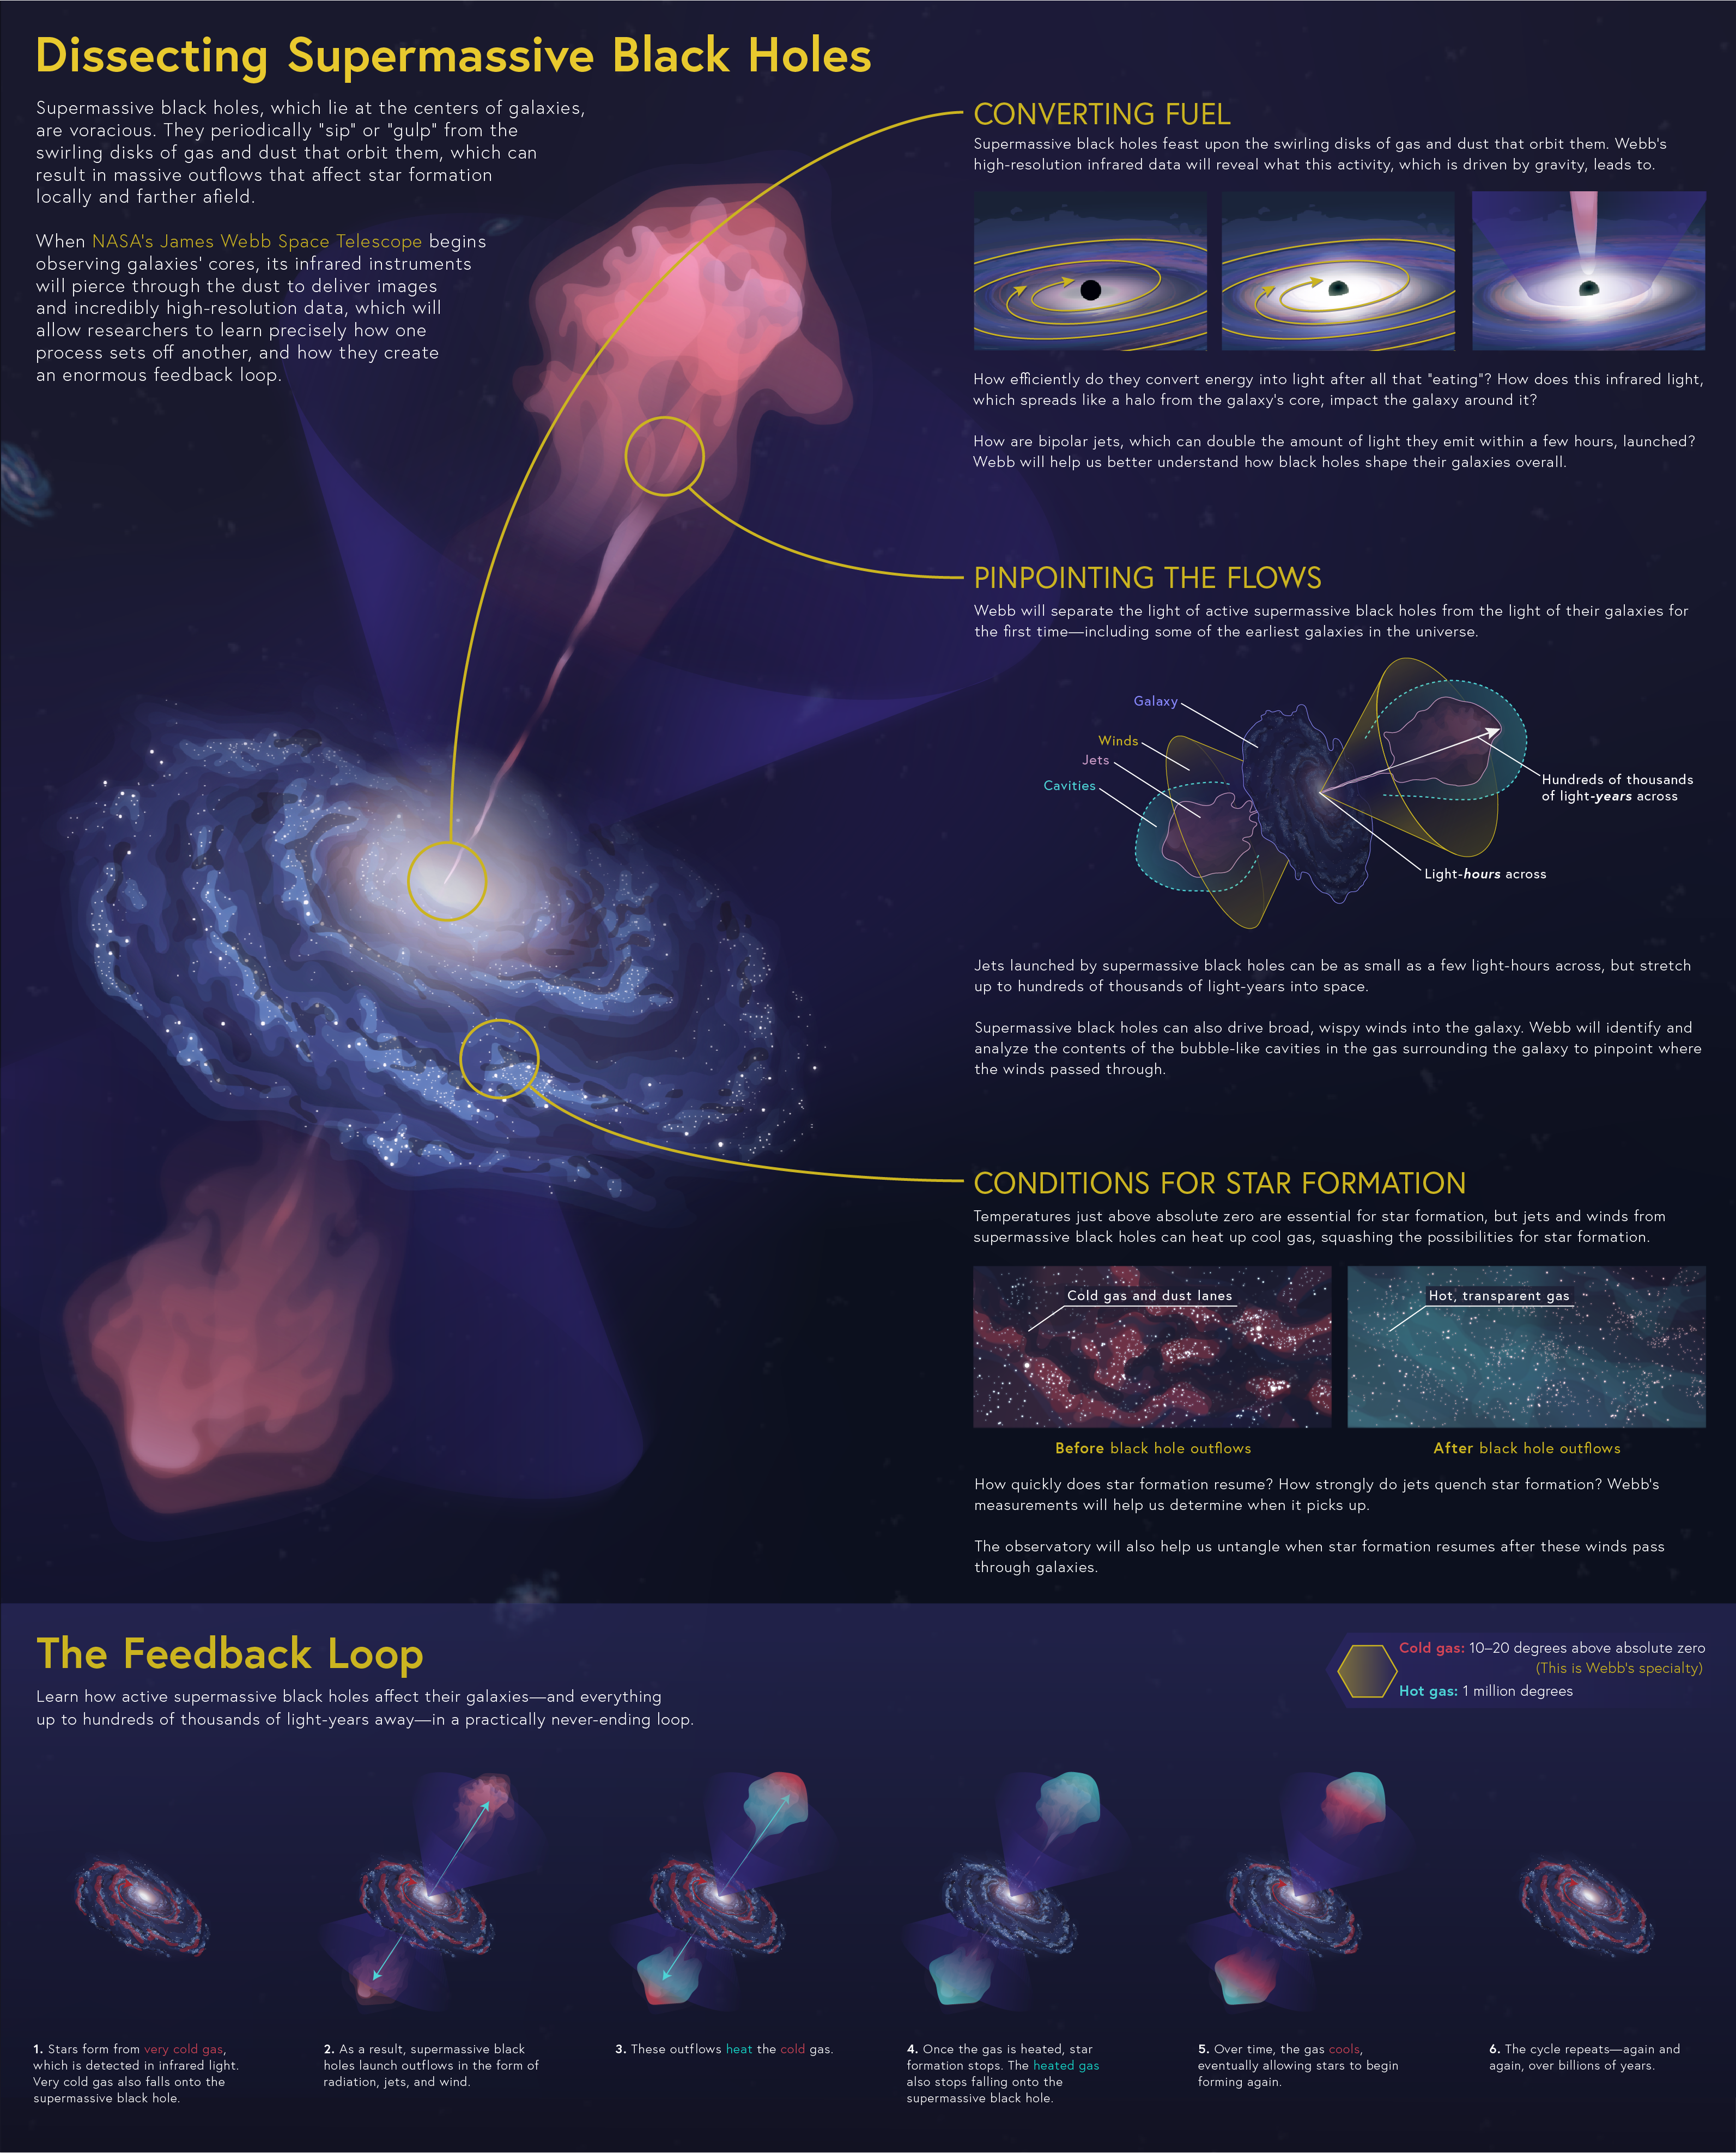
Dissecting Supermassive Black Holes
Supermassive black holes, which lie at the centers of galaxies, are voracious. They periodically “sip” or “gulp” from the swirling disks of gas and dust that orbit them, which can result in massive outflows that affect star formation locally and farther afield. When NASA’s James...
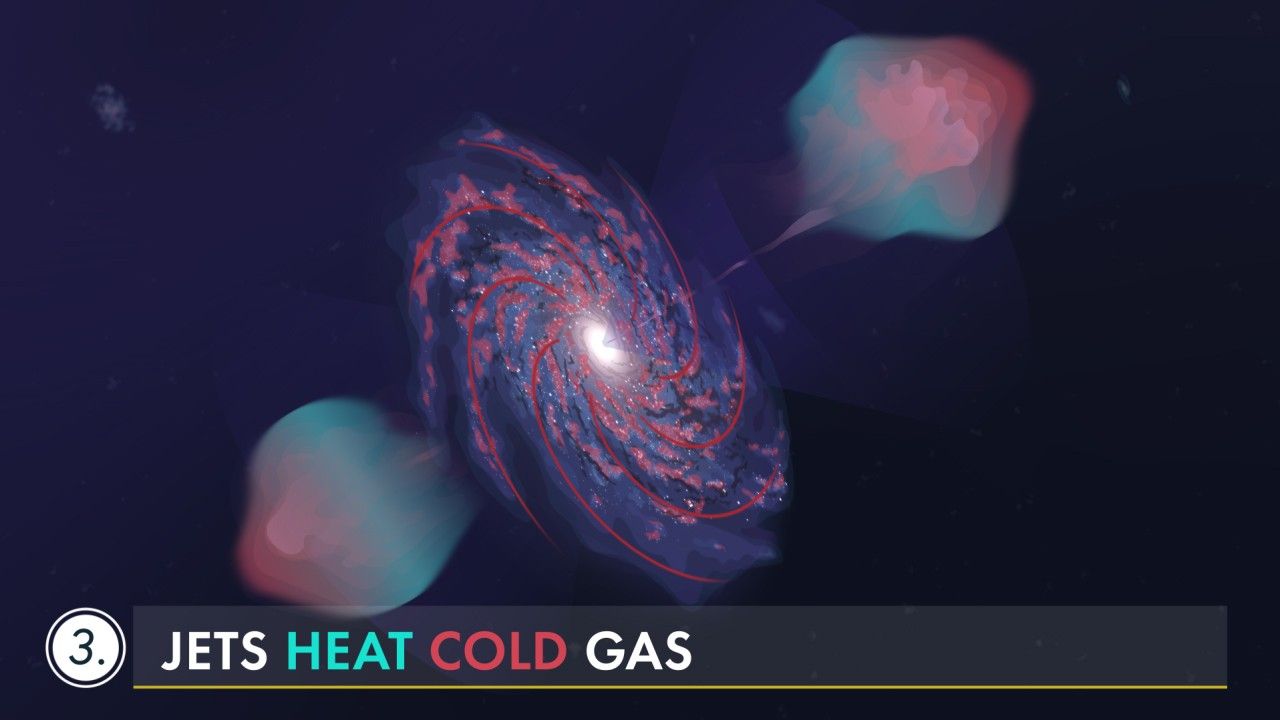
Dissecting Supermassive Black Holes: The Feedback Loop
Watch as the jets and winds from a supermassive black hole affect its host galaxy—and the space hundreds of thousands of light-years away over millions of years. Explore our image and video collections to find more videos in this series, including " Pinpointing the Flows ,” and...
Share
Details
Laura Betz
NASA’s Goddard Space Flight Center
Greenbelt, Maryland
laura.e.betz@nasa.gov
NASA, CXC, SAO, Astrophotography by Rolf Olsen, NASA-JPL, Caltech, NRAO, AUI, NSF, UOH, M. Hardcastle


