


1 min read
Galaxy Cluster PLCK G165.7 (NIRCam Image)
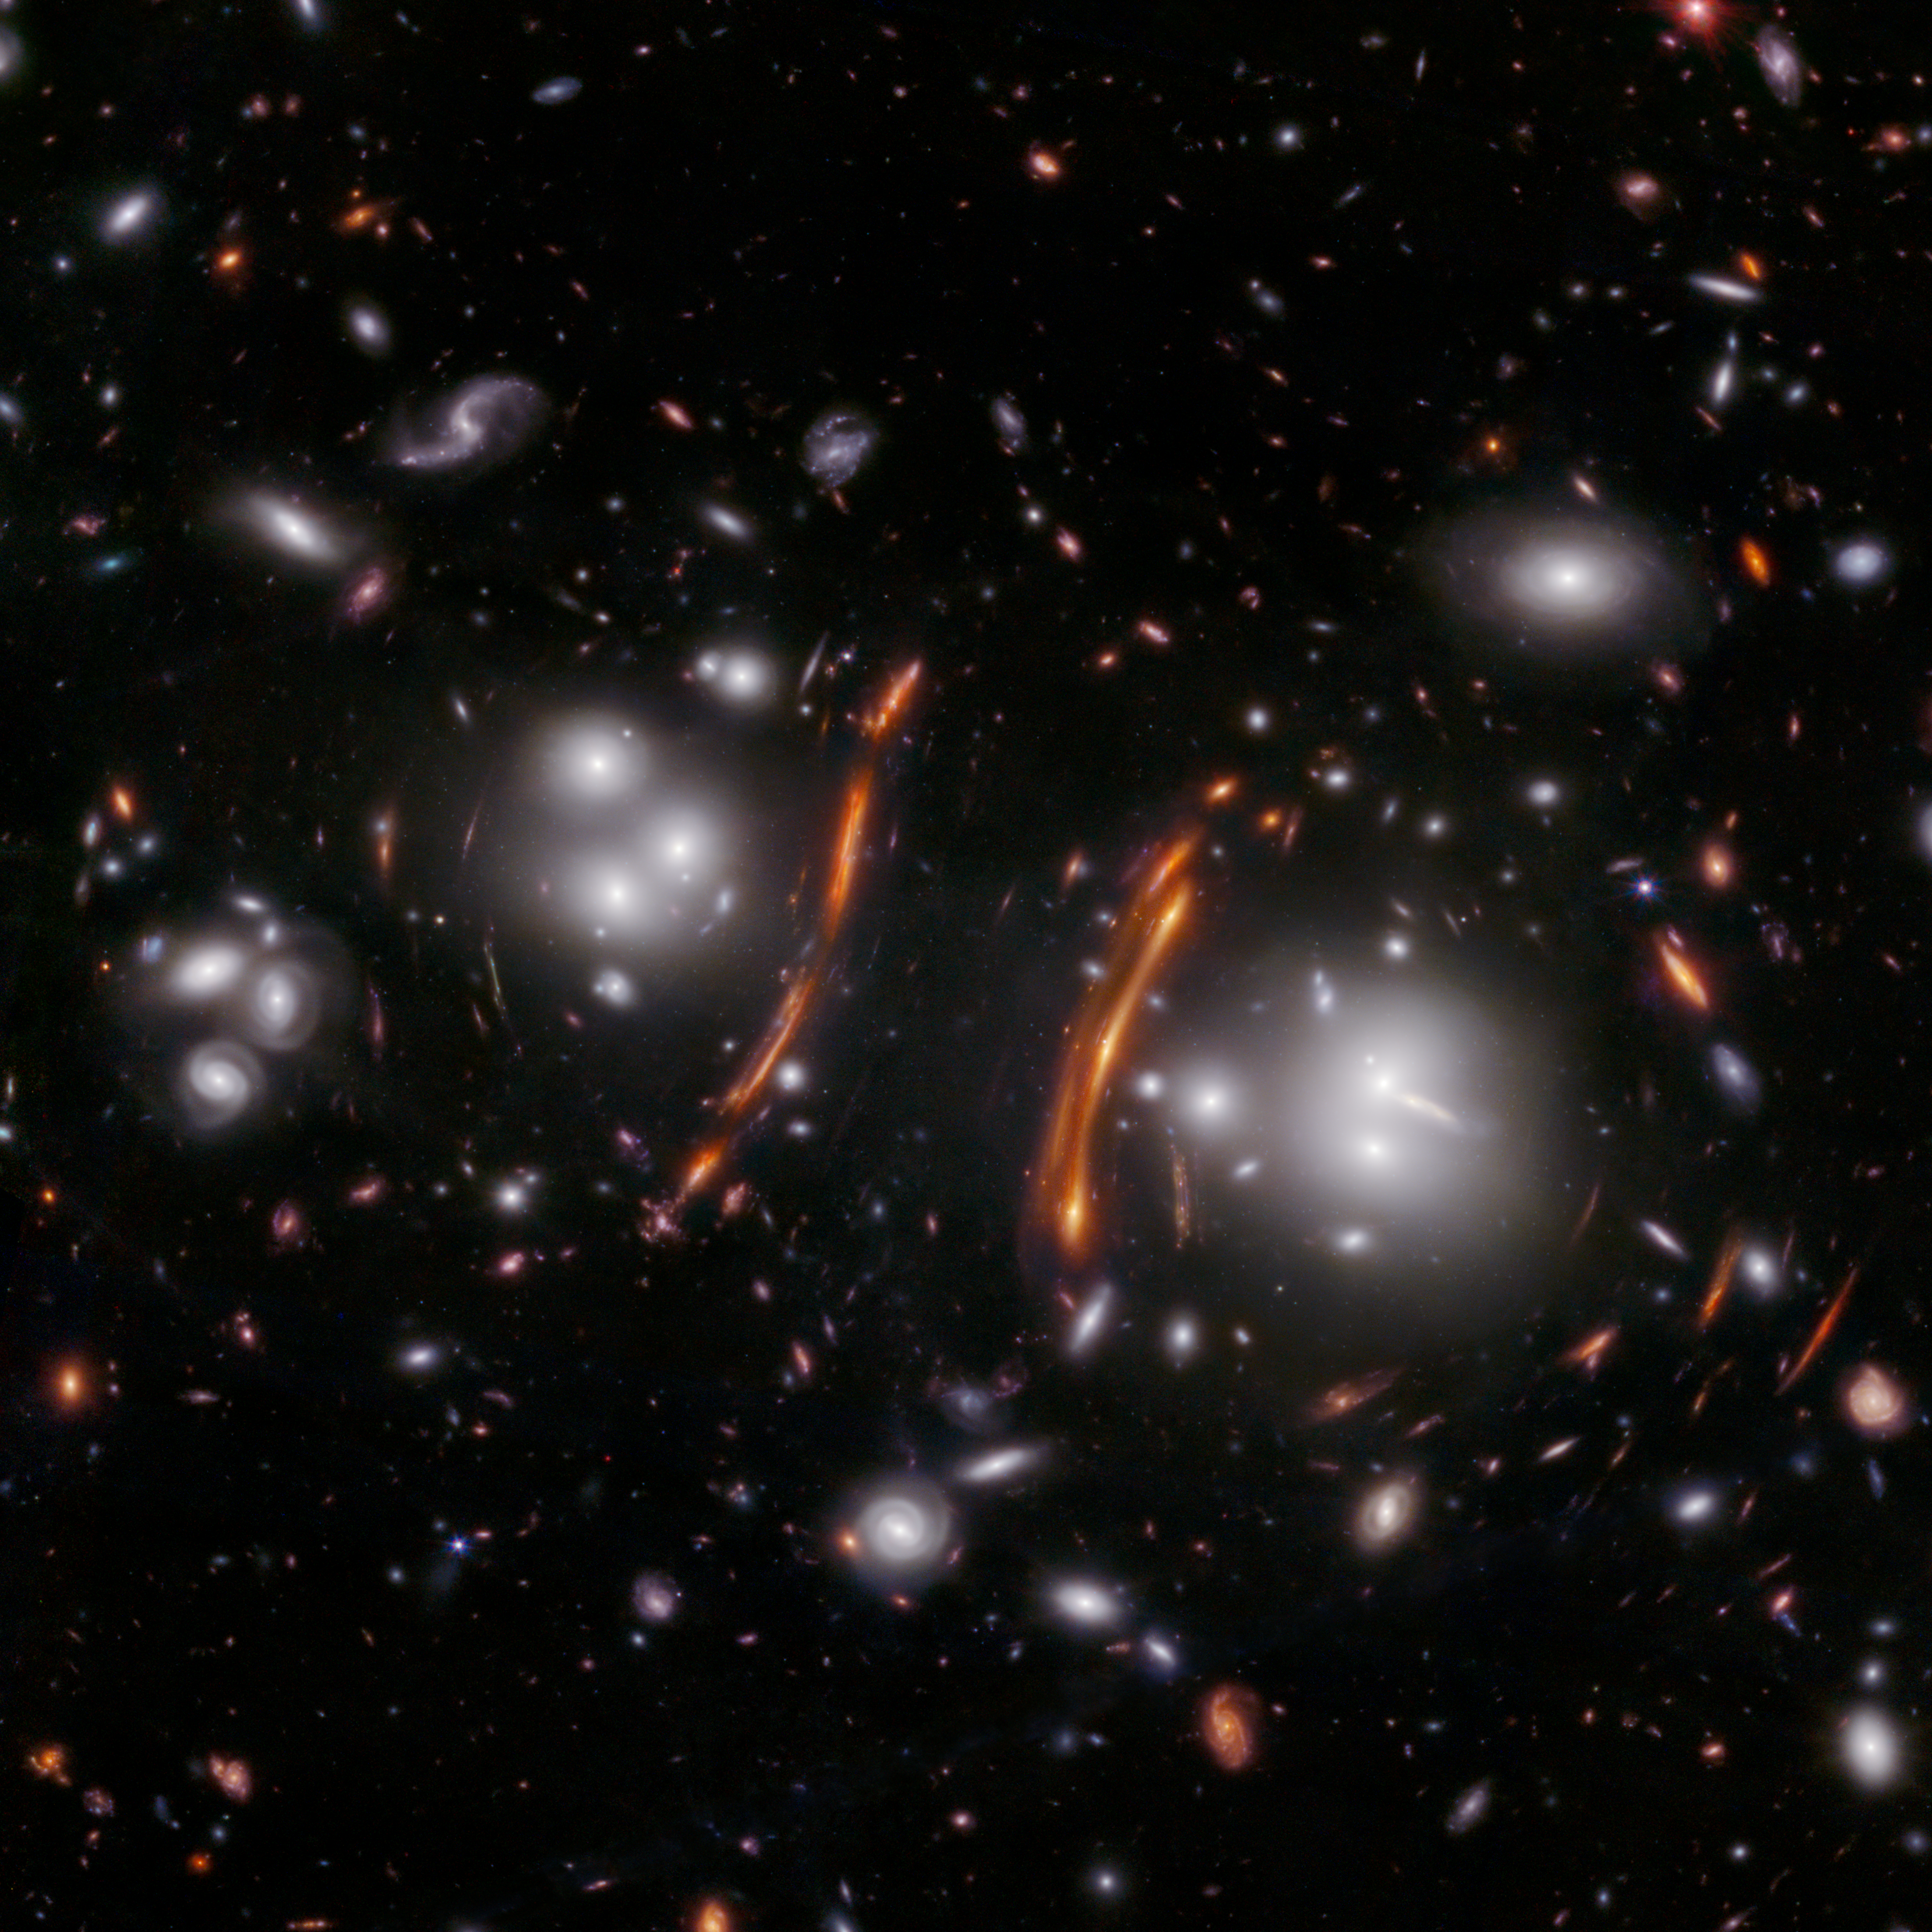
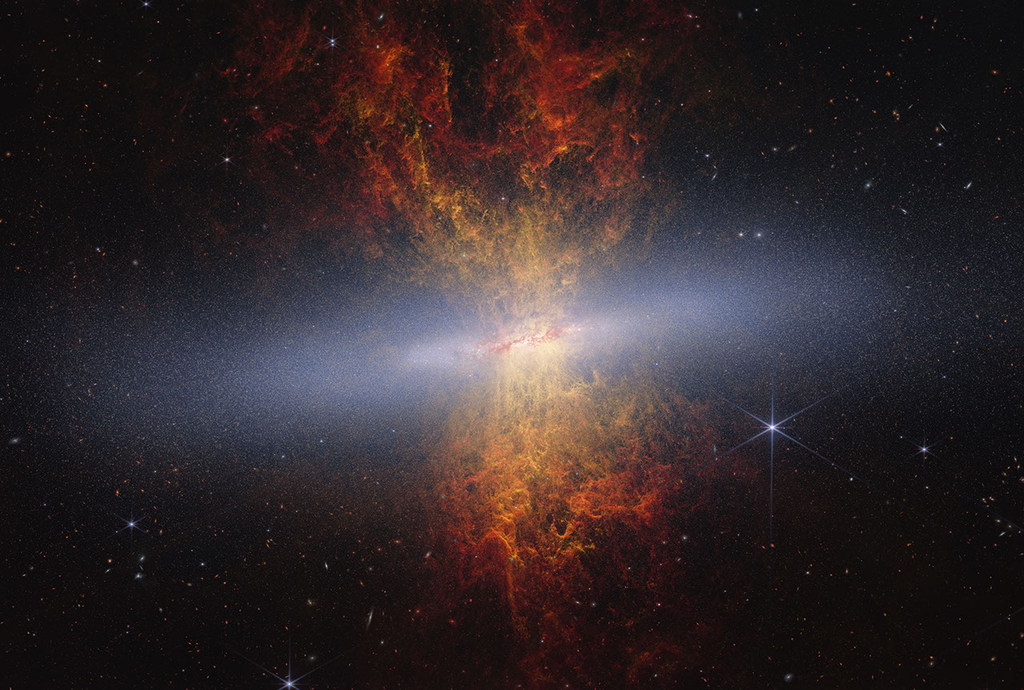
NASA’s James Webb Space Telescope’s NIRCam (Near-Infrared Camera) image of the galaxy cluster PLCK G165.7+67.0, also known as G165. A foreground cluster, located 3.6 billion light-years away from Earth, is magnifying and bending the light of the distant universe beyond. In this image, astronomers discovered the light of an exploding star — more specifically, a Type Ia supernova — imaged three times, seen as points of light within the prominent red arc at the right-center of the image.
To achieve three images, the light traveled along three different paths. Since each path had a different length, and light traveled at the same speed, the supernova was imaged in this Webb observation at three different times during its explosion. The multiply-imaged supernova offers astronomers a unique way to calculate a new value for the Hubble constant — the rate at which the universe is accelerating.
The field of G165 is known for a high rate of star formation of more than 300 solar masses per year, an attribute that correlates with higher supernova rates.
In this image, blue represents light at 0.9, 1.15, and 1.5 microns (F090W + F115W + F150W), green is 2.0 and 2.77 microns (F200W + F277W), and red is 3.56, 4.1, and 4.44 microns (F356W + F410M + F444W).
About the Object
- R.A. PositionR.A. PositionRight ascension – analogous to longitude – is one component of an object's position.11:27:15.59
- Dec. PositionDec. PositionDeclination – analogous to latitude – is one component of an object's position.+42:28:33.46
- ConstellationConstellationOne of 88 recognized regions of the celestial sphere in which the object appears.Ursa Major
- DimensionsDimensionsThe physical size of the object or the apparent angle it subtends on the sky.Image is about 1.5 arcminutes across
About the Data
- Data DescriptionData DescriptionProposal: A description of the observations, their scientific justification, and the links to the data available in the science archive.
Science Team: The astronomers who planned the observations and analyzed the data. "PI" refers to the Principal Investigator. - InstrumentInstrumentThe science instrument used to produce the data.NIRCam
- Exposure DatesExposure DatesThe date(s) that the telescope made its observations and the total exposure time.30 March 2023, 22 April 2023, 09 May 2023
- FiltersFiltersThe camera filters that were used in the science observations.F090W, F115W, F150W, F200W, F277W, F356W, F410M, F444W
- Object NameObject NameA name or catalog number that astronomers use to identify an astronomical object.PLCK G165.7+67.0, G165, SN H0pe
- Object DescriptionObject DescriptionThe type of astronomical object.Galaxy cluster and supernova
- Release DateOctober 1, 2024
- CreditImage: NASA, ESA, CSA, STScI, Brenda Frye (University of Arizona), Rogier Windhorst (ASU), S. Cohen (ASU), Jordan D'Silva (UWA), Anton Koekemoer (STScI), Jake Summers (ASU)
These images are a composite of separate exposures acquired by the James Webb Space Telescope using the NIRCam instrument. Several filters were used to sample wide infrared wavelength ranges. The color results from assigning different hues (colors) to each monochromatic (grayscale) image associated with an individual filter. In this case, the assigned colors are: Blue: F090W + F115W + F150W, Green: F200W + F277W, Red: F356W + F410M + F444W
Share
Details
Laura Betz
NASA’s Goddard Space Flight Center
Greenbelt, Maryland
laura.e.betz@nasa.gov
NASA, ESA, CSA, STScI, Brenda Frye (University of Arizona), Rogier Windhorst (ASU), S. Cohen (ASU), Jordan D’Silva (UWA), Anton Koekemoer (STScI), Jake Summers (ASU)


