


1 min read
La Flaca and El Anzuelo (NIRCam Image)
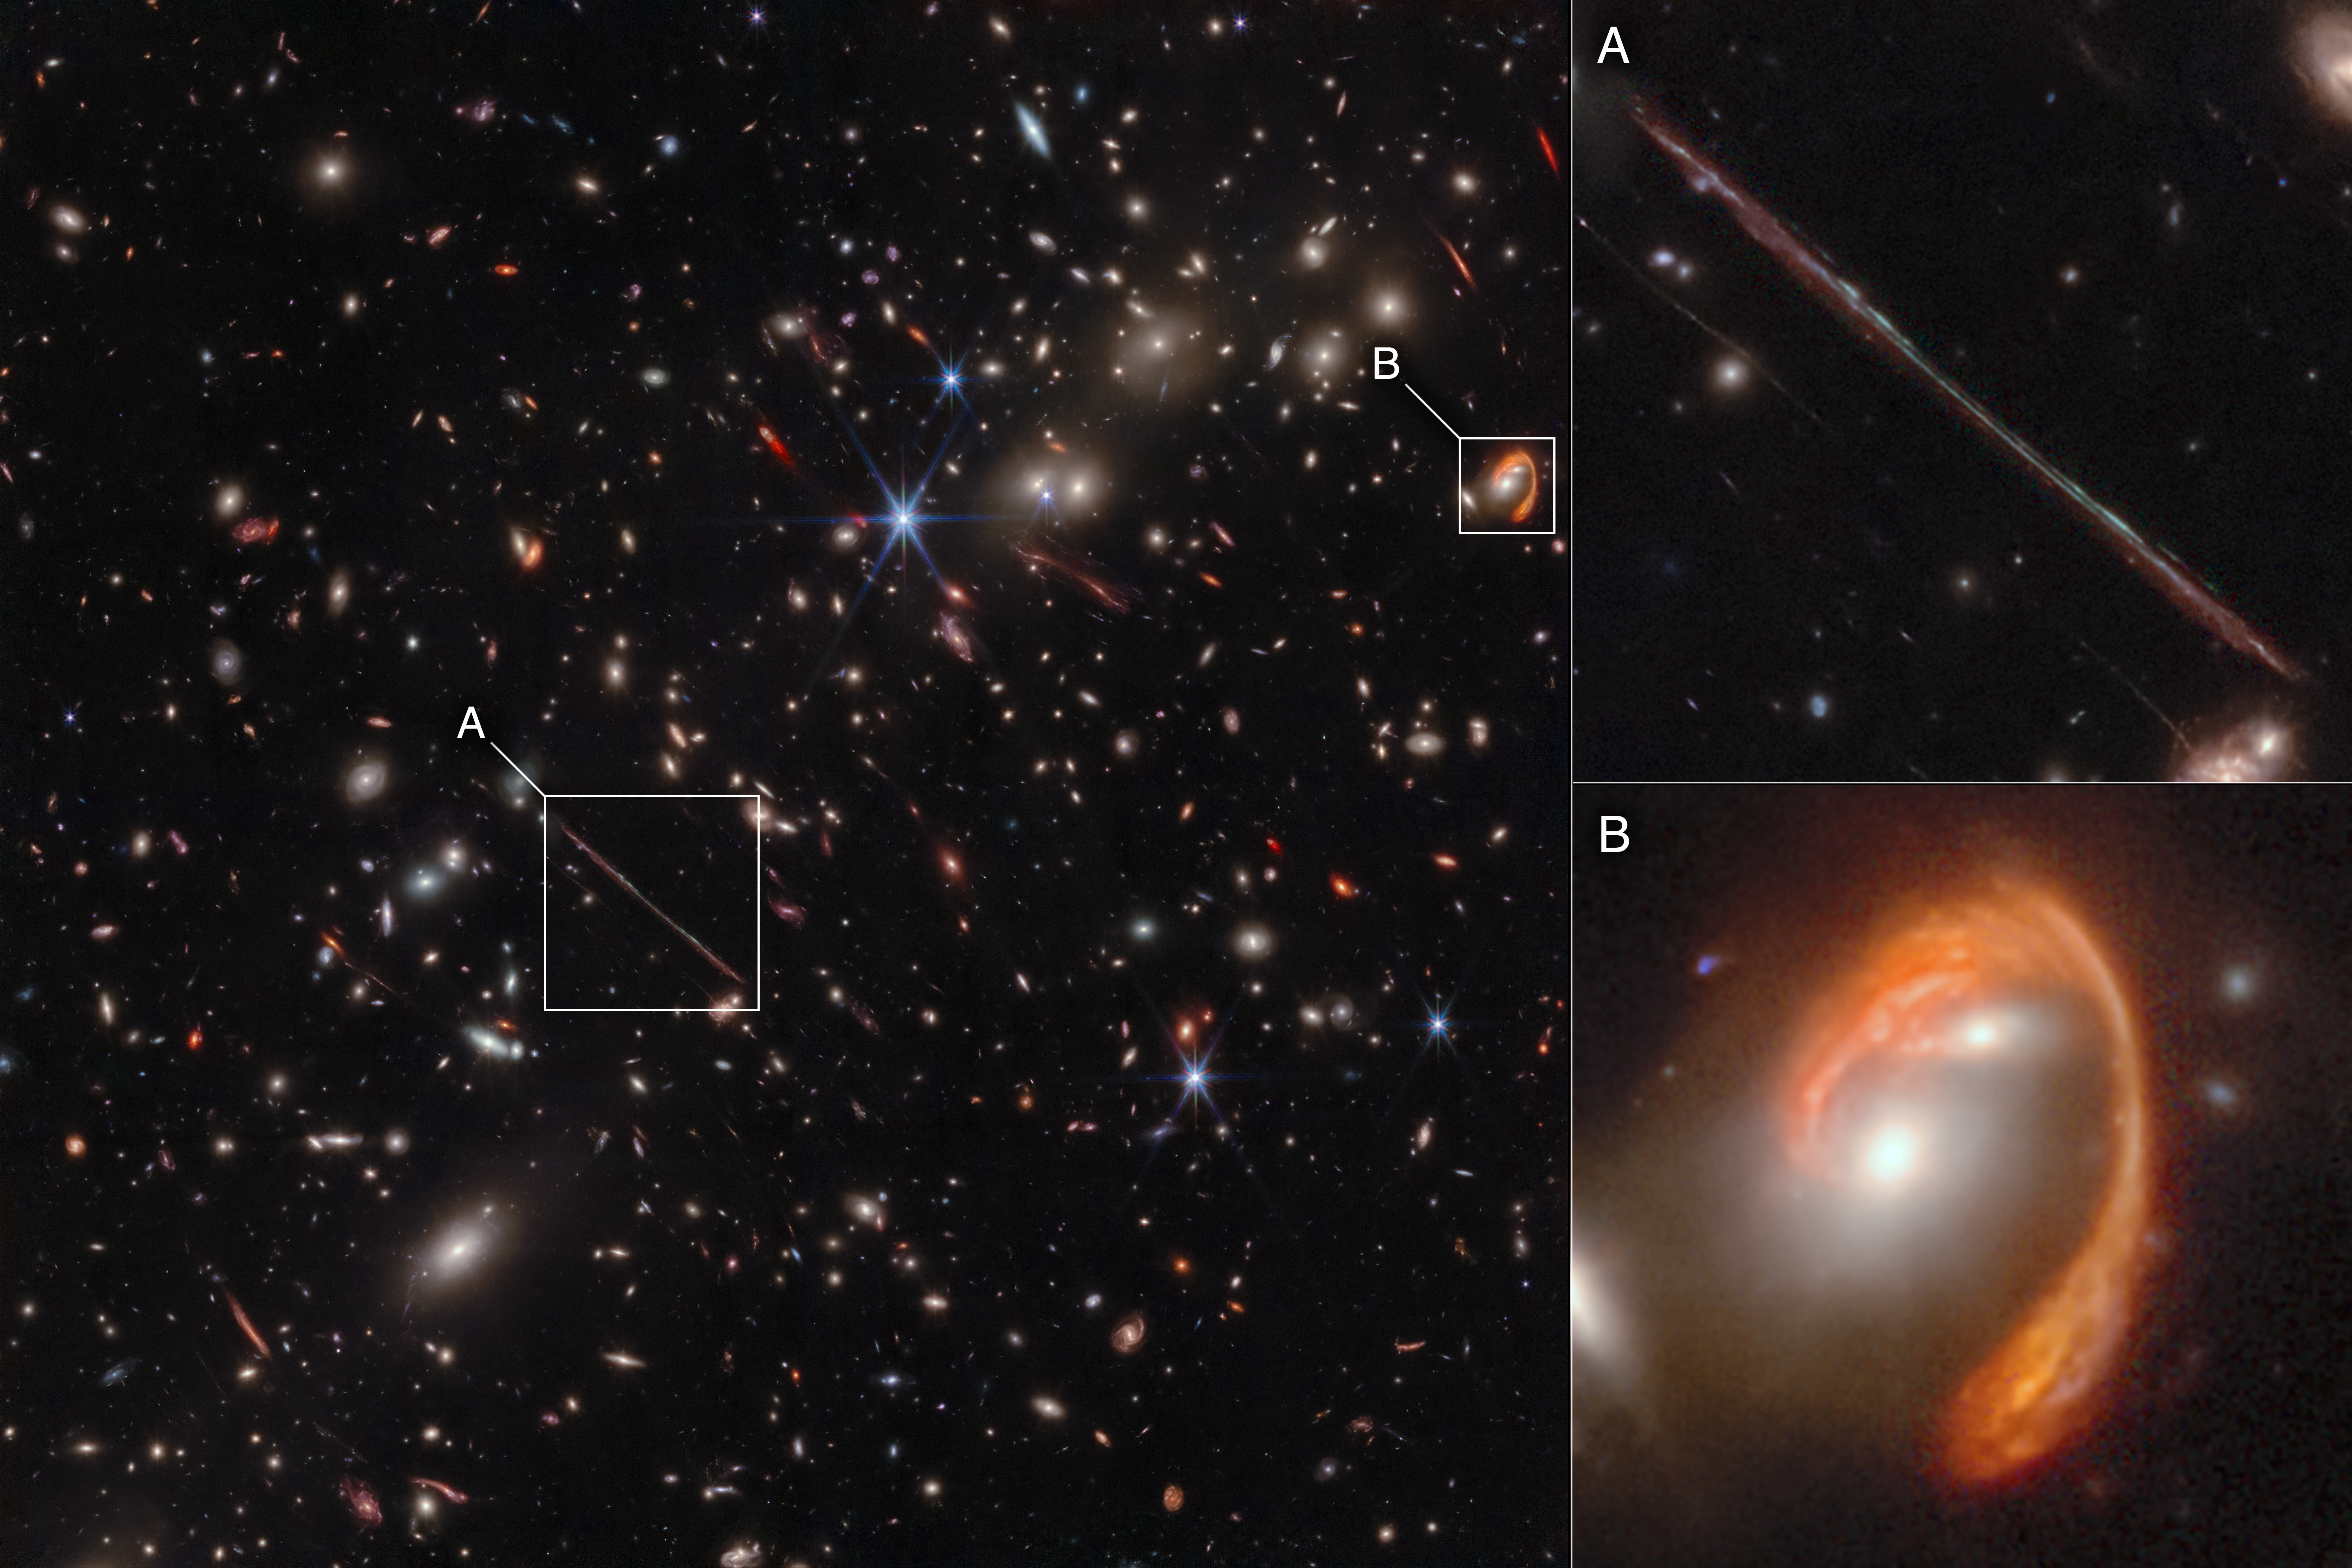
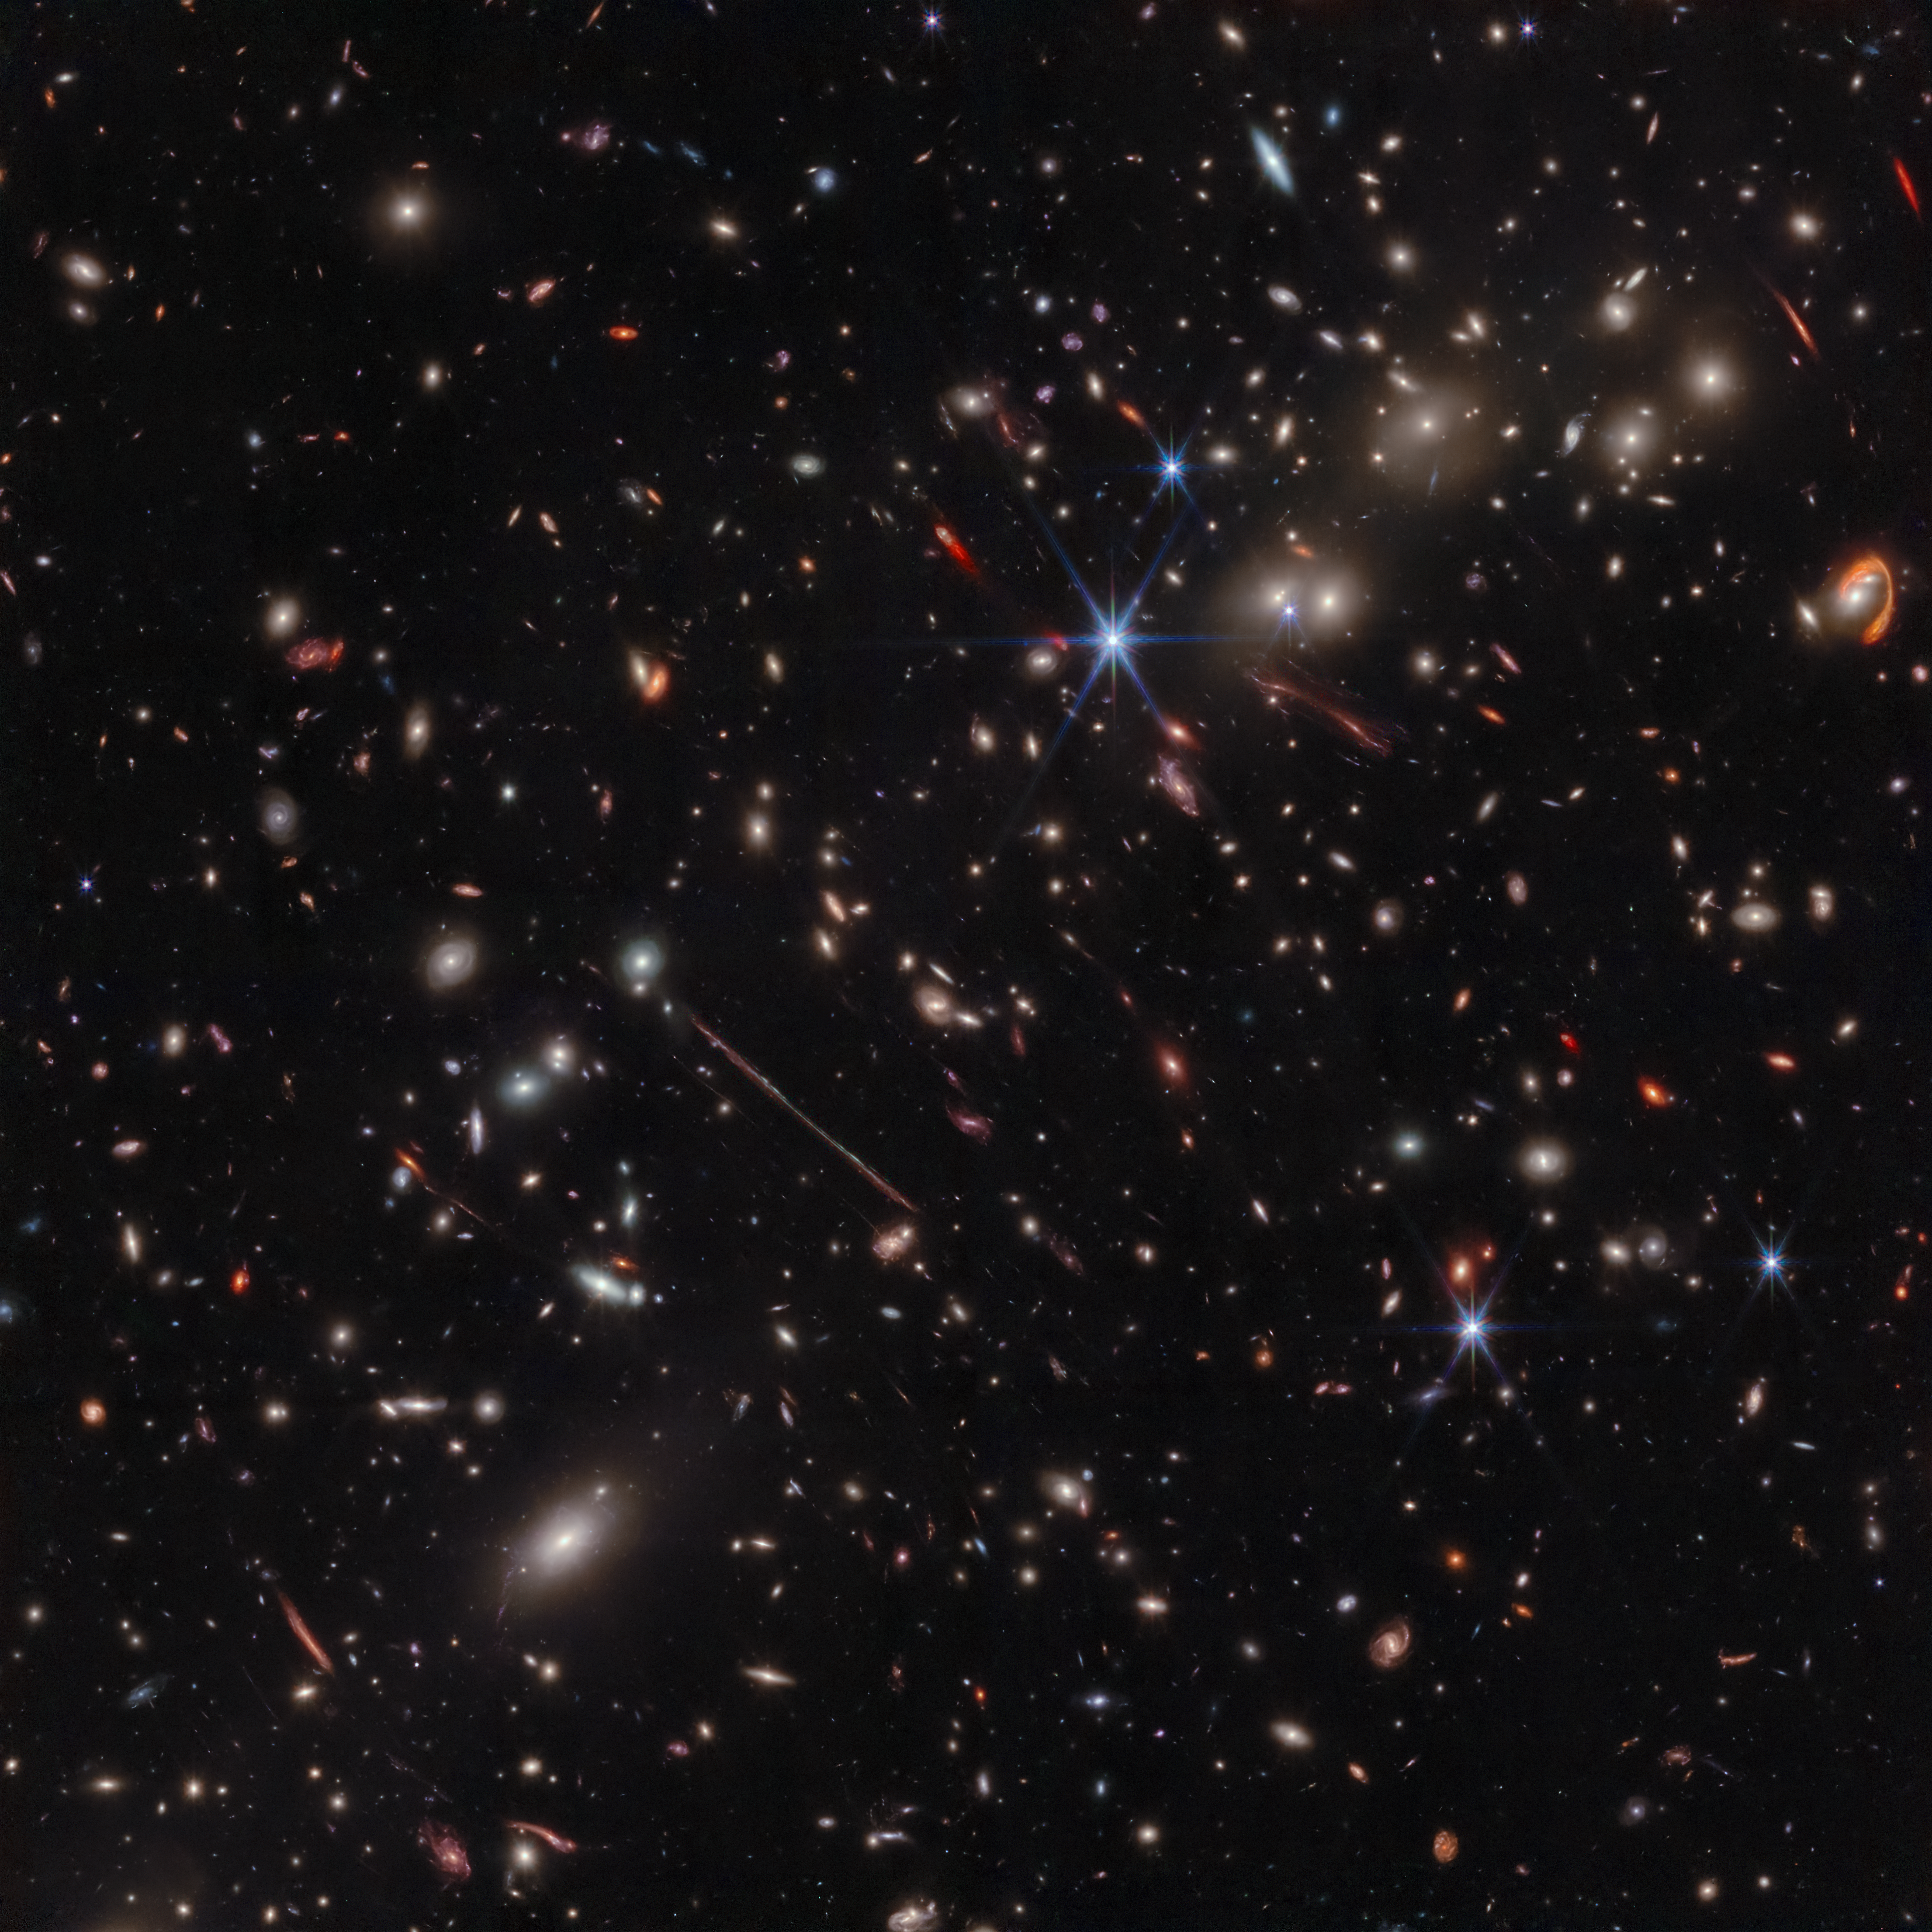
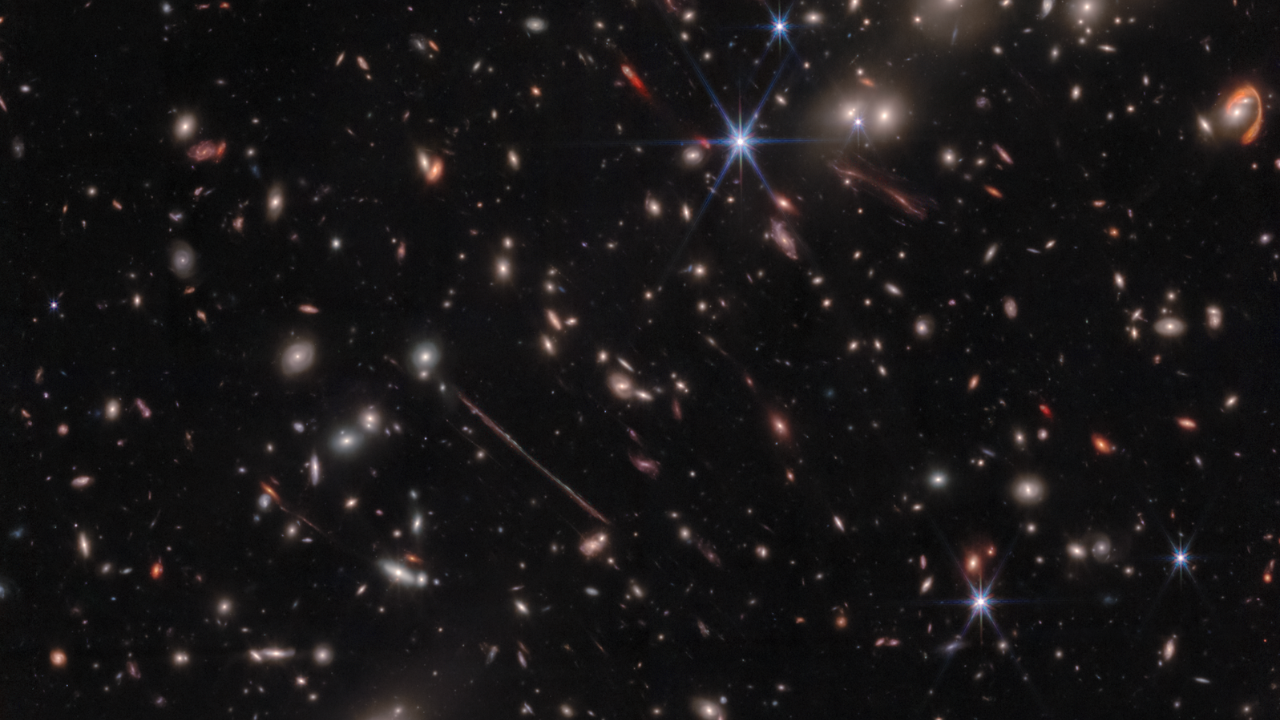
Webb’s infrared image of the galaxy cluster El Gordo (“the Fat One”) reveals hundreds of galaxies, some never before seen at this level of detail. El Gordo acts as a gravitational lens, distorting and magnifying the light from distant background galaxies. Two of the most prominent features in the image include the Thin One, highlighted in box A, and the Fishhook, a red swoosh highlighted in box B. Both are lensed background galaxies. The insets at right show zoomed-in views of both objects.
About the Object
- R.A. PositionR.A. PositionRight ascension – analogous to longitude – is one component of an object's position.01:02:55
- Dec. PositionDec. PositionDeclination – analogous to latitude – is one component of an object's position.-49:15:38
- ConstellationConstellationOne of 88 recognized regions of the celestial sphere in which the object appears.Phoenix
- DistanceDistanceThe physical distance from Earth to the astronomical object. Distances within our solar system are usually measured in Astronomical Units (AU). Distances between stars are usually measured in light-years. Interstellar distances can also be measured in parsecs.Cluster is 7.6 billion light-years (2.3 billion parsecs)
About the Data
- Data DescriptionData DescriptionProposal: A description of the observations, their scientific justification, and the links to the data available in the science archive.
Science Team: The astronomers who planned the observations and analyzed the data. "PI" refers to the Principal Investigator.This image was created with Webb data from proposal: 1176 (R. A. Windhorst).
- InstrumentInstrumentThe science instrument used to produce the data.NIRCam
- Exposure DatesExposure DatesThe date(s) that the telescope made its observations and the total exposure time.29 July 2022
- FiltersFiltersThe camera filters that were used in the science observations.F115W, F150W, F200W, F277W, F356W, F444W
- Object NameObject NameA name or catalog number that astronomers use to identify an astronomical object.El Gordo, ACT-CL J0102-4915, SPT-CL J0102-4915, La Flaca, El Anzeulo
- Object DescriptionObject DescriptionThe type of astronomical object.Galaxy Cluster
- Release DateAugust 2, 2023
- Science ReleaseWebb Spotlights Gravitational Arcs in ‘El Gordo’ Galaxy Cluster
- CreditImage: NASA, ESA, CSA; Science: Jose Diego (IFCA), Brenda Frye (University of Arizona), Patrick Kamieneski (ASU), Timothy Carleton (ASU), Rogier Windhorst (ASU); Image Processing: Alyssa Pagan (STScI), Jake Summers (ASU), Jordan D'Silva (UWA), Anton Koekemoer (STScI), Aaron Robotham (UWA), Rogier Windhorst (ASU)
This image is a composite of separate exposures acquired by the James Webb Space Telescope using the NIRCam instrument. Several filters were used to sample wide wavelength ranges. The color results from assigning different hues (colors) to each monochromatic (grayscale) image associated with an individual filter. In this case, the assigned colors are: Blue: F115W+F150W Green: F200W + F277W Red: F356W + F444W
Related Images & Videos
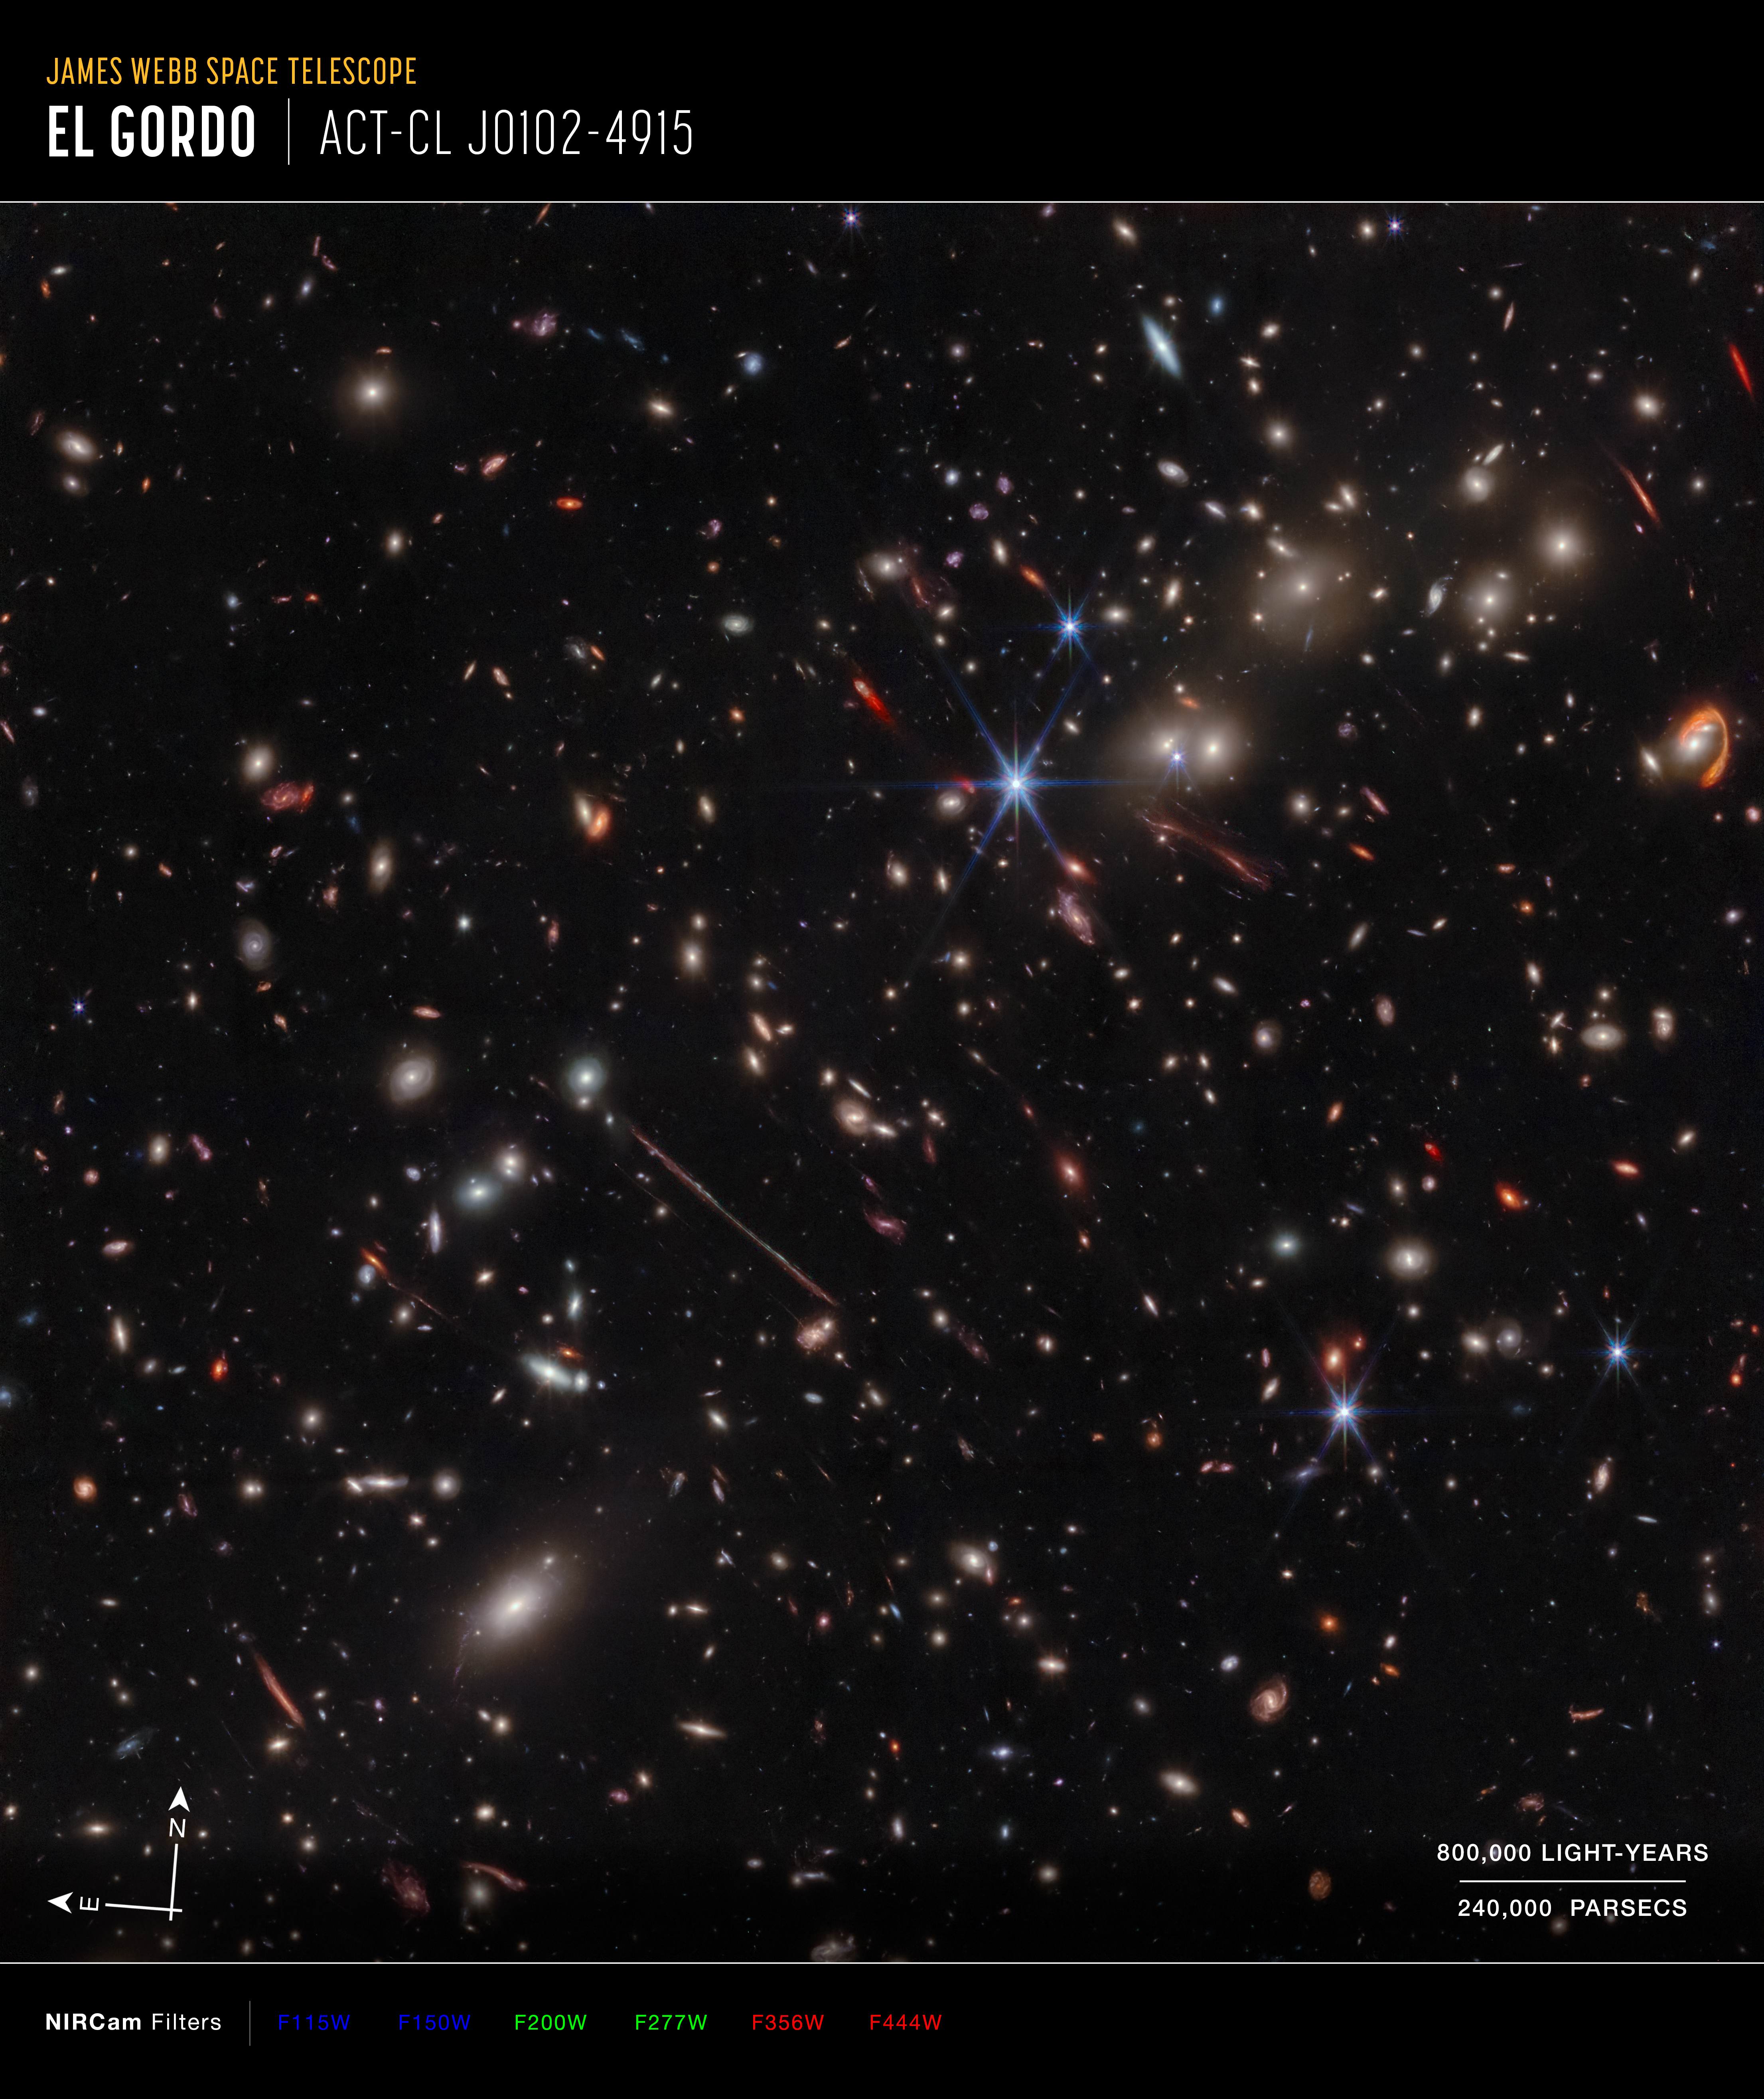
El Gordo (NIRCam Compass Image)
This is an image of the El Gordo galaxy cluster with compass arrows, scale bar and color key. The north and east compass arrows show the orientation of the image on the sky. Note that the relationship between north and east on the sky (as seen from below) is flipped relative to...
Share
Details
Laura Betz
NASA’s Goddard Space Flight Center
Greenbelt, Maryland
laura.e.betz@nasa.gov
NASA, ESA, CSA
Jose Diego (IFCA), Brenda Frye (University of Arizona), Patrick Kamieneski (ASU), Timothy Carleton (ASU), Rogier Windhorst (ASU)
Alyssa Pagan (STScI), Jake Summers (ASU), Jordan D’Silva (UWA), Anton Koekemoer (STScI), Aaron Robotham (UWA), Rogier Windhorst (ASU)


