




![Request for Information – Potential [Placeholder for Prize]](https://assets.science.nasa.gov/dynamicimage/assets/science/psd/solar/2023/09/s/solarsystem_0.jpg?w=1024)




1 min read
Little Red Dot Abell2744-QSO1a (NIRCam Image with NIRSpec IFU Velocity Map)
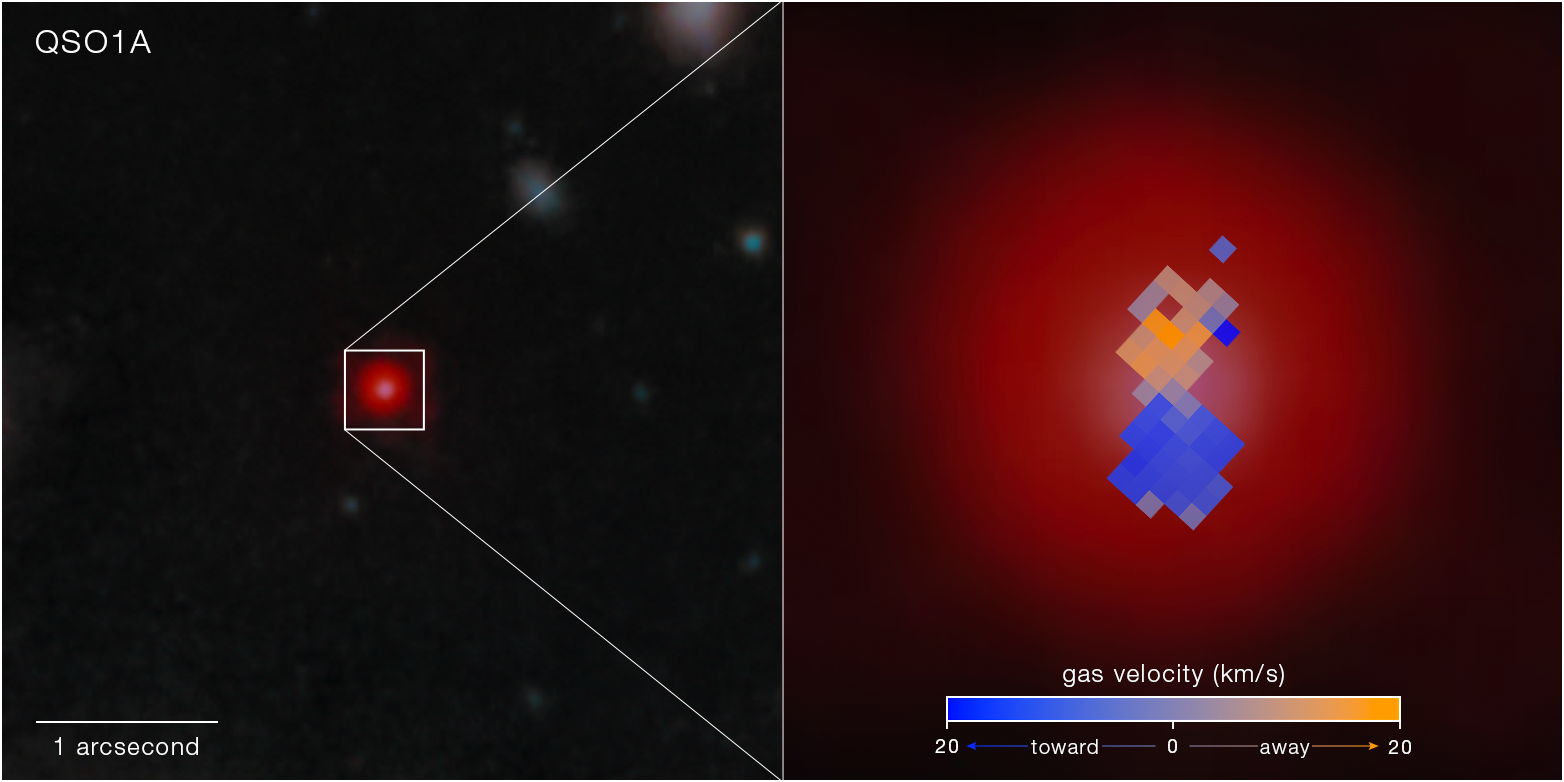
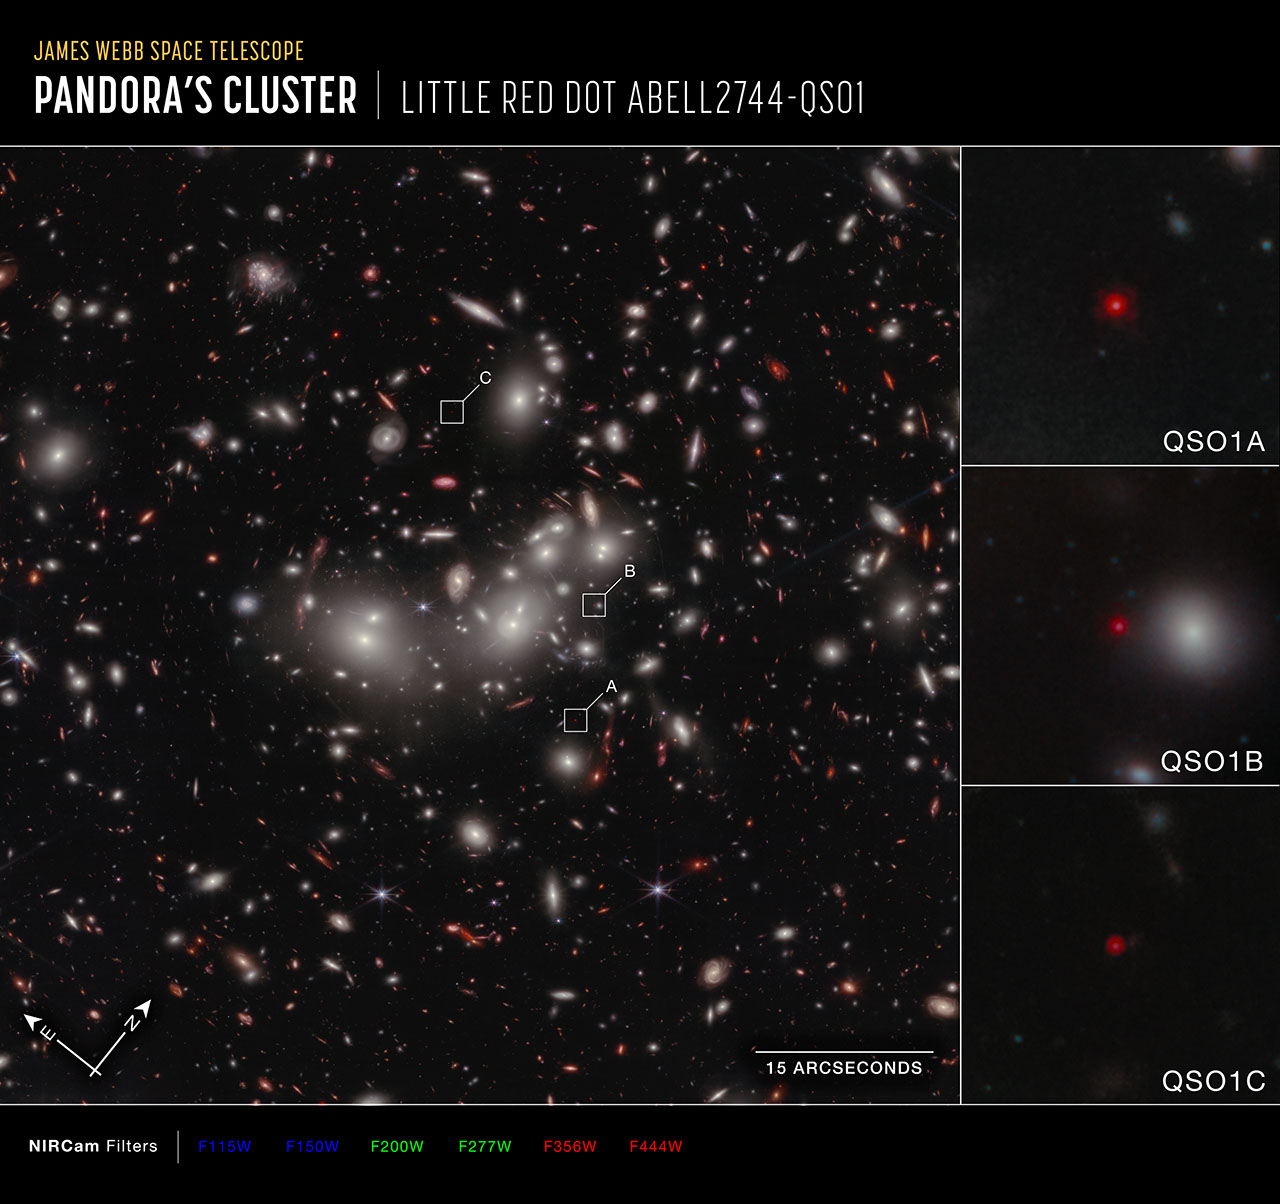
An image detail from NIRCam on NASA’s James Webb Space Telescope shows the Little Red Dot Abell2744-QSO1, gravitationally lensed by Abell 2744, an enormous mega-cluster of galaxies also known as Pandora’s Cluster.
Pulled out to the right is a map showing the speed that gas is moving toward or away from the telescope (rotational velocity) in different parts of QSO1. The map was made with data collected using NIRSpec’s integral field unit (IFU), a combination of camera and spectrograph. The IFU gathers an image along with 900 spectra from a square patch of sky 3 arcseconds by 3 arcseconds, creating maps showing differences in brightness of thousands of wavelengths between 0.6-micron and 5.3-micron light across the object. The gas velocity is calculated based on Doppler shift: The colors are shifted slightly toward shorter (bluer) wavelengths where material is moving toward us, and longer (redder) wavelengths where it is moving away.
The Webb data shows that the glowing gas has Keplerian rotation: It is orbiting a central point in the same way that planets orbit a star. This means that most of the mass of QSO1 must reside in a single point in the center, i.e., a black hole. Because the velocity of the orbiting gas follows very simple laws of gravity, the data can then be used to calculate the mass of the black hole: It appears to be 50 million solar masses, or 50 million times the mass of our Sun. This is at least two-thirds of the entire mass of QSO1.
See the full NIRCam image and explore Webb’s NIRSpec IFU observation of QSO1 on Space Telescope Live.
About the Object
- R.A. PositionR.A. PositionRight ascension – analogous to longitude – is one component of an object's position.00:14:19.16
- Dec. PositionDec. PositionDeclination – analogous to latitude – is one component of an object's position.-30:24:05.66
- ConstellationConstellationOne of 88 recognized regions of the celestial sphere in which the object appears.Sculptor
- DistanceDistanceThe physical distance from Earth to the astronomical object. Distances within our solar system are usually measured in Astronomical Units (AU). Distances between stars are usually measured in light-years. Interstellar distances can also be measured in parsecs.About 13.1 billlion light-years away (z = 7.04)
About the Data
- Data DescriptionData DescriptionProposal: A description of the observations, their scientific justification, and the links to the data available in the science archive.
Science Team: The astronomers who planned the observations and analyzed the data. "PI" refers to the Principal Investigator. - InstrumentInstrumentThe science instrument used to produce the data.Left: NIRCam Right: NIRSpec/IFU
- Exposure DatesExposure DatesThe date(s) that the telescope made its observations and the total exposure time.2 Nov 2022, 15 Nov 2022, 10 Dec 2024
- FiltersFiltersThe camera filters that were used in the science observations.NIRCam>F115W, F150W, F200W, F277W, F356W, F444W, NIRSpec>G395H
- Object NameObject NameA name or catalog number that astronomers use to identify an astronomical object.Abell2744-QSO1
- Object DescriptionObject DescriptionThe type of astronomical object.Gravitationally lensed Little Red Dot
- Release DateMay 27, 2026
- Science ReleaseNASA’s Webb Reveals Black Hole That Formed Before Its Galaxy
- CreditImage: NASA, ESA, CSA, Ignas Juodžbalis (Cambridge), Cosimo Marconcini (University of Florence), Roberto Maiolino (Cambridge), Francesco D'Eugenio (Cambridge), Hannah Übler (MPE); Image Processing: Alyssa Pagan (STScI)
The left image is a composite of separate exposures acquired by the James Webb Space Telescope using the NIRCam instrument. Several filters were used to sample specific wavelength ranges. The color results from assigning different hues (colors) to each monochromatic (grayscale) image associated with an individual filter. In this case, the assigned colors are: Blue: F115W+F150W, Green: F200W+F277W, Red: F356W+F444W The right image is a radial velocity map derived from the NIRSpec/IFU on the James Webb Space Telescope. The color results from applying a gradient map to a monochromatic image where color corresponds with direction and brightness corresponds to speed.
Related Images & Videos

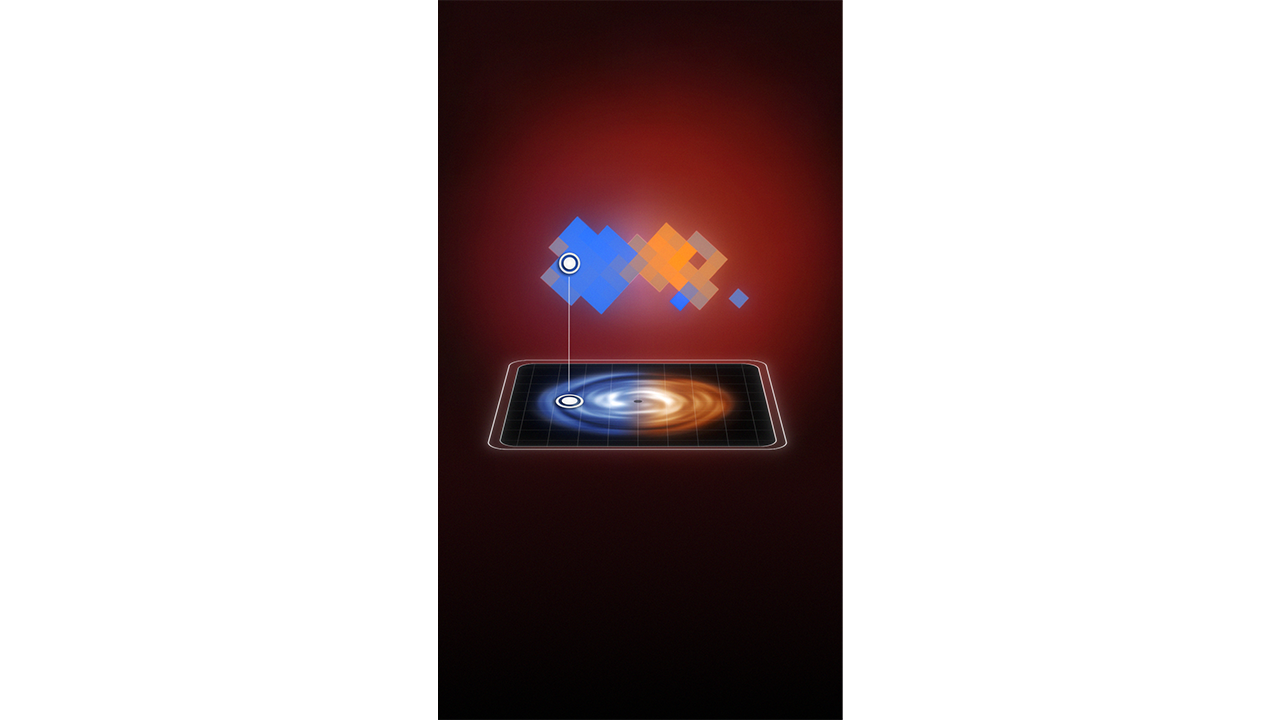
Little Red Dot Abell2744-QSO1: Sonification of Gas Velocity Around a Supermassive Black Hole (NIRCam and NIRSpec IFU)
A sonification is a translation of data into sound. In this sonification, the velocity of hydrogen gas moving around a black hole in the center of a Little Red Dot known as Abell2744-QSO1 (QSO1) is translated into sounds of varying pitch (or frequency). The faster the gas is movi...
Share
Details
Laura Betz
NASA’s Goddard Space Flight Center
Greenbelt, Maryland
laura.e.betz@nasa.gov