


1 min read
Quasar J0100+2802 (NIRCam Image)
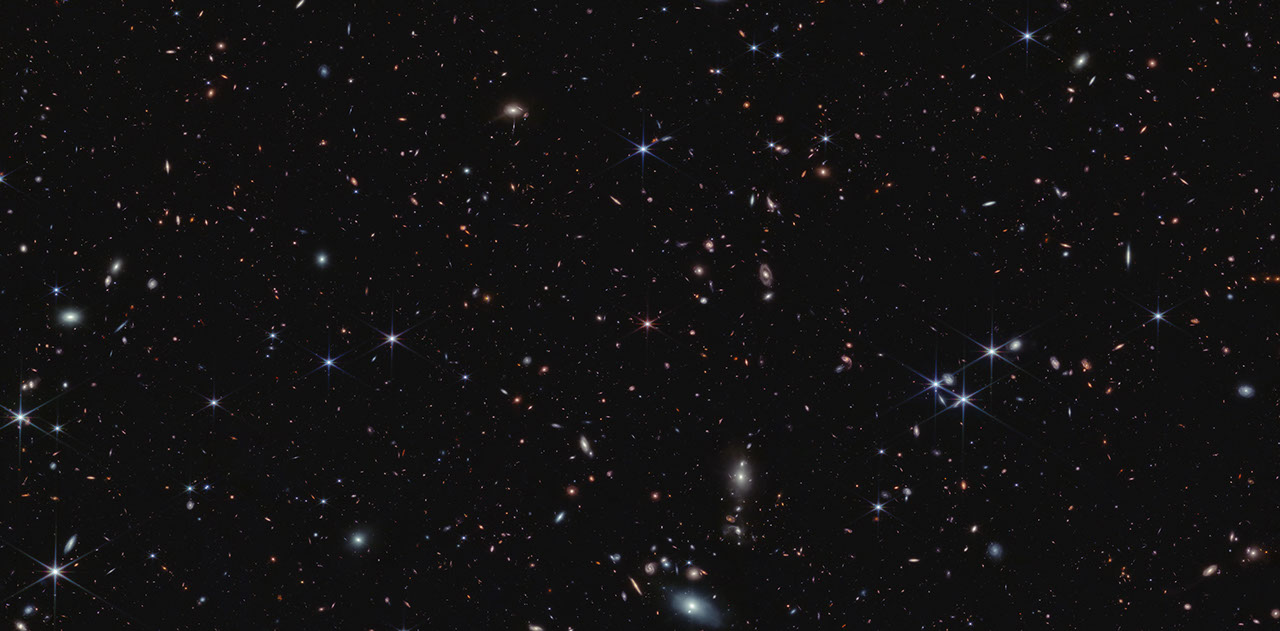
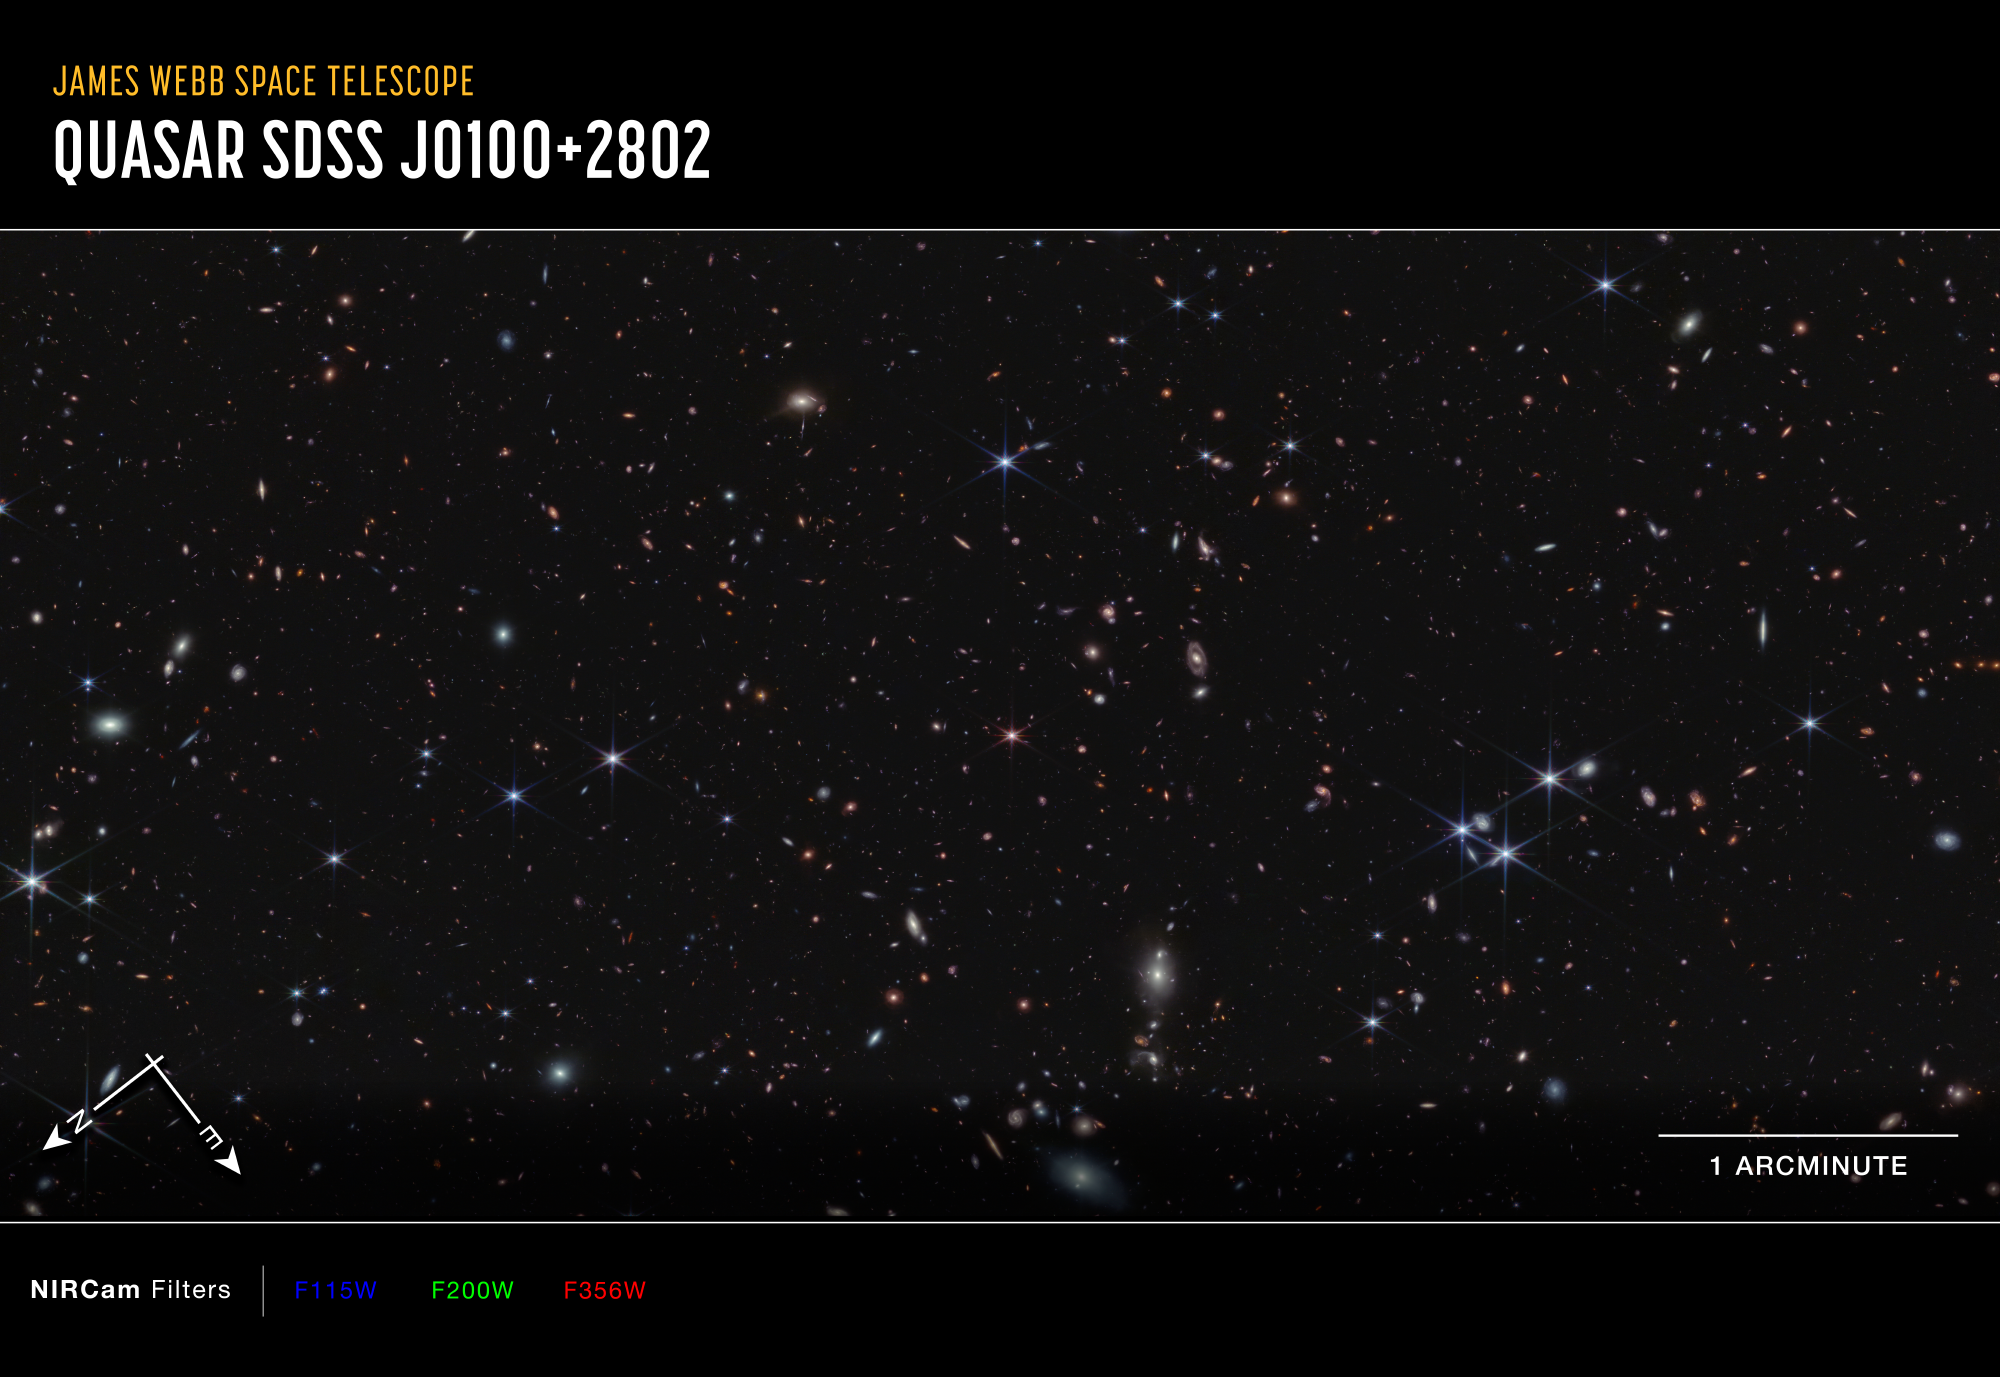
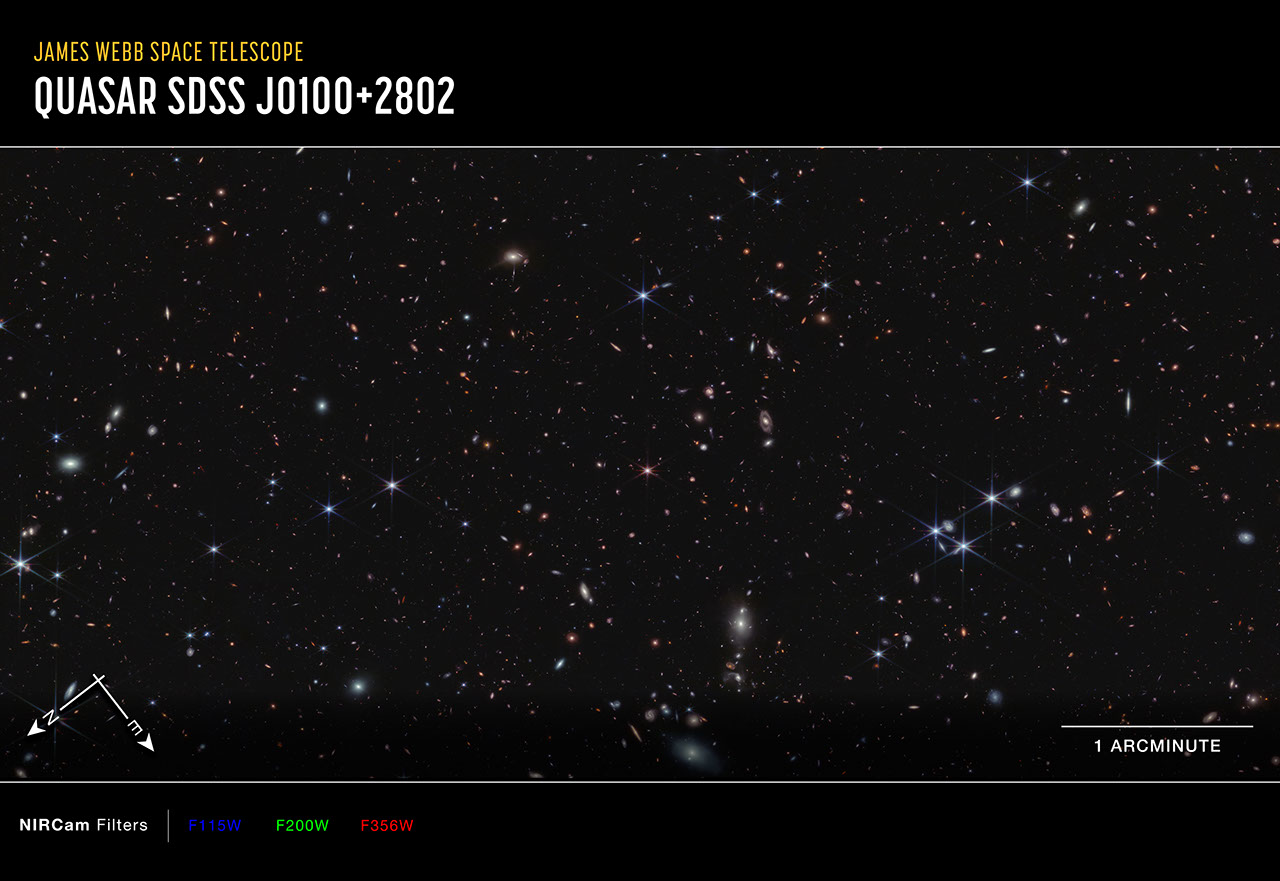
There are more than 20,000 galaxies in this field. This James Webb Space Telescope view is found between the Pisces and Andromeda constellations.
Researchers using Webb anchored their observations on quasar J0100+2802, an active supermassive black hole that acts like a beacon. It is at the center of the image above, and appears tiny and pink with six prominent diffraction spikes.
The quasar is so luminous that it acts like a flashlight, illuminating the gas between it and the telescope. The team analyzed 117 galaxies that all existed approximately 900 million years after the big bang – focusing on 59 that lie in front of the quasar. The researchers could study not only the galaxies themselves, but also the illuminated gas surrounding them.
These galaxies existed just before the end of the Era of Reionization, when the universe contained a patchwork of gas – some opaque and some transparent (or ionized). “As we look back into the teeth of reionization, we see a very distinct change,” explained Simon Lilly of ETH Zürich in Switzerland, who leads this team of researchers. “Galaxies, which are made up of billions of stars, are ionizing the gas around them, effectively transforming it into transparent gas.”
Researchers have long sought evidence to explain what happened during this period, when the universe experienced dramatic changes. After the big bang, gas in the universe was incredibly hot and dense. Over hundreds of millions of years, the gas cooled. Then, the universe hit “repeat.” The gas again became hot and ionized – and transparent.
The team’s results more concretely define the conditions at this specific “stop” in the universe’s history. “Not only does Webb clearly show that these transparent regions exist around galaxies, we’ve also measured how large they are,” explained Daichi Kashino of Nagoya University in Japan and the lead author of the team’s first paper. Think of the transparent regions of gas like hot air balloons, with galaxies the size of peas clearing that space.
Webb showed that galaxies have fully ionized the gas within a 2 million light-year radius. That’s approximately the same distance as the space between our Milky Way galaxy and our nearest neighbor, Andromeda. Over the next hundred million years, the bubbles went on to grow larger and larger, eventually merging and causing the entire universe to become transparent.
These results were announced by members of the Emission-line galaxies and Intergalactic Gas in the Epoch of Reionization (EIGER) team. The team will eventually have images and data from six fields, each centered on a quasar, but Webb’s first image from NIRCam (Near-Infrared Camera) and data known as spectra are so detailed that they could easily make definitive conclusions without waiting for additional observations.
About the Object
- R.A. PositionR.A. PositionRight ascension – analogous to longitude – is one component of an object's position.01:00:13.02
- Dec. PositionDec. PositionDeclination – analogous to latitude – is one component of an object's position.+28:02:25.8
- ConstellationConstellationOne of 88 recognized regions of the celestial sphere in which the object appears.Pisces
- DistanceDistanceThe physical distance from Earth to the astronomical object. Distances within our solar system are usually measured in Astronomical Units (AU). Distances between stars are usually measured in light-years. Interstellar distances can also be measured in parsecs.12.8 billion lights years to quasar SDSS J0100+2802
- DimensionsDimensionsThe physical size of the object or the apparent angle it subtends on the sky.Field is about 6.7 arcminutes across
About the Data
- Data DescriptionData DescriptionProposal: A description of the observations, their scientific justification, and the links to the data available in the science archive.
Science Team: The astronomers who planned the observations and analyzed the data. "PI" refers to the Principal Investigator.This image was created with Webb data from proposal: 1243 (S. Lilly)
- InstrumentInstrumentThe science instrument used to produce the data.NIRCam
- Exposure DatesExposure DatesThe date(s) that the telescope made its observations and the total exposure time.22 Aug 2022
- FiltersFiltersThe camera filters that were used in the science observations.F115W, F200W, F356W
- Object NameObject NameA name or catalog number that astronomers use to identify an astronomical object.Quasar SDSS J0100+2802, EIGER (Emission-line galaxies and Intergalactic Gas in the Epoch of Reionization) Survey
- Object DescriptionObject DescriptionThe type of astronomical object.Deep field survey
- Release DateJune 12, 2023
- Science ReleaseNASA’s Webb Proves Galaxies Transformed the Early Universe
- CreditImage: NASA, ESA, CSA, Simon Lilly (ETH Zurich), Daichi Kashino (Nagoya University), Jorryt Matthee (ETH Zurich), Christina Eilers (MIT), Rob Simcoe (MIT), Rongmon Bordoloi (NCSU), Ruari Mackenzie (ETH Zurich); Image Processing: Alyssa Pagan (STScI), Ruari Mackenzie (ETH Zurich)
These images are a composite of separate exposures acquired by the James Webb Space Telescope using the NIRCam instrument. Several filters were used to sample wide wavelength ranges. The color results from assigning different hues (colors) to each monochromatic (grayscale) image associated with an individual filter. In this case, the assigned colors are: Blue: F115W Green: F200W Red: F356W
Related Images & Videos
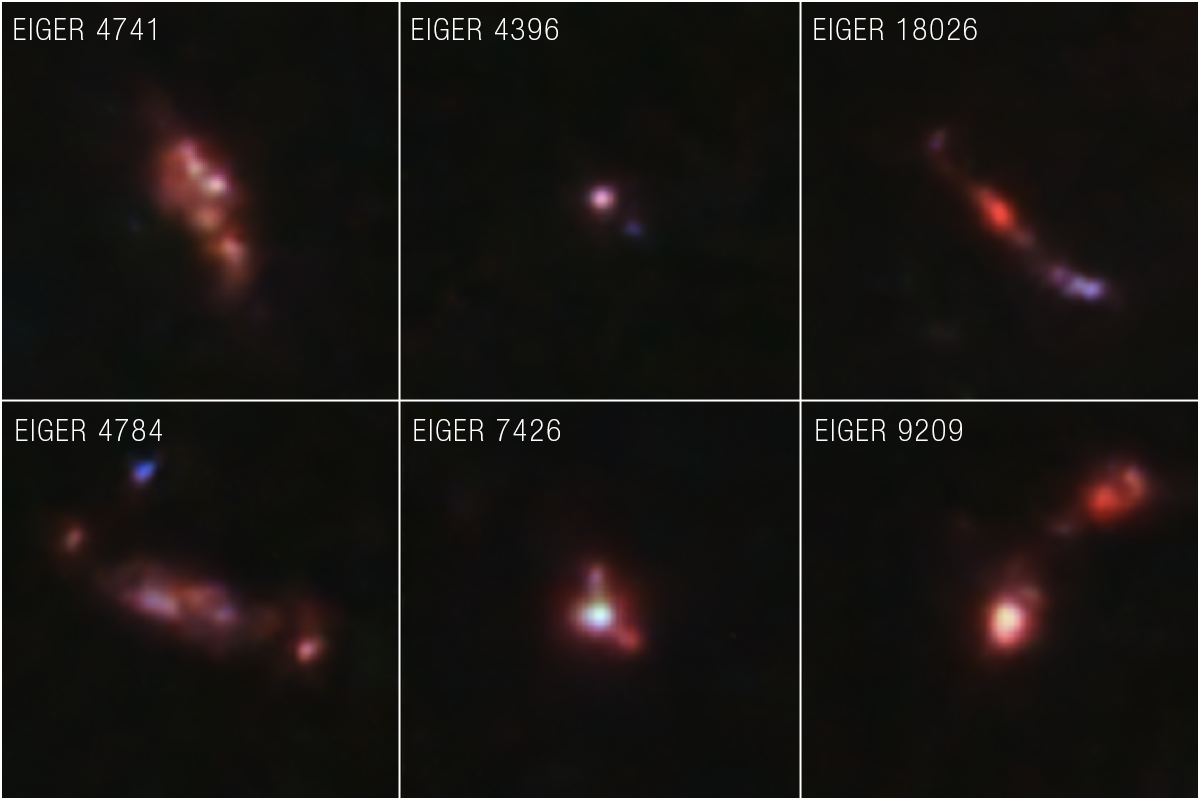
Distant Galaxy Samples Near Quasar J0100+2802 (NIRCam Image)
The James Webb Space Telescope has returned extraordinarily detailed images and spectra of galaxies that existed when the universe was only 900 million years old. “In Webb’s near-infrared image, we can see structures in every individual galaxy that the telescope detected,”...
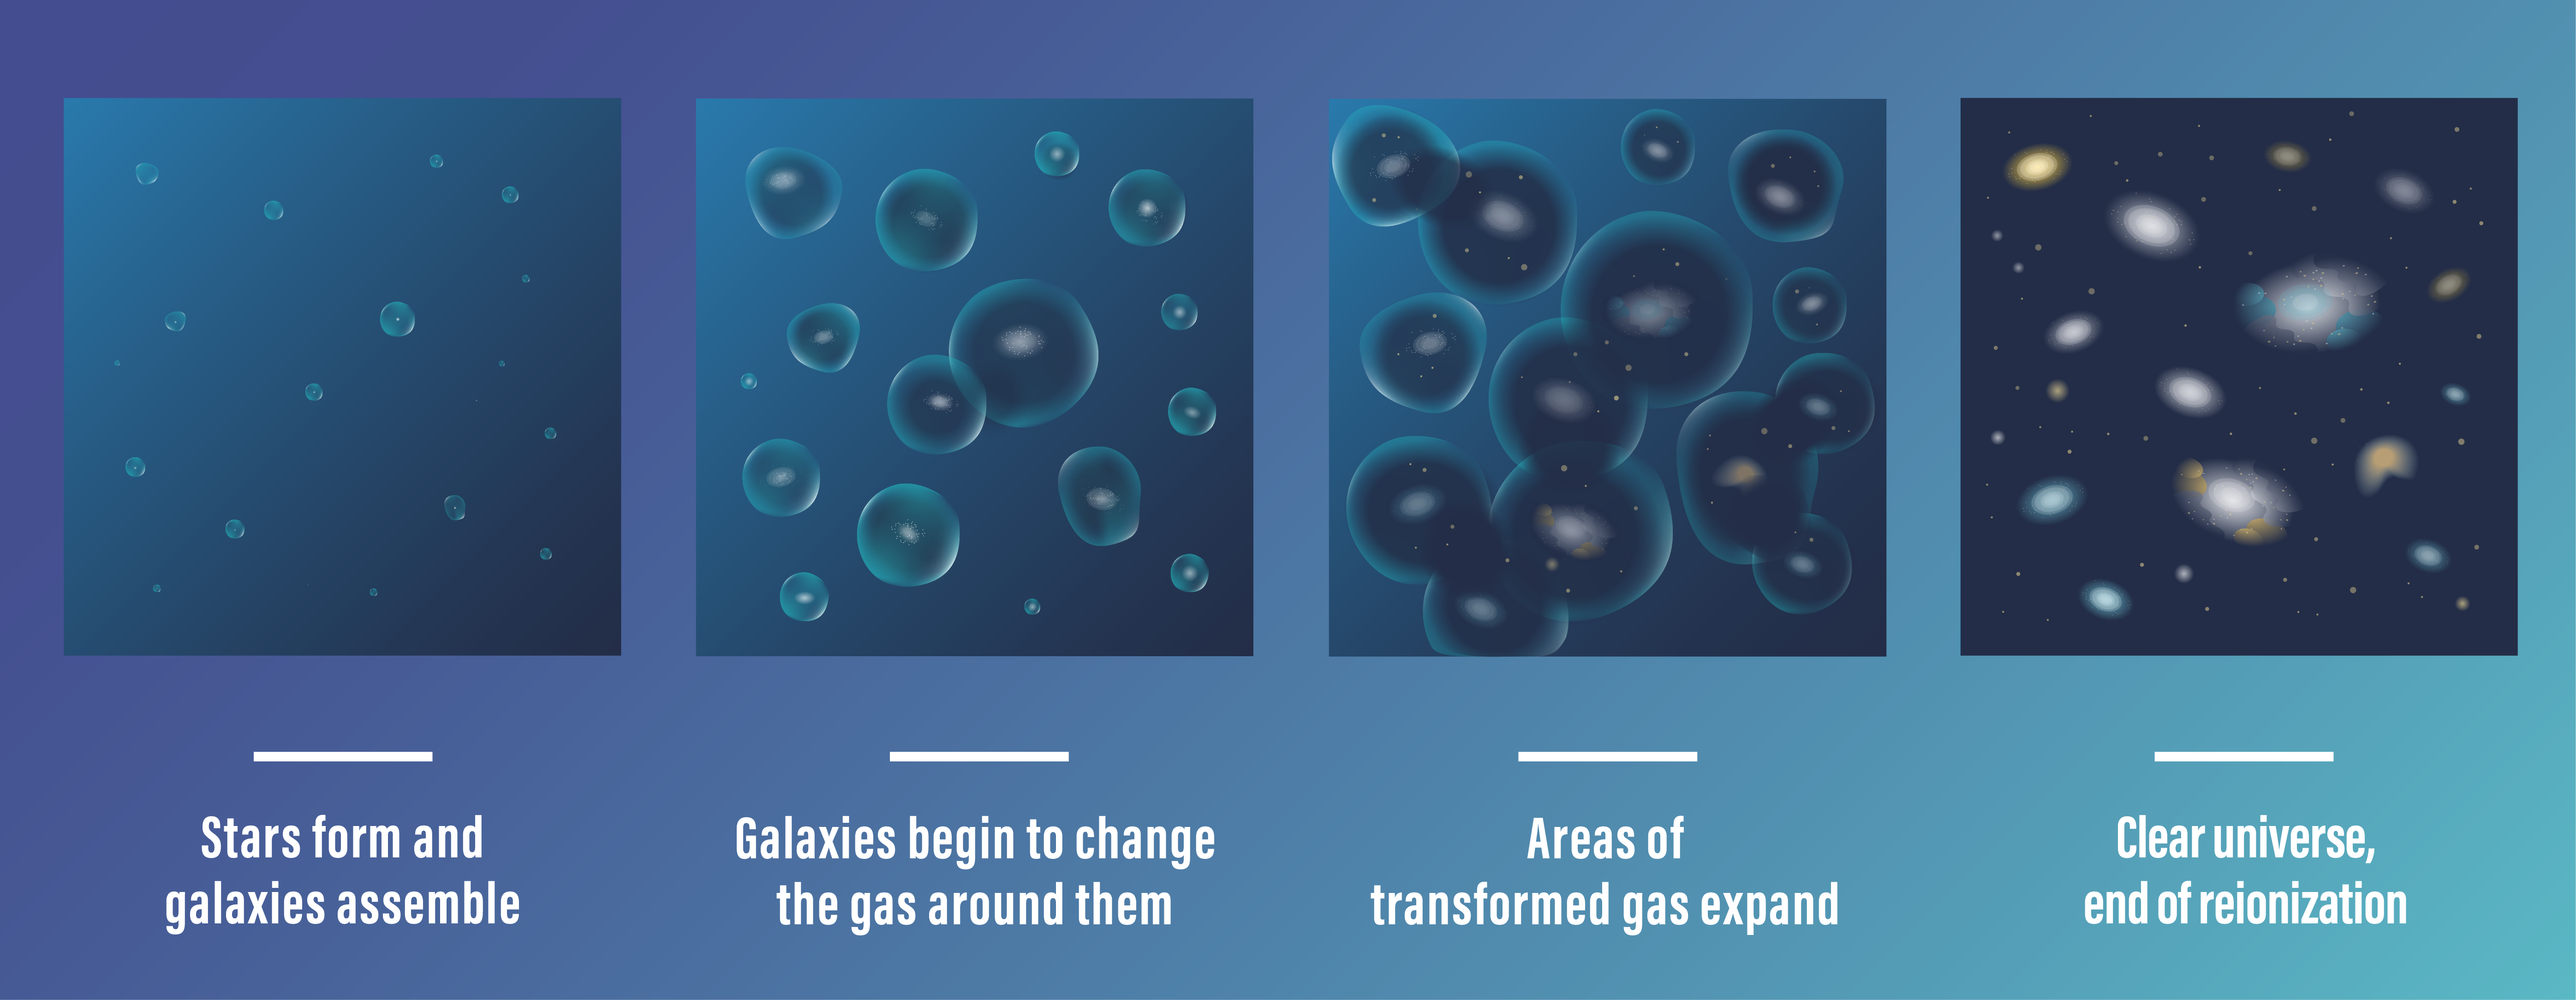
Conditions During the Era of Reionization (Illustration)
More than 13 billion years ago, during the Era of Reionization, the universe was a very different place. The gas between galaxies was largely opaque to energetic light, making it difficult to observe young galaxies. As stars and young galaxies continued to form and evolve, they...
Quasar J0100+2802 (NIRCam Compass Image)
This image centered on quasar J0100+2802, captured by Webb’s NIRCam (Near-Infrared Camera), shows compass arrows, scale bar, and color key for reference. The north and east compass arrows show the orientation of the image on the sky. Note that the relationship between north and...
Share
Details
Laura Betz
NASA’s Goddard Space Flight Center
Greenbelt, Maryland
laura.e.betz@nasa.gov
NASA, ESA, CSA, Simon Lilly (ETH Zurich), Daichi Kashino (Nagoya University), Jorryt Matthee (ETH Zurich), Christina Eilers (MIT), Rob Simcoe (MIT), Rongmon Bordoloi (NCSU), Ruari Mackenzie (ETH Zurich)
Alyssa Pagan (STScI), Ruari Mackenzie (ETH Zurich)


