


1 min read
Simulated Transmission Spectrum of Exoplanet TOI-421 b
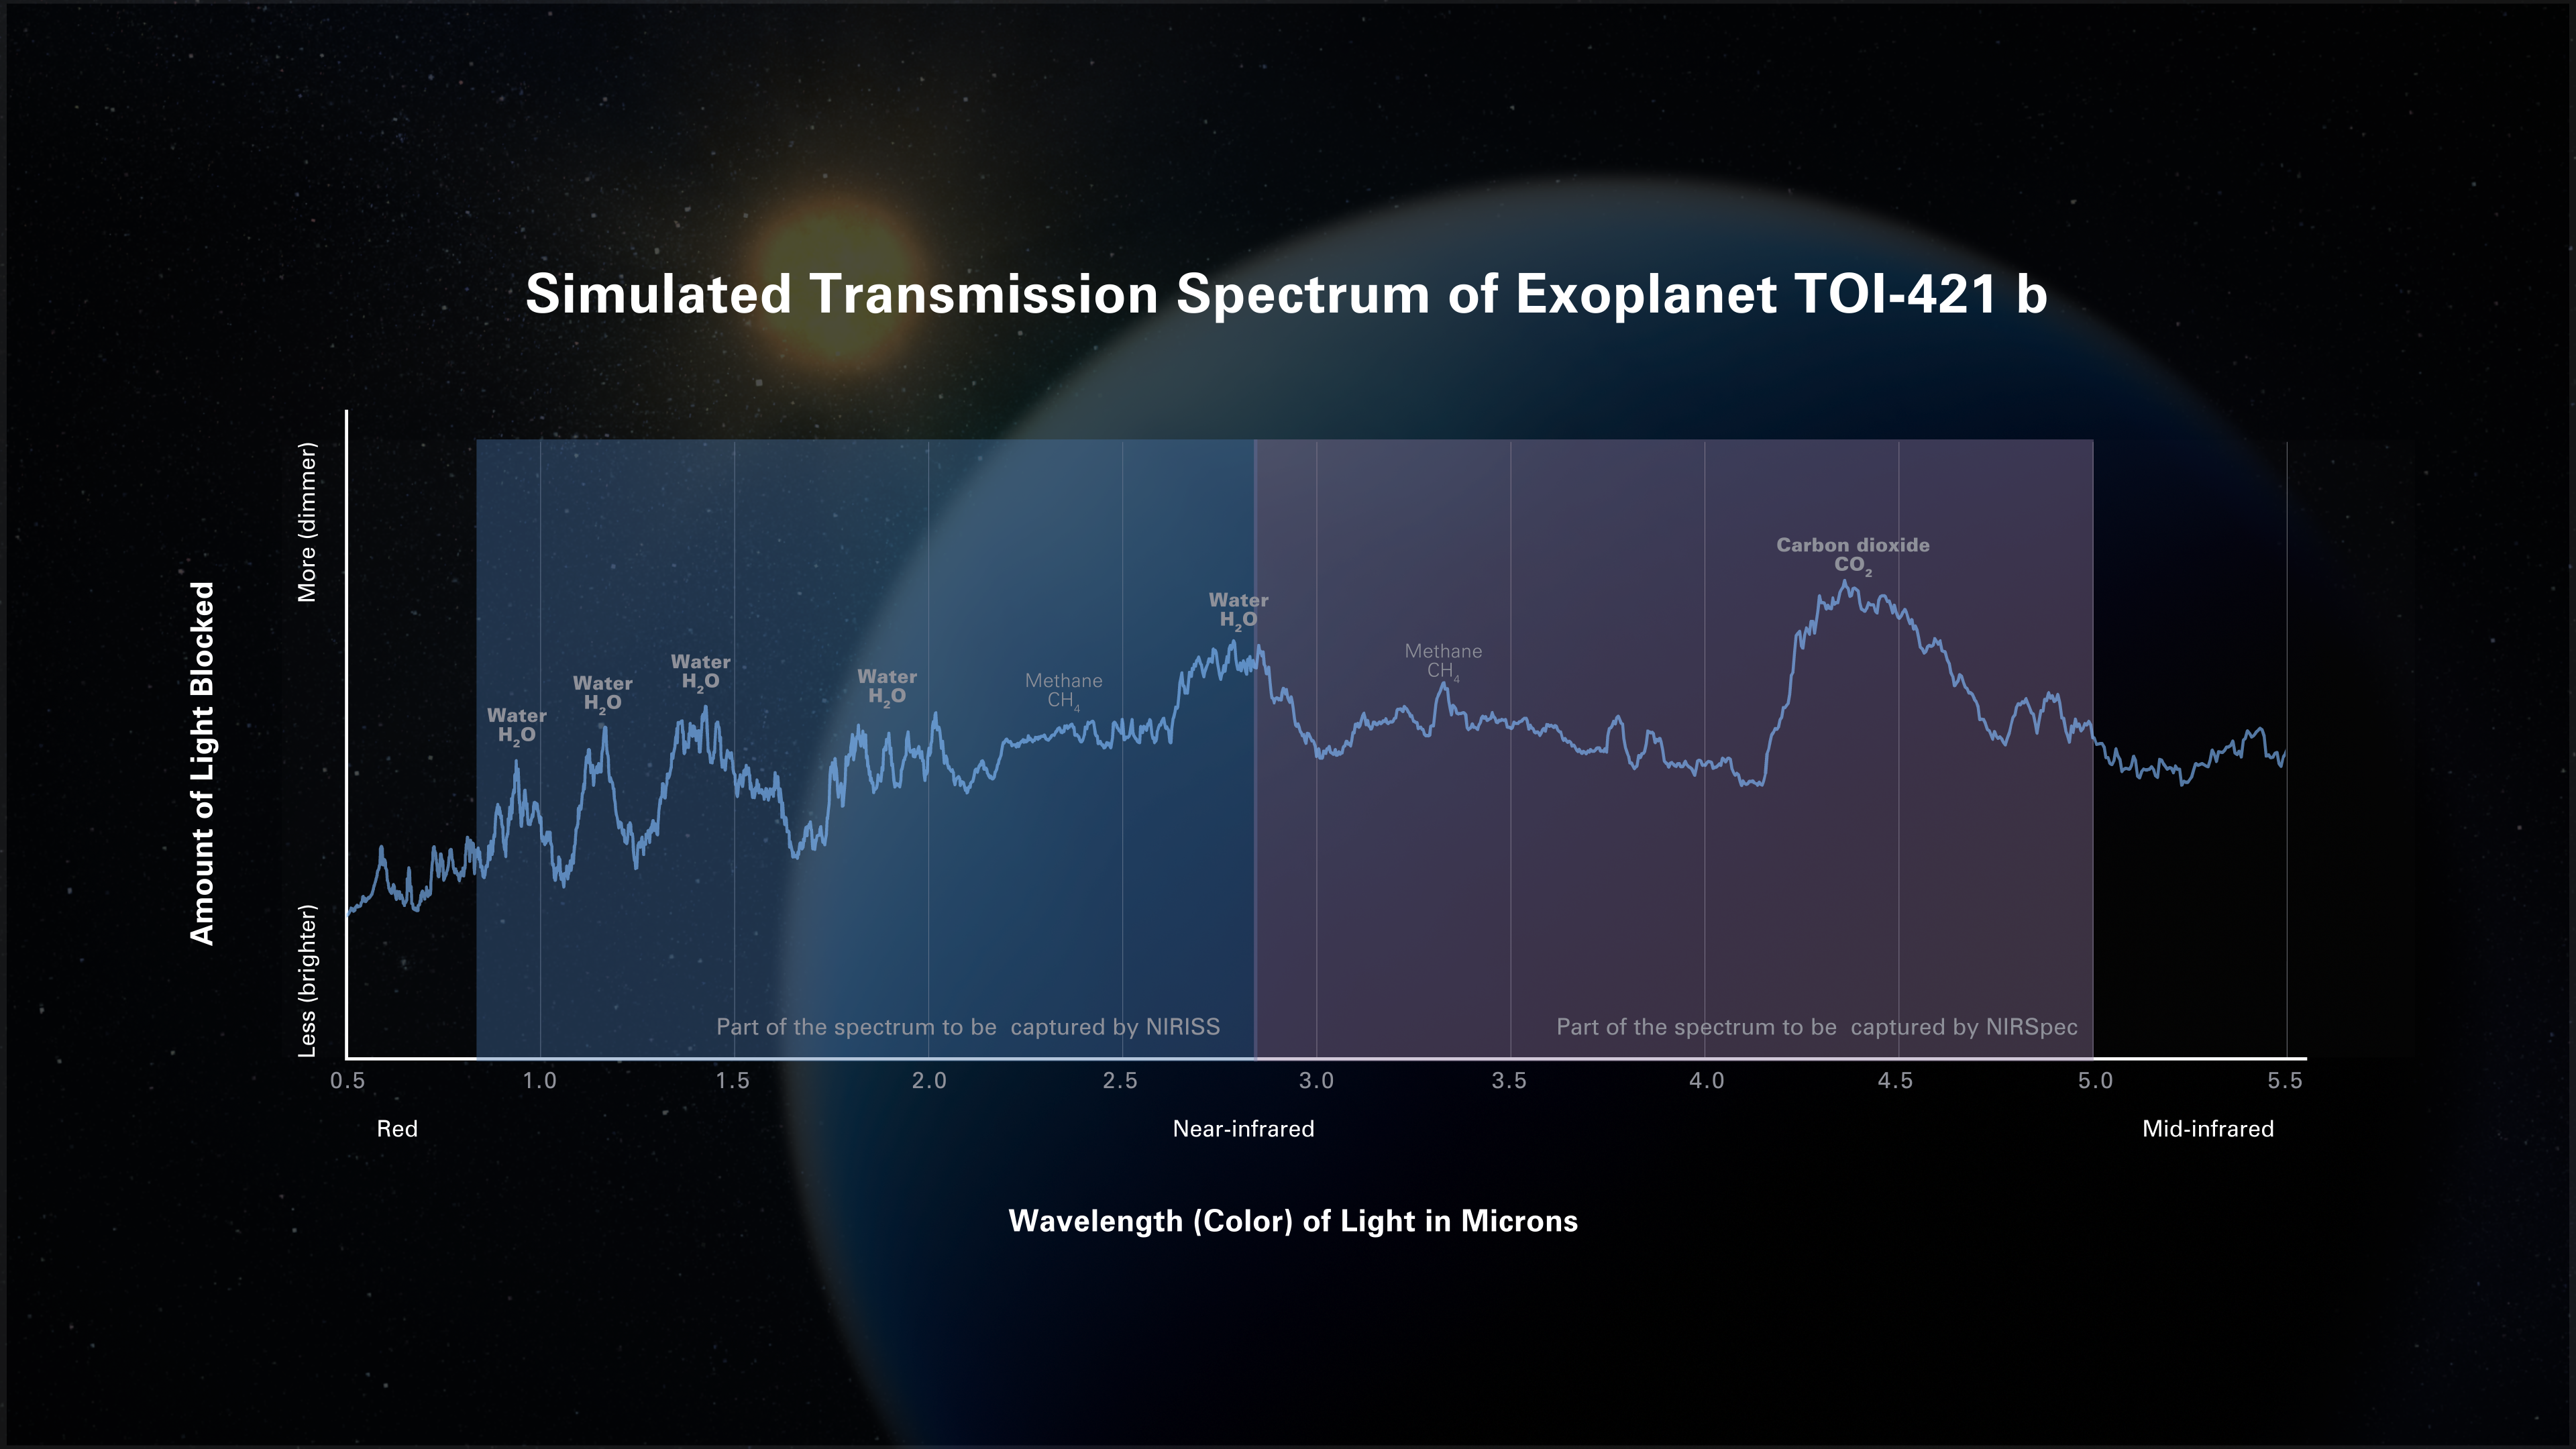
Possible transmission spectrum of the hot sub-Neptune exoplanet TOI-421 b. A transmission spectrum shows the amount of starlight of different wavelengths (colors) that is blocked by the planet’s atmosphere. Researchers use computer models to predict what spectra will look like assuming certain plausible atmospheric conditions such as temperature, the abundance of different gases, and what types of aerosols are present.
This particular simulation assumes that TOI-421 b has a hot hydrogen-, carbon-, and oxygen-rich atmosphere that is free of clouds and haze. Webb’s Near-Infrared Imager and Slitless Spectrograph (NIRISS) and Near-Infrared Spectrograph (NIRSpec) will make it possible to easily identify and measure the abundance of molecules like water (H2O), methane (CH4), and carbon dioxide (CO2) in a haze-free atmosphere like this. The spectrum shows prominent peaks indicating an abundance of water vapor and carbon dioxide, and minor amounts of methane. Once Webb observes the planet, researchers will compare the real data to simulated spectra like this to determine the actual conditions of the planet.
Extended Description and Image Alt Text
Extended Description
A line graph of “Amount of Light Blocked” on the vertical y-axis versus “Wavelength (Color) of Light in Microns” on the horizontal x-axis, representing a simulated transmission spectrum of the exoplanet TOI-421 b.
Graph Axes
The y-axis ranges from less light blocked (brighter) at the bottom to more light blocked (dimmer) at the top. The x-axis ranges from 0.5 microns on the left to 5.5 microns on the right, labeled in even increments of 0.5 microns. The x-axis is also labeled as red on the far left, near-infrared in the middle, and mid-infrared on the far right.
Background
The area of the graph from 0.83 microns to 2.85 microns is shaded blue and labeled “Part of the spectrum to be captured by NIRISS.” The area from 2.85 microns to 5.0 microns is shaded purple and labeled “Part of the spectrum to be captured by NIRSpec.”
Graphed Data
The graph consists of more than 600 data points connected by a line. The overall shape of the line is jagged with peaks of different amplitude and width. The peaks represent wavelengths that are blocked more (light is dimmer) relative to surrounding wavelengths.
Prominent peaks are labeled:
- Prominent peaks labeled “Water (H2O)” are centered near 0.95, 1.2, 1.4, 1.9, and 2.8 microns.
- A prominent peak labeled “Carbon dioxide (CO2)” is centered near 4.4 microns.
Background
In the background of the graph is an artist’s concept of the exoplanet and its star. The planet is light blue and appears larger and closer. The star is yellow to orange and is much smaller, appearing farther away.
Image Alt Text
Graphic titled “Simulated Transmission Spectrum of Exoplanet TOI-421 b” showing a graph of the amount of light blocked versus wavelength of light with peaks labeled.
About the Object
- R.A. PositionR.A. PositionRight ascension – analogous to longitude – is one component of an object's position.5:27:24.79
- Dec. PositionDec. PositionDeclination – analogous to latitude – is one component of an object's position.-14:16:36.27
- ConstellationConstellationOne of 88 recognized regions of the celestial sphere in which the object appears.Lepus
- DistanceDistanceThe physical distance from Earth to the astronomical object. Distances within our solar system are usually measured in Astronomical Units (AU). Distances between stars are usually measured in light-years. Interstellar distances can also be measured in parsecs.244 light-years
About the Data
- Data DescriptionData DescriptionProposal: A description of the observations, their scientific justification, and the links to the data available in the science archive.
Science Team: The astronomers who planned the observations and analyzed the data. "PI" refers to the Principal Investigator.Simulated transit observations of TOI-421 b using NIRISS-SOSS and NIRSpec +G395M, assuming a clear, metal-enhanced (100x solar) atmosphere. (Kempton, et al., Cycle 1 GO Proposal 1935)
- Object NameObject NameA name or catalog number that astronomers use to identify an astronomical object.TOI-421 b
- Object DescriptionObject DescriptionThe type of astronomical object.Hot sub-Neptune exoplanet
- Release DateNovember 17, 2021
- Science ReleaseNASA’s James Webb Space Telescope Primed to Lift the Haze Surrounding Sub-Neptunes
- CreditIllustration: NASA, ESA, CSA, Dani Player (STScI); Science: Eliza Kempton (UMD)
Related Images & Videos
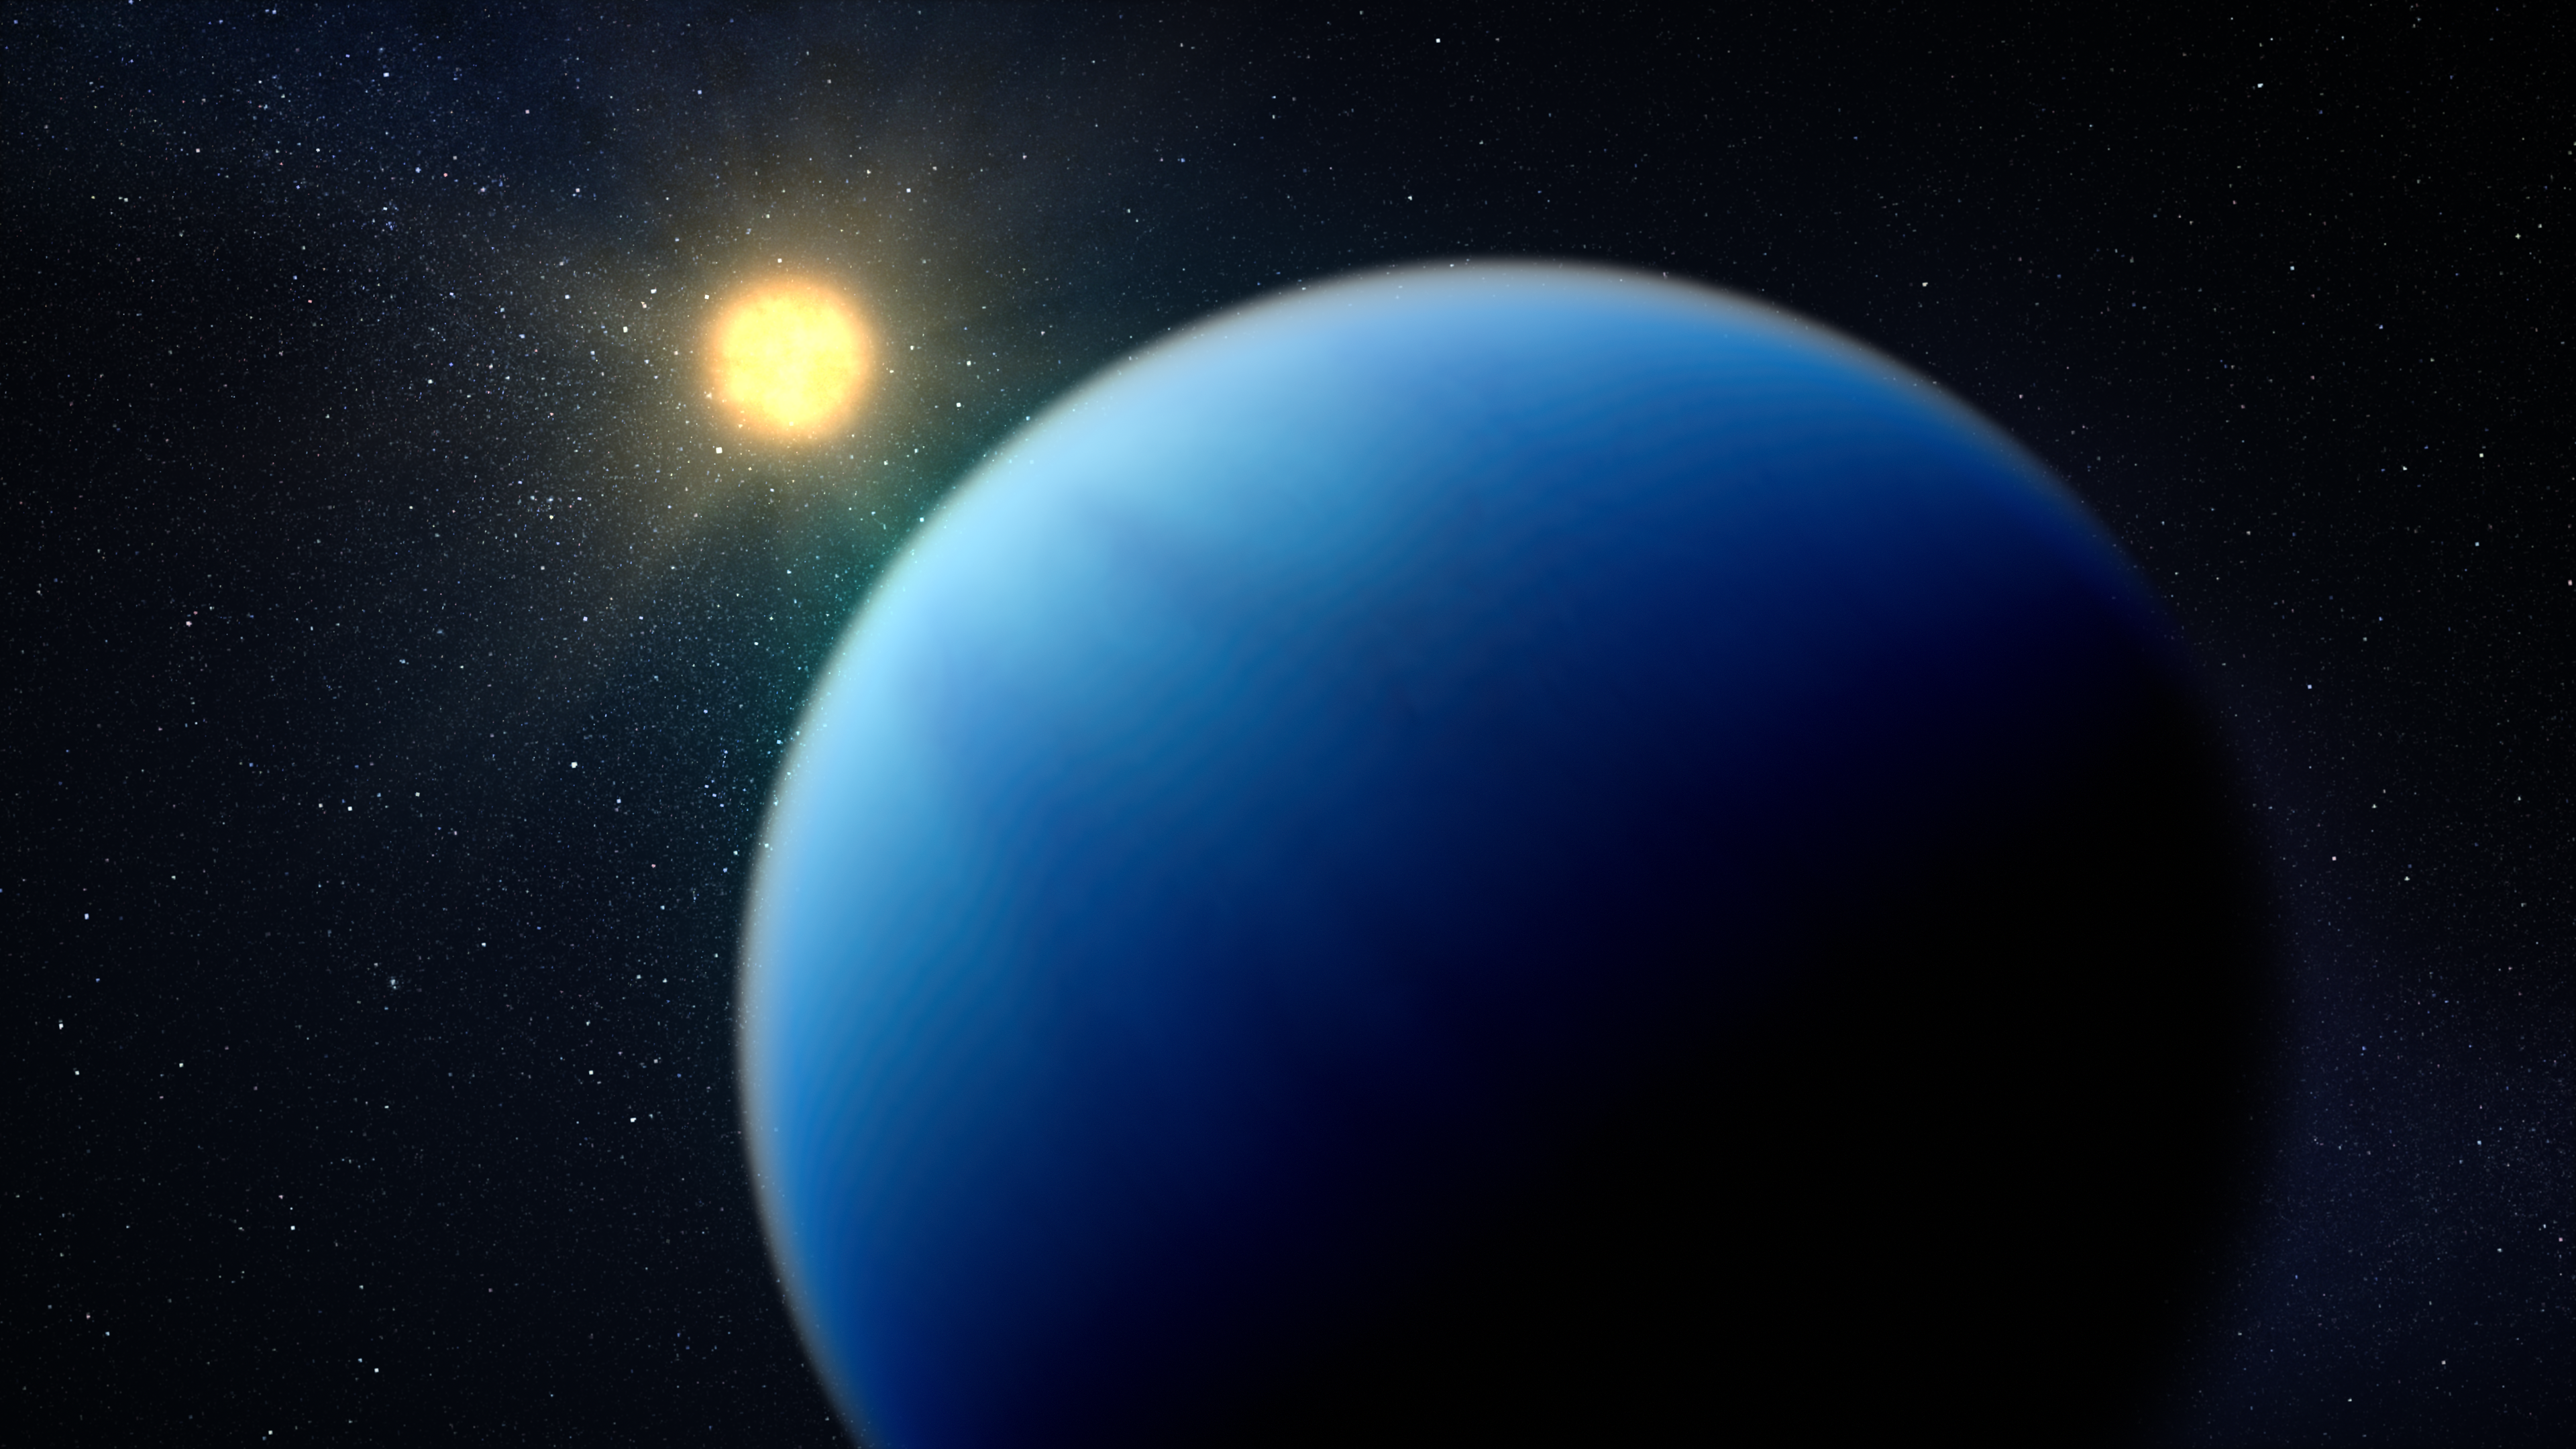
Exoplanet TOI-421 b and Its Star (Illustration)
Illustration of what exoplanet TOI-421 b might look like. TOI-421 b is a hot sub-Neptune-sized exoplanet orbiting a Sun-like star roughly 244 light-years from Earth. TOI-421 b is thought to have a clear atmosphere free of haze and clouds. This illustration is based on our...
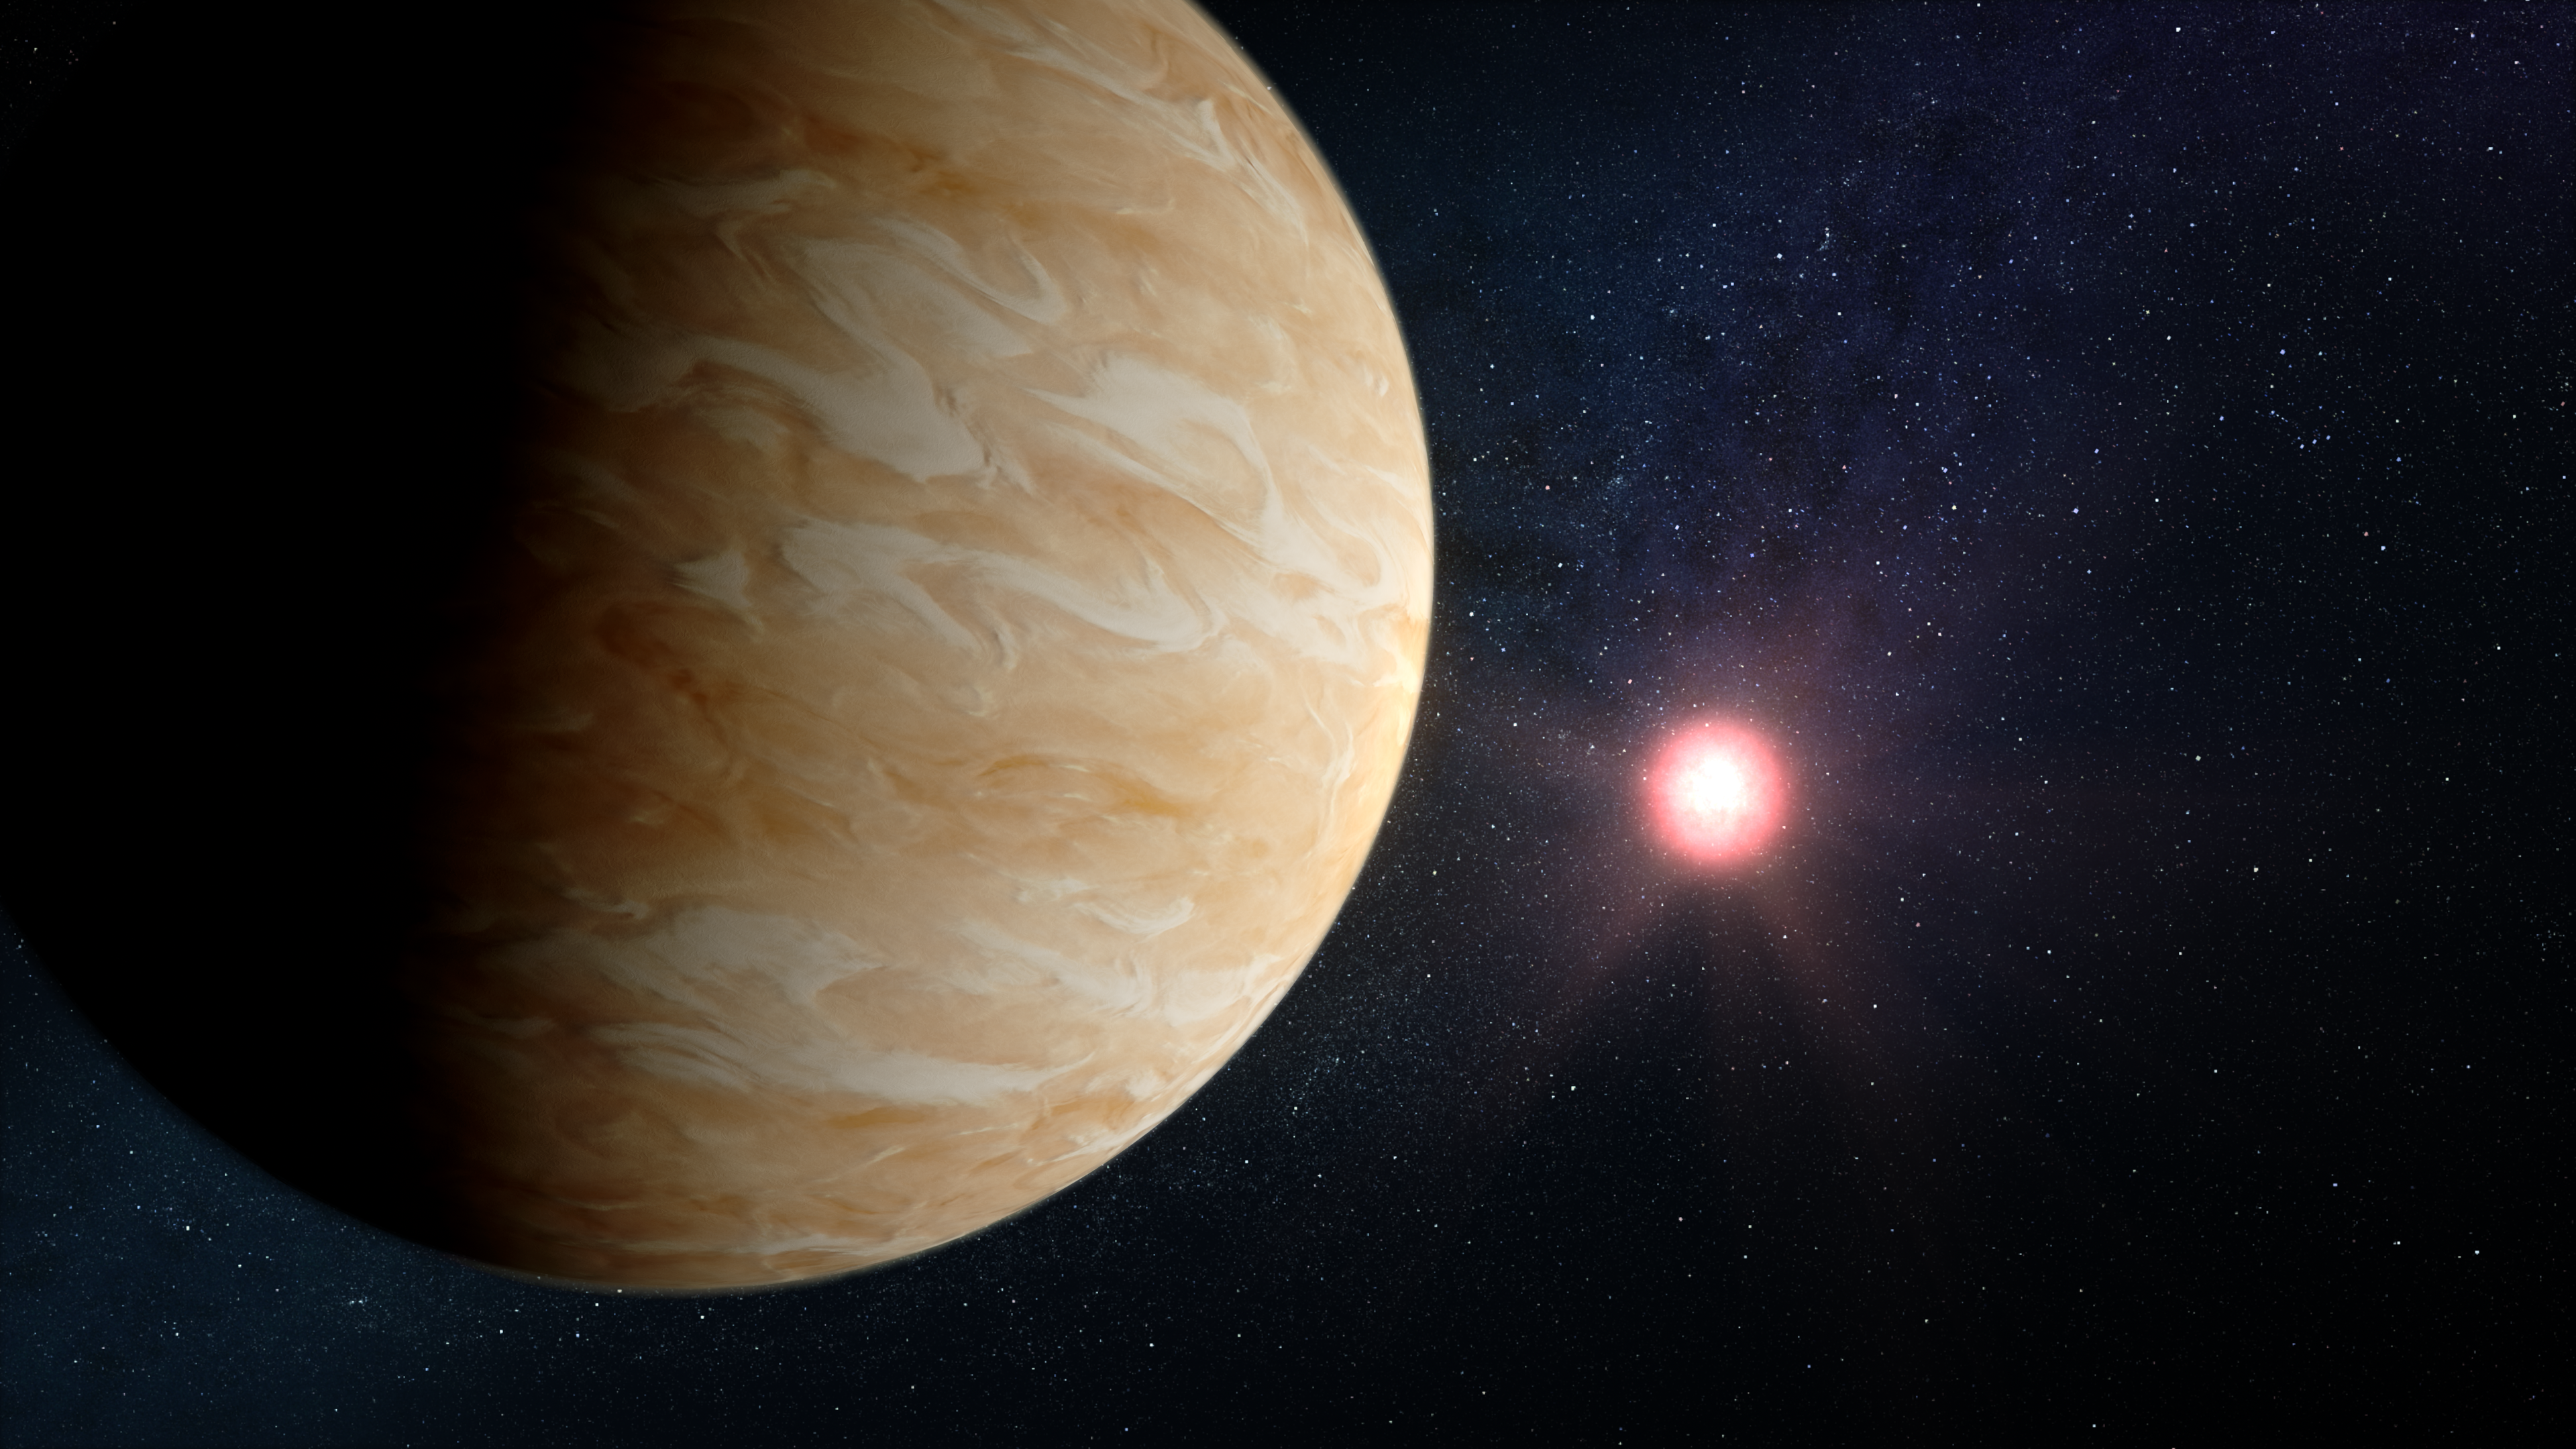
Exoplanet GJ 1214 b and Its Star (Illustration)
Illustration showing what exoplanet GJ 1214 b could look like based on current information. GJ 1214 b, a warm sub-Neptune-sized exoplanet roughly 48 light-years from Earth, is one of the most studied exoplanets in the galaxy. Previous spectroscopic observations indicate that the...
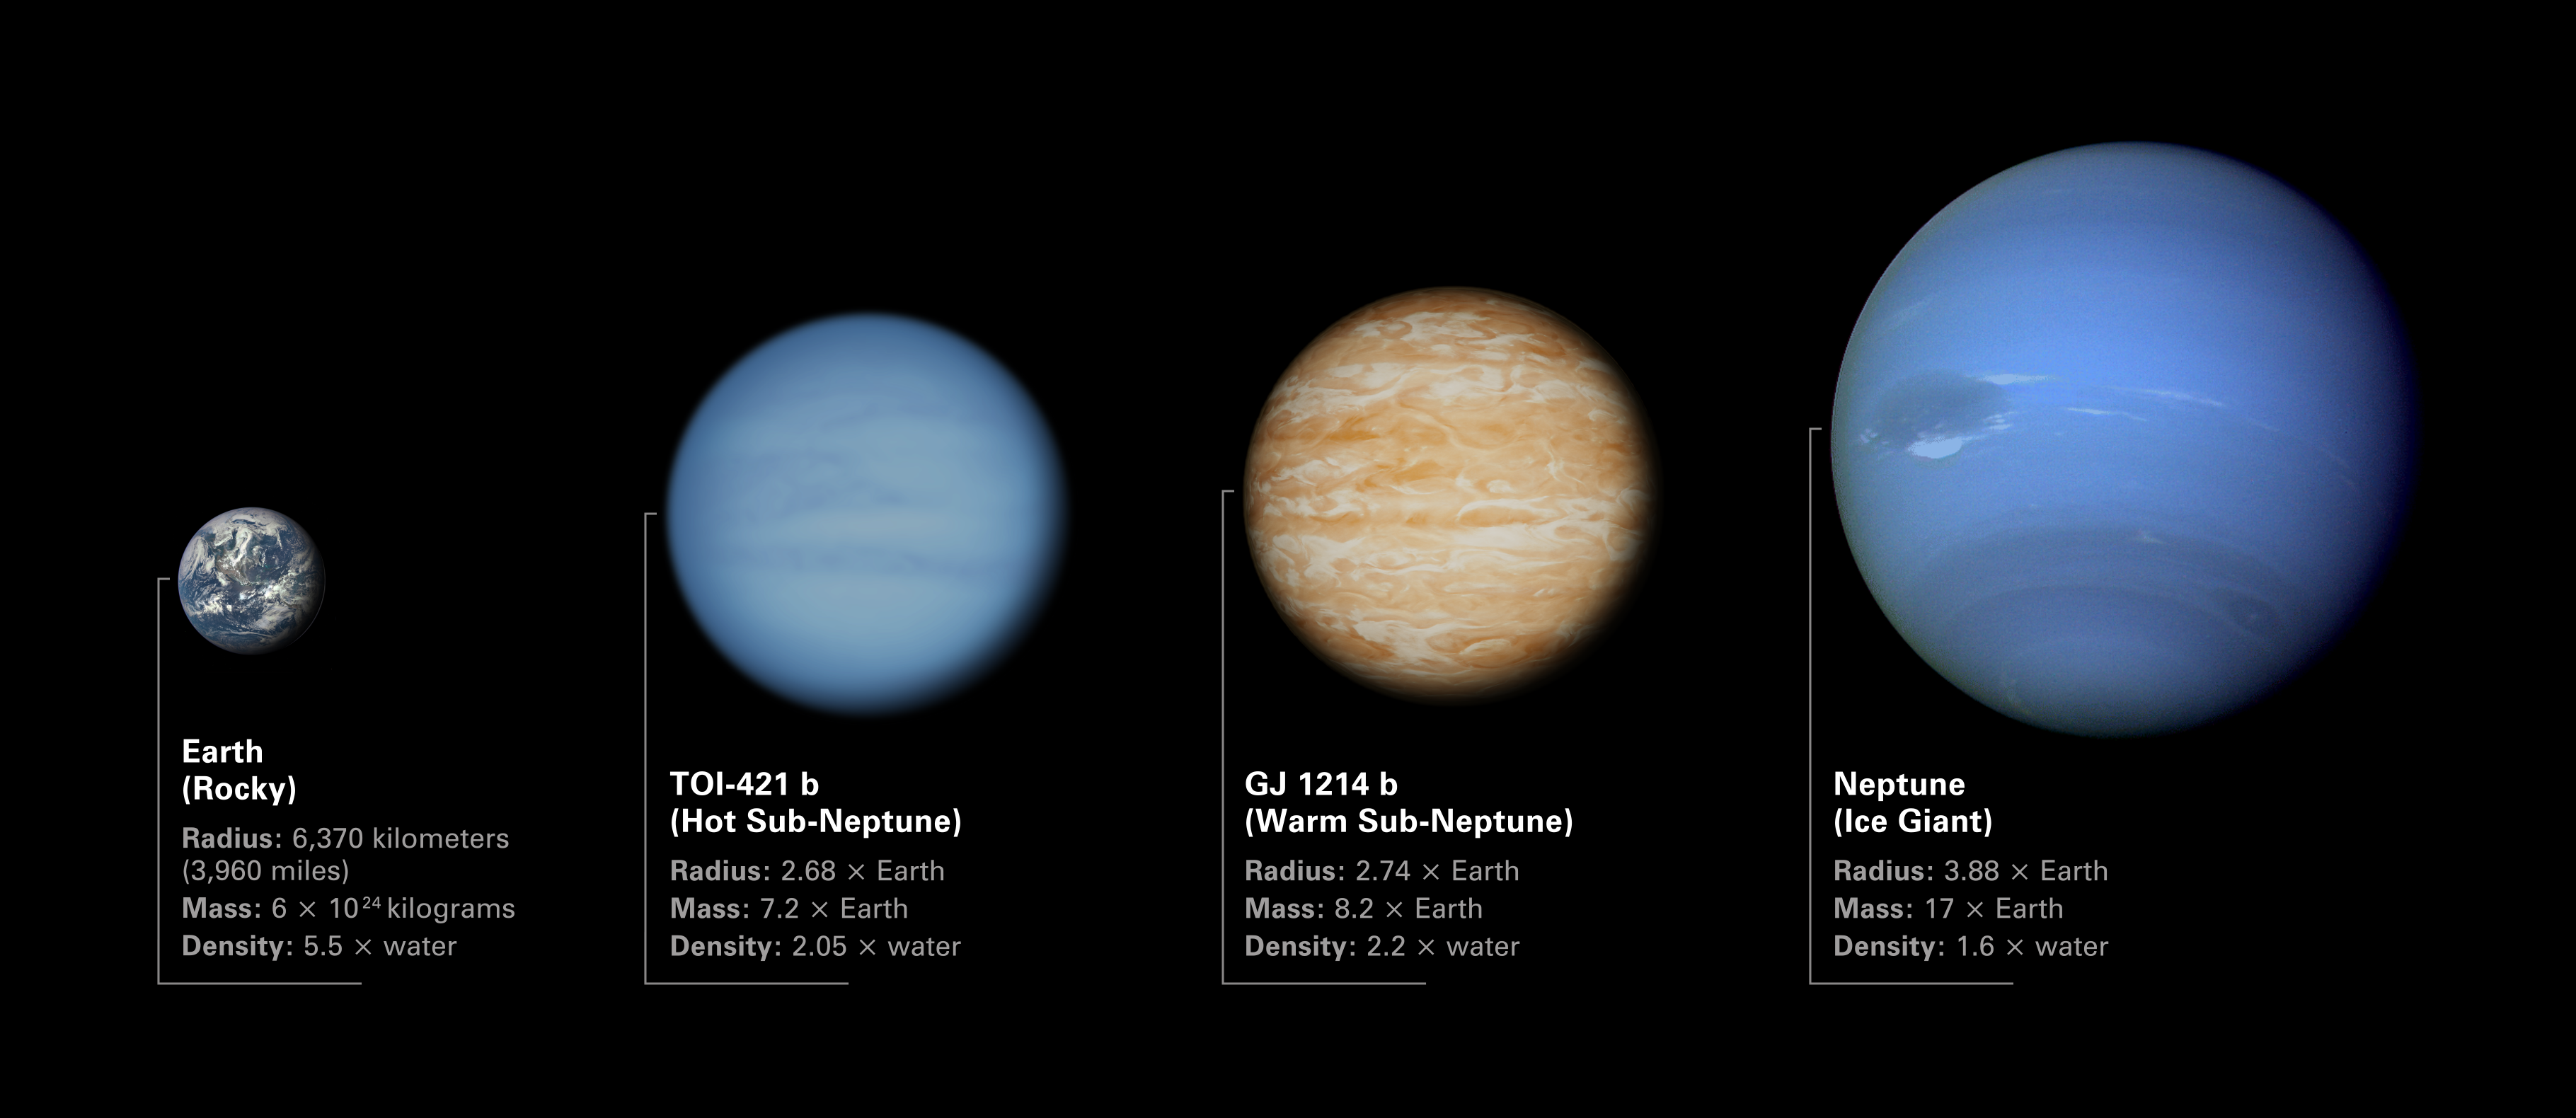
Comparison of TOI-421 b and GJ 1214 b to Earth and Neptune
Illustration comparing the sizes of sub-Neptune exoplanets TOI-421 b and GJ 1214 b to Earth and Neptune. Both TOI-421 b and GJ 1214 b are in between Earth and Neptune in terms of radius, mass, and density. The low densities of the two exoplanets indicates that they must have...
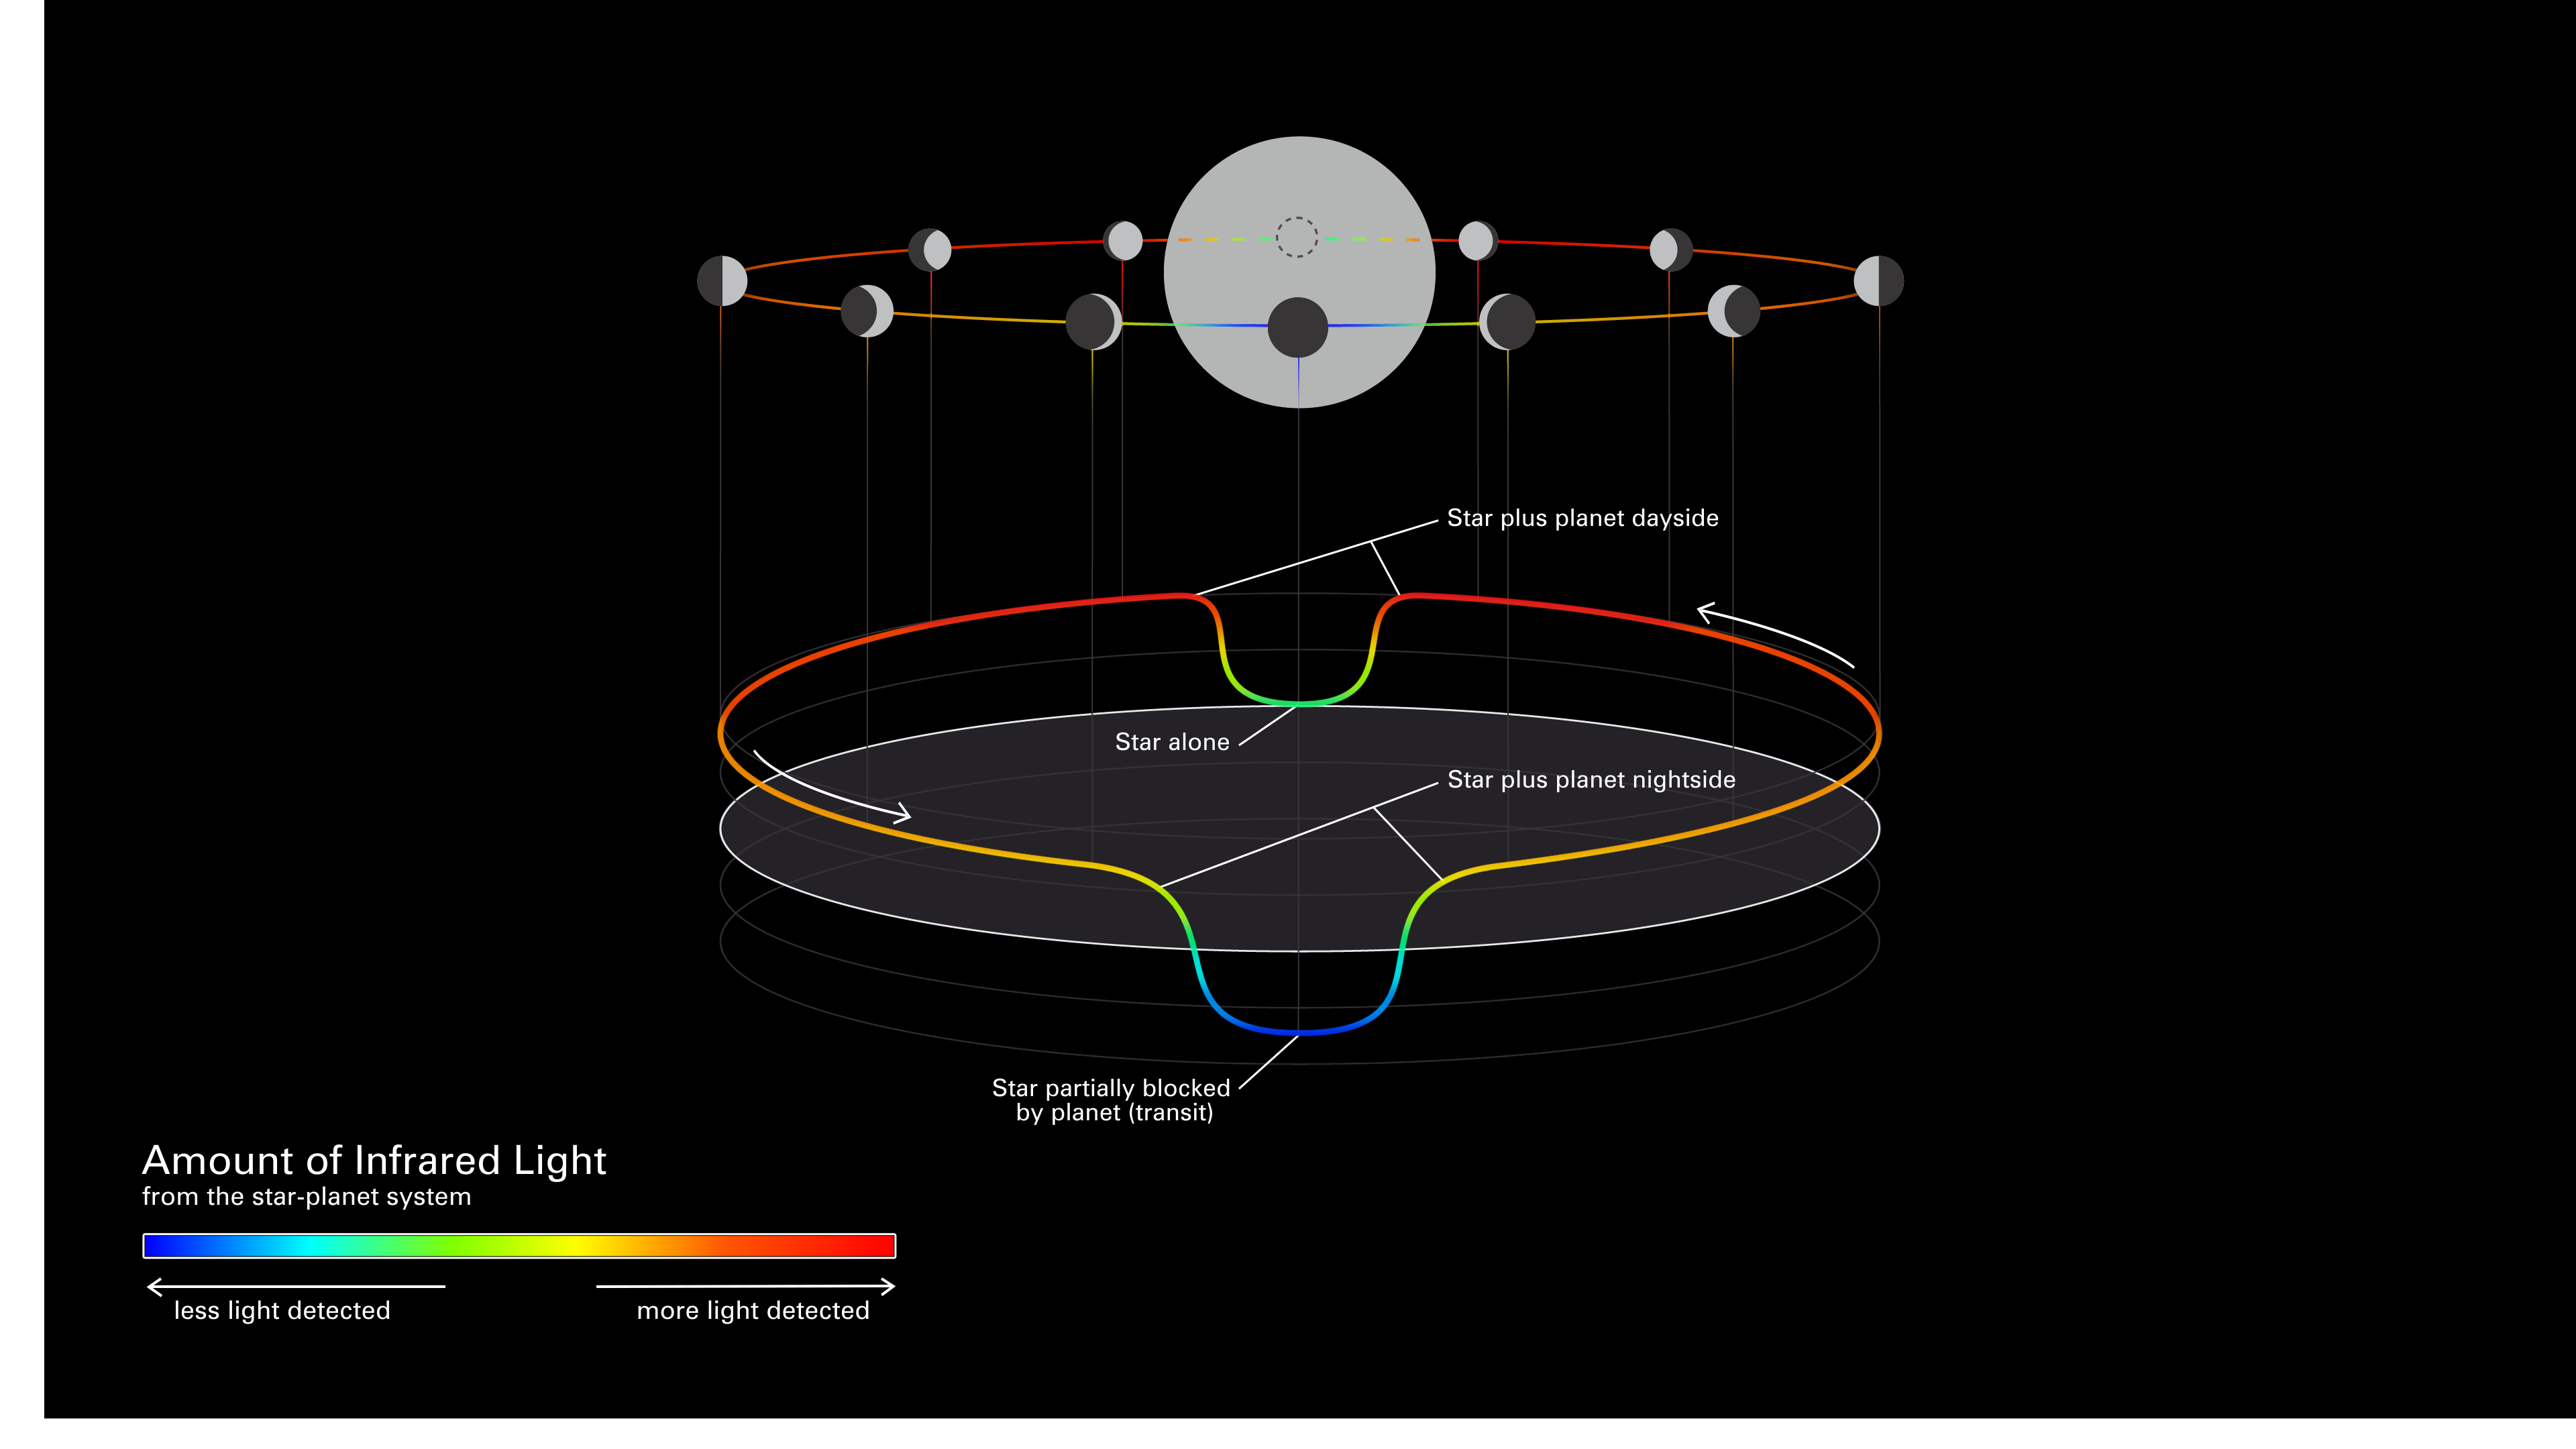
Diagram of an Exoplanet Phase Curve
This simplified diagram of an exoplanet phase curve shows the change in total brightness of a star–planet system as the planet orbits the star. The system looks brighter when more of the lit side of the planet is facing the telescope (full phase), and dimmer when more of the...
Share
Details
Laura Betz
NASA’s Goddard Space Flight Center
Greenbelt, Maryland
laura.e.betz@nasa.gov
NASA, ESA, CSA, Dani Player (STScI)
Eliza Kempton (UMD)


