


![Request for Information – Potential [Placeholder for Prize]](https://assets.science.nasa.gov/dynamicimage/assets/science/psd/solar/2023/09/s/solarsystem_0.jpg?w=1024)


1 min read
Super-Earth Exoplanet TOI-561 b (NIRSpec Emission Spectrum)
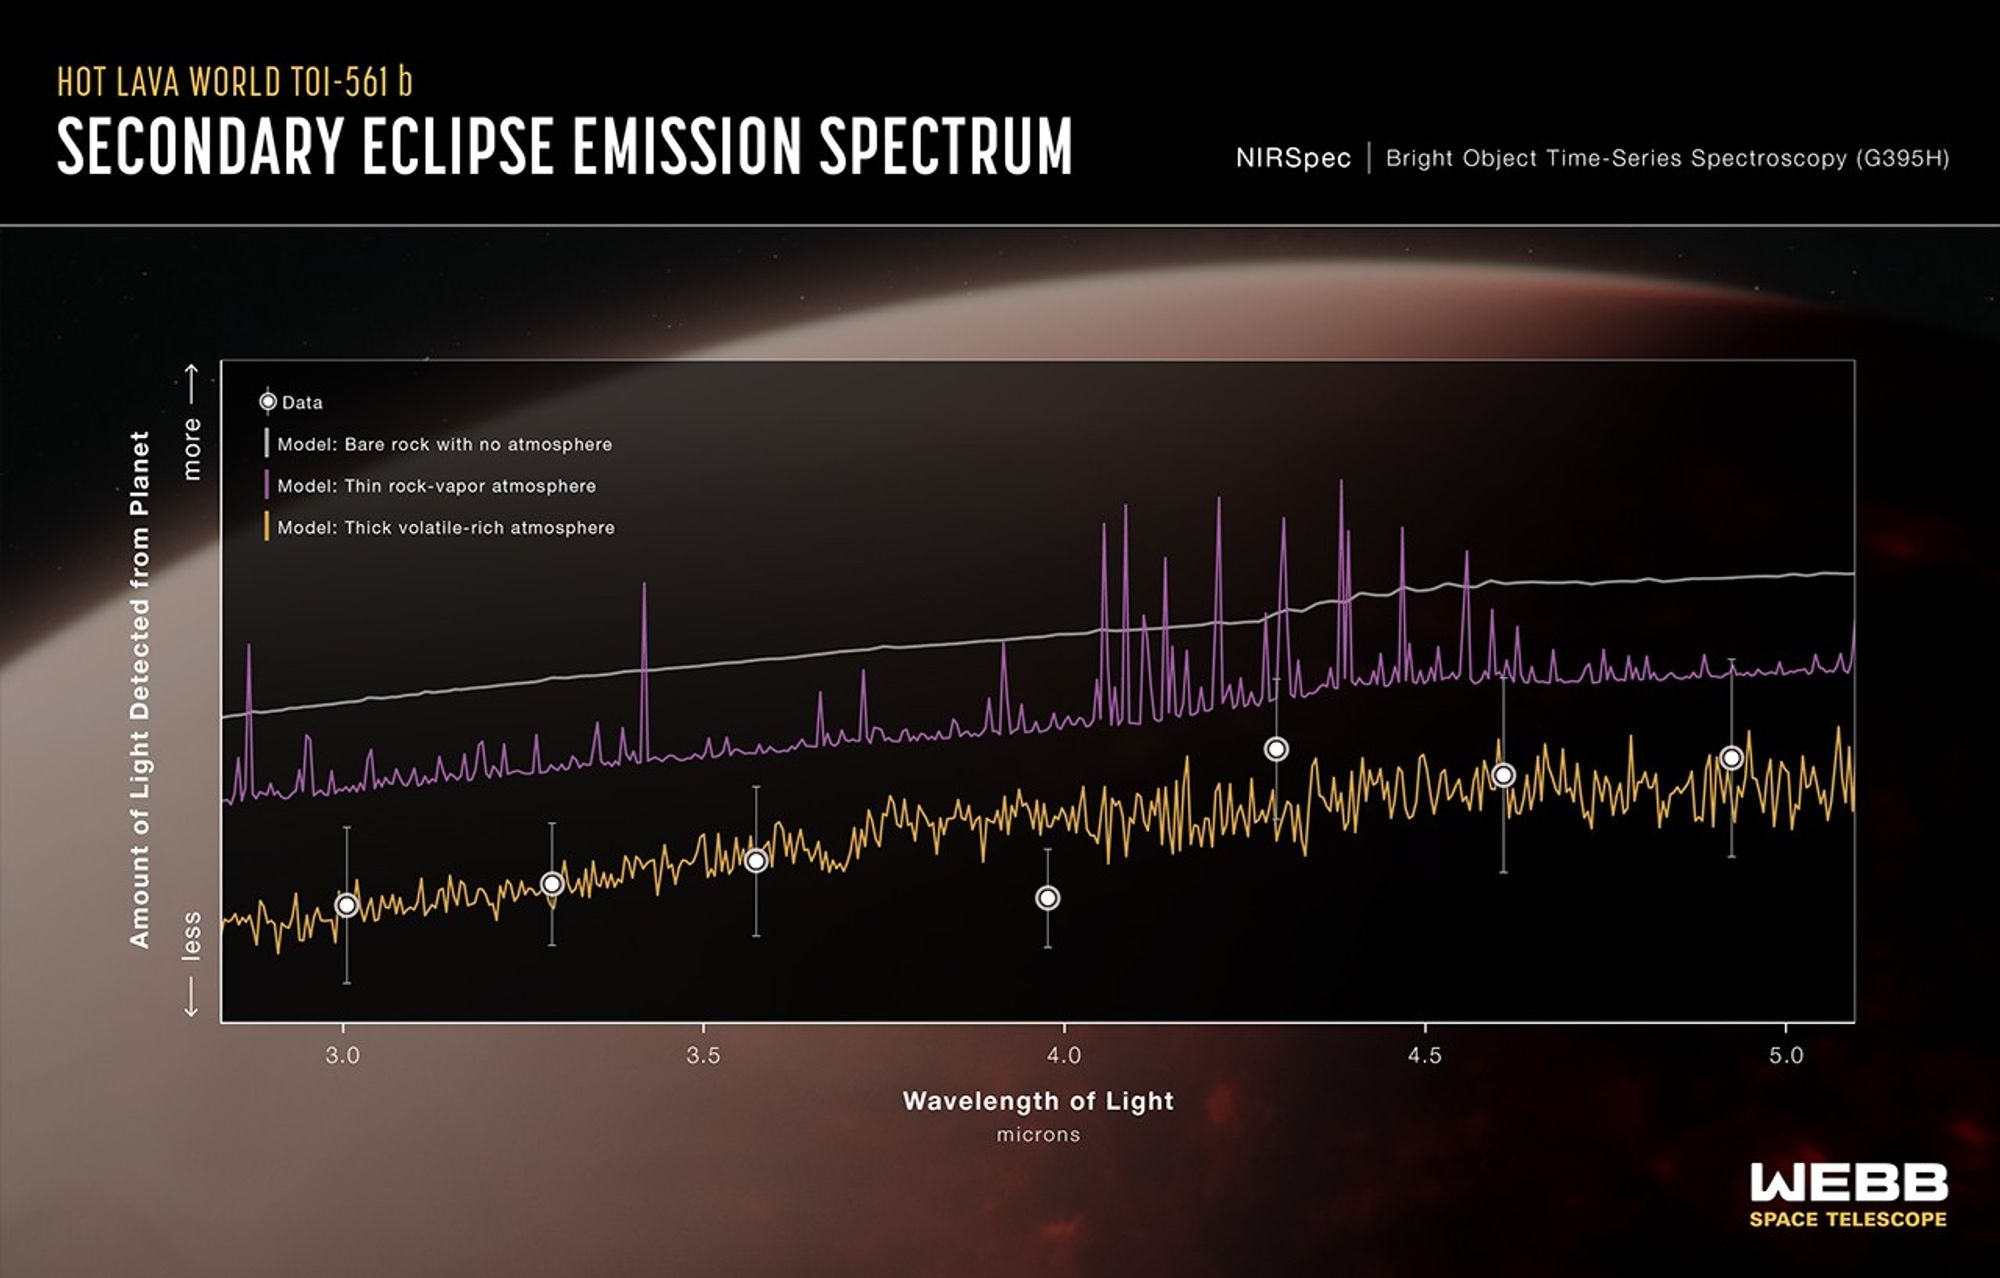
An emission spectrum captured by NIRSpec (the Near-Infrared Spectrograph) on NASA’s James Webb Space Telescope in May 2024 shows the brightness of different wavelengths of 3- to 5-micron light coming from the ultra-hot super-Earth exoplanet TOI-561 b. Comparisons of the data to theoretical models suggest that the planet is not a bare rock, but is instead surrounded by a volatile-rich atmosphere.
The data (white circles) are based on measurements of the change in brightness of the star-planet system before, during, and after the secondary eclipse, when the planet moves behind the star. Although TOI-561 b is too close to the star to see on its own, the amount of light coming from the planet can be calculated by subtracting the brightness of the star (measured when the planet is behind the star) from the brightness of the planet and star combined (measured when the planet is beside the star). TOI-561 b is thought to be tidally locked, which means that most of the planetary light measured during this observation is coming from the dayside.
Three model spectra are shown for comparison. If TOI-561 b has a dark bare-rock surface with no atmosphere (smooth gray line), or a thin rock-vapor atmosphere (jagged purple line), the dayside of the planet should appear significantly brighter than it actually does. Instead, the data are much more consistent with an atmosphere rich in volatiles like water, oxygen, and carbon dioxide. (The model shown here assumes an atmosphere that is 100% water vapor.)
A thick volatile-rich atmosphere absorbs some of the near-infrared light emitted by the surface, which reduces the amount that reaches the telescope. This makes the planet appear dimmer than it would with no atmosphere or a very thin layer or vaporized rock. A thick atmosphere also acts to distribute heat around the planet via winds, cooling the dayside and heating the nightside.
Webb observed the TOI-561 system continuously for more than 37 hours, capturing nearly four full orbits, including four consecutive secondary eclipses.
Explore this observation on NASA’s Space Telescope Live.
Extended Description and Image Alt Text
Extended Description
Infographic titled “Hot Lava World TOI-561 b: Secondary Eclipse Emission Spectrum; NIRSpec Bright Object time-Series Spectroscopy (G395H)” showing a graph of brightness versus wavelength, with one set of data and three model spectra. In the background is an artist’s concept of the planet showing a thick atmosphere over a partly molten surface.
The vertical y-axis is titled “Amount of Light Detected from Planet,” with the labels “less” pointing down and “more” pointing up. There are tick marks but no numbers or units. The horizontal x-axis titled “Wavelength of Light: microns” ranges from 2.7 microns at the origin on the left to 5.1 microns at the right, labeled in even increments of 0.5 microns, starting at 3.0.
A key in the upper left of the graph shows that data are plotted as solid white circles; a model assuming bare rock with no atmosphere is plotted as a solid gray line; a model assuming a thin rock-vapor atmosphere is plotted in purple; and a model assuming a thick volatile-rich atmosphere is in yellow.
The gray bare rock model is very smooth, showing a gradual increase in brightness from 2.7 to 5.1 microns, and no sharp peaks or valleys. Of the three models shown, it is plotted highest on the graph (most amount of light detected from the planet).
The purple rock-vapor atmosphere model plots below the bare rock model, following the same general trend of increasing brightness from 2.9 to 5.1 microns. However, it is much more jagged, with numerous sharp peaks, some of which are higher than the bare rock model.
The yellow volatile-rich atmosphere model plots below the other two (least amount of light detected from the planet). It follows the same general trend, with numerous peaks and valleys, but none as sharp and tall as those in the rock-vapor model.
There are 7 data points with vertical error bars. All 7 points plot in the lower half of the graph, on or very close to the yellow volatile-rich atmosphere model line (least amount of light detected). The data points at 3.0, 3.3, 3.6, 4.3, and 4.9 microns plot right on the line. The point at 4.0 microns plots slightly lower than the volatile-rich atmosphere model, and the point at 4.6 microns plots slightly higher .
Image Alt Text
Infographic titled “Hot Lava World TOI-561 b: Secondary Eclipse Emission Spectrum; NIRSpec Bright Object time-Series Spectroscopy (G395H)” showing a graph of brightness versus wavelength, with one set of data and three model spectra.
About the Object
- R.A. PositionR.A. PositionRight ascension – analogous to longitude – is one component of an object's position.09h52m44.44s
- Dec. PositionDec. PositionDeclination – analogous to latitude – is one component of an object's position.+06d12m57.97s
- ConstellationConstellationOne of 88 recognized regions of the celestial sphere in which the object appears.Sextans
- DistanceDistanceThe physical distance from Earth to the astronomical object. Distances within our solar system are usually measured in Astronomical Units (AU). Distances between stars are usually measured in light-years. Interstellar distances can also be measured in parsecs.280 light-years
About the Data
- Data DescriptionData DescriptionProposal: A description of the observations, their scientific justification, and the links to the data available in the science archive.
Science Team: The astronomers who planned the observations and analyzed the data. "PI" refers to the Principal Investigator.Secondary eclipse emission spectrum (3-5 microns)
- InstrumentInstrumentThe science instrument used to produce the data.NIRSpec
- Exposure DatesExposure DatesThe date(s) that the telescope made its observations and the total exposure time.May 1 - May 3, 2024
- FiltersFiltersThe camera filters that were used in the science observations.G395H
- Object NameObject NameA name or catalog number that astronomers use to identify an astronomical object.TOI-561 b
- Object DescriptionObject DescriptionThe type of astronomical object.Super-Earth exoplanet
- Release DateDecember 11, 2025
- Science ReleaseNASA’s Webb Detects Thick Atmosphere Around Broiling Lava World
- CreditIllustration: NASA, ESA, CSA, Ralf Crawford (STScI); Science: Johanna Teske (Carnegie Science Earth and Planets Laboratory), Anjali Piette (University of Birmingham), Tim Lichtenberg (Groningen), Nicole Wallack (Carnegie Science Earth and Planets Laboratory)
Related Images & Videos

Super-Earth Exoplanet TOI-561 b and Its Star (Artist's Concept)
This artist’s concept shows what the hot super-Earth exoplanet TOI-561 b and its star could look like based on observations from NASA’s James Webb Space Telescope and other observatories. Webb data suggests that the planet is surrounded by a thick atmosphere above a magma ocean.
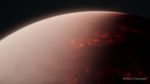
Super-Earth Exoplanet TOI-561 b (Artist's Concept)
An artist’s concept shows what a thick atmosphere above a vast magma ocean on exoplanet TOI-561 b could look like. Measurements captured by NASA's James Webb Space Telescope suggest that in spite of the intense radiation it receives from its star, TOI-561 b is not a bare rock.
Share
Details
Laura Betz
NASA’s Goddard Space Flight Center
Greenbelt, Maryland
laura.e.betz@nasa.gov


