


1 min read
Warm Gas-Giant Exoplanet WASP-107 b Transmission Spectrum (NIRSpec)
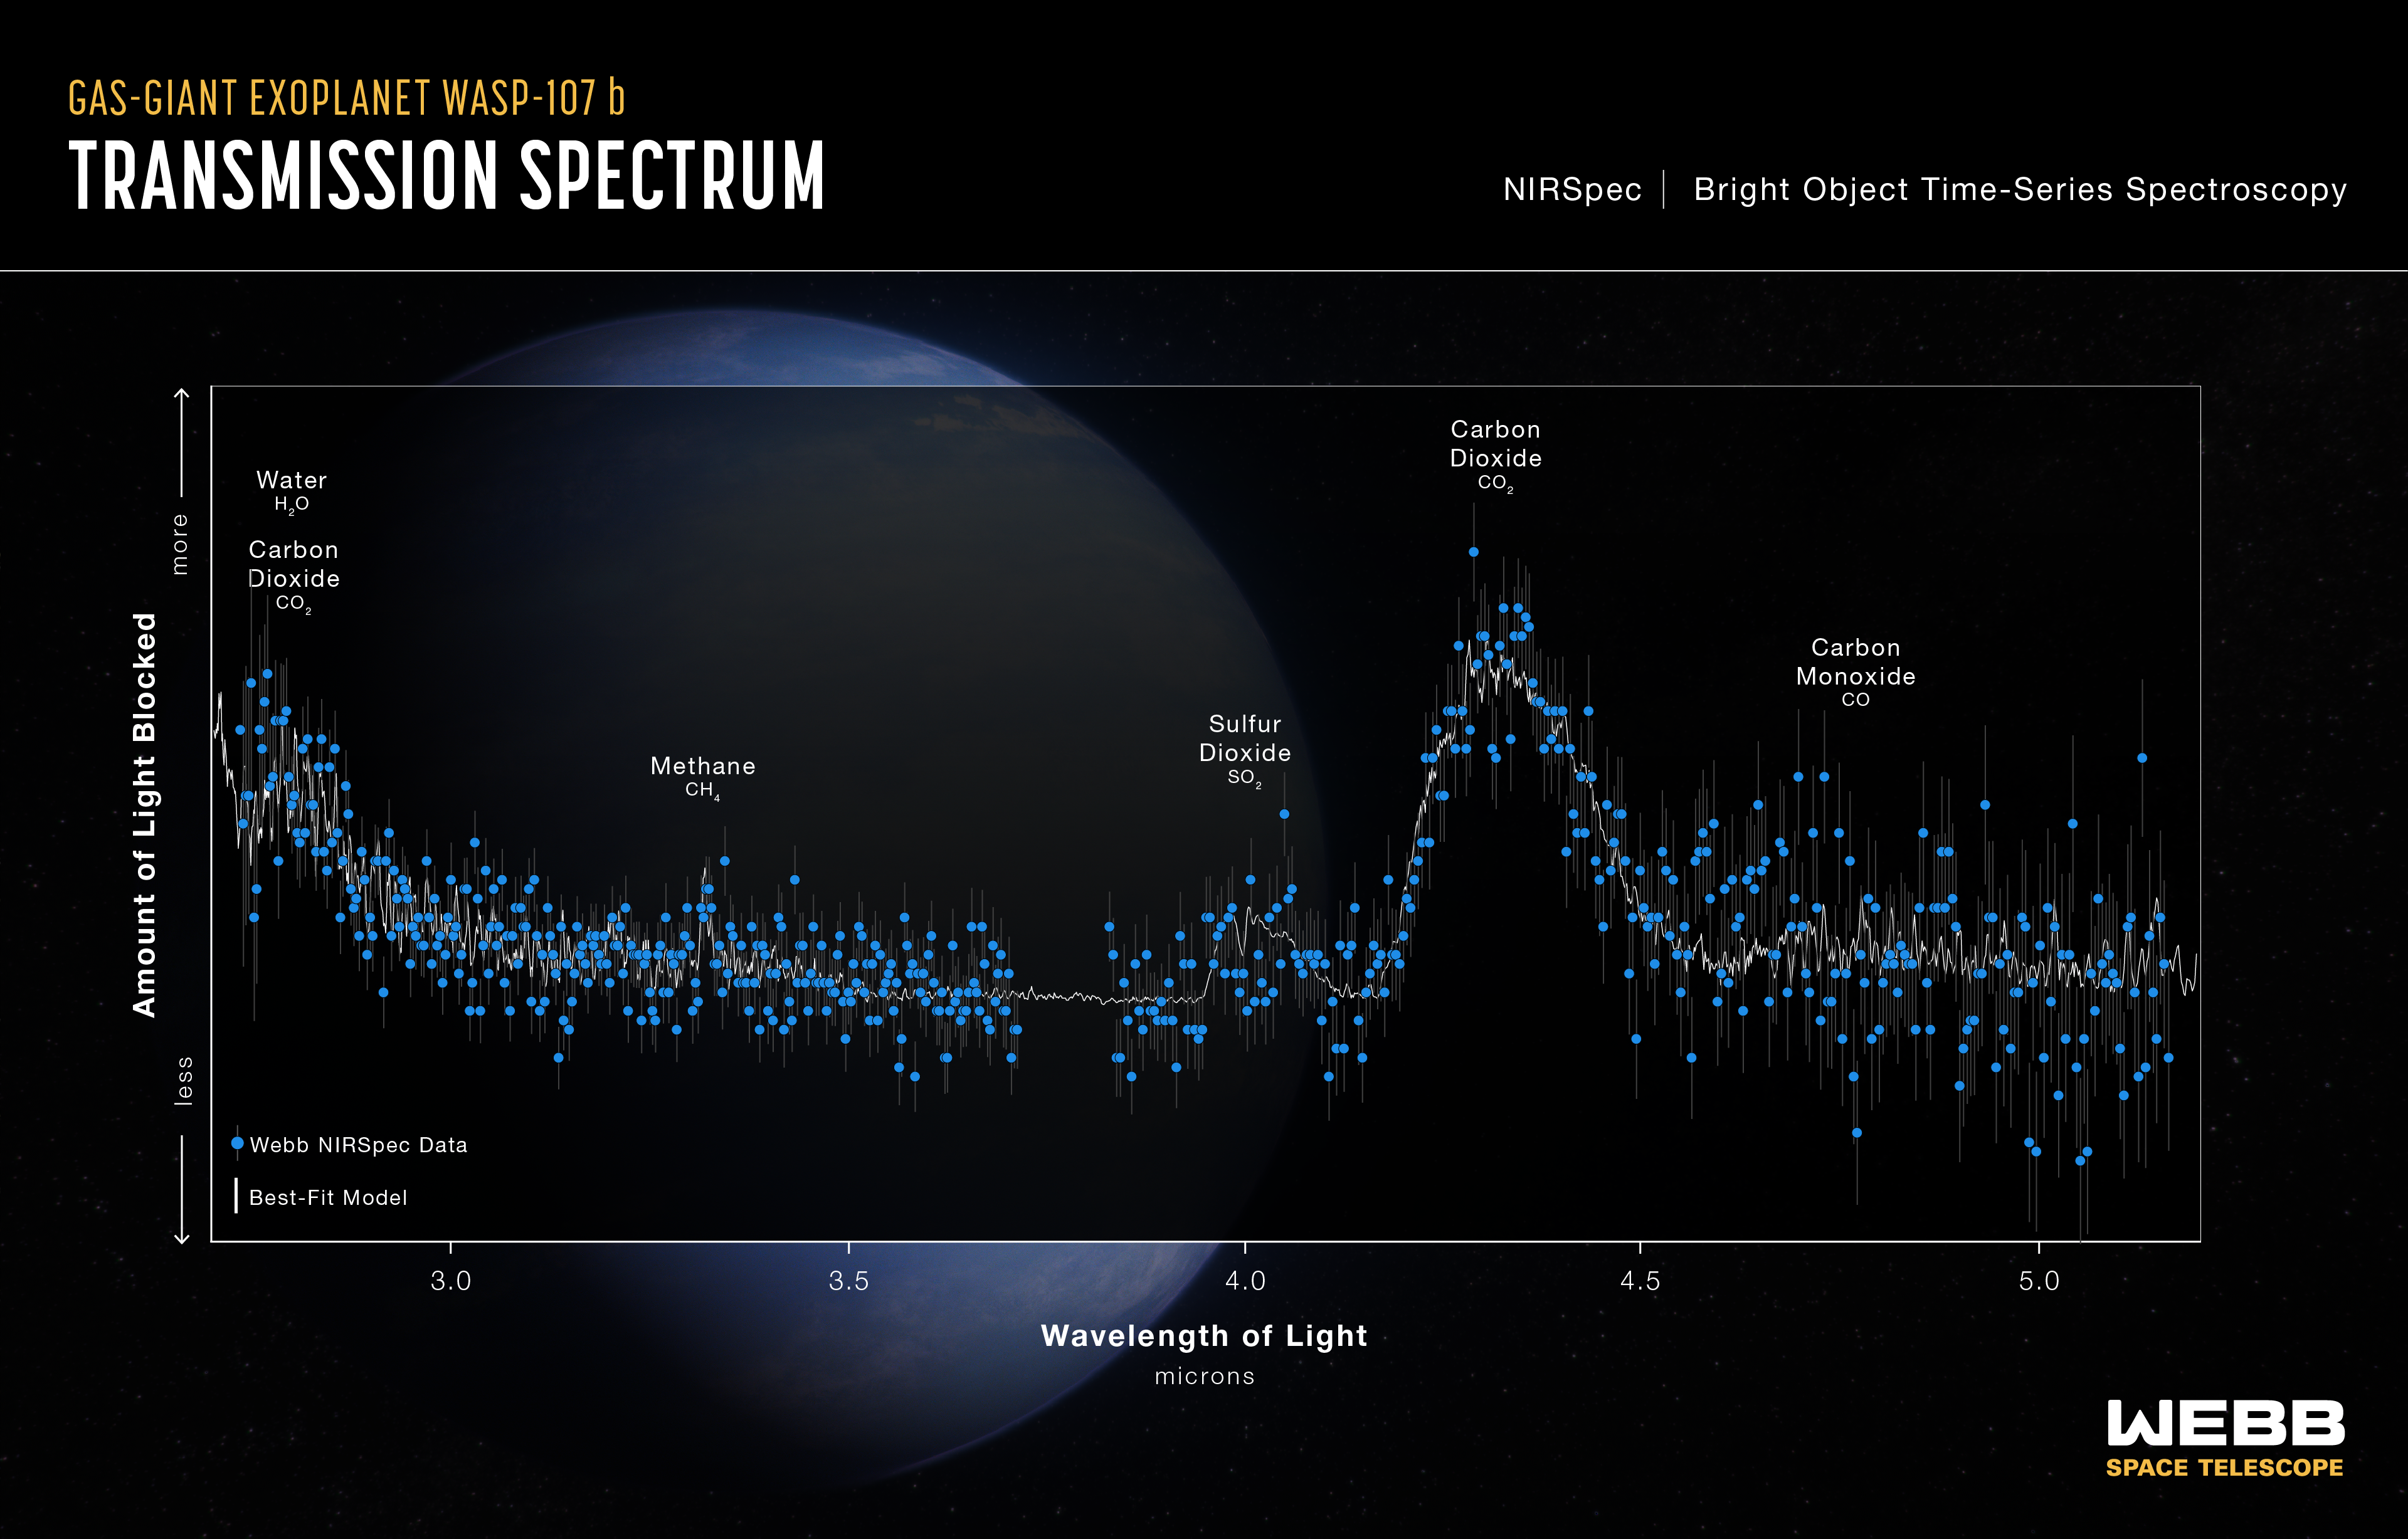
This transmission spectrum, captured using Webb’s NIRSpec (Near-Infrared Spectrograph), shows the amounts of different wavelengths (colors) of near-infrared starlight blocked by the atmosphere of the gas-giant exoplanet WASP-107 b.
The spectrum was made by observing the planet-star system for about 8.5 hours before, during, and after the transit as the planet moved across the face of the star.
By comparing the brightness of light filtered through the planet’s atmosphere (transmitted light) to unfiltered starlight, it is possible to calculate the amount of each wavelength that is blocked by the atmosphere. Since each molecule absorbs a unique combination of wavelengths, the transmission spectrum can be used to constrain the abundance of various gases.
This spectrum shows clear evidence for water (H2O), carbon dioxide (CO2), carbon monoxide (CO), methane (CH4), and sulfur dioxide (SO2) in the planet’s atmosphere, allowing researchers to estimate the interior temperature and mass of the core.
Extended Description and Image Alt Text
Extended Description
Graphic titled “Hot Gas-Giant Exoplanet WASP-107 b Transmission Spectrum: NIRSpec Bright Object Time-Series Spectroscopy” showing one sets of data point with error bars and a best-fit model on a graph of Amount of Light Blocked on the y-axis versus Wavelength of Light in microns on the x-axis. In the background is an illustration of a blue planet with wispy white clouds.
Axes
The y-axis ranges from less light blocked on the bottom to more light blocked at the top, with no values, units, or tick marks. The x-axis ranges from 2.7 on the left to 5.2 on the right, labeled in even increments of 0.5 microns, starting at 3.0.
Data, Model, and Labels
There is one set of 576 NIRSpec data points plotted as solid blue circles with gray vertical error bars. The data span from 2.7 to 5.2, with a gap between about 3.7 and 3.8.
A best-fit model is shown as a jagged gray line with a number of broad peaks and valleys.
The following features are labeled, from left to right:
- A large broad peak centered around 2.75 microns is labeled Water H2O and Carbon Dioxide CO2.
- A short and narrow peak at 3.3 microns is labeled Methane CH4.
- A short peak at 4 microns is labeled Sulfur Dioxide SO2.
- A tall, broad peak centered around 4.3 microns is labeled Carbon Dioxide CO2
- A shorter peak around 4.75 microns is labeled Carbon Monoxide CO.
Image Alt Text
Graphic titled “Hot Gas-Giant Exoplanet WASP-107 b Transmission Spectrum: NIRSpec Bright Object Time-Series Spectroscopy” showing a graph of Amount of Light Blocked vs. Wavelength of Light, with peaks for water, carbon dioxide, methane, sulfur dioxide, and carbon monoxide labeled.
About the Object
- R.A. PositionR.A. PositionRight ascension – analogous to longitude – is one component of an object's position.12h33m32.74s
- Dec. PositionDec. PositionDeclination – analogous to latitude – is one component of an object's position.-10d08m46.37s
- ConstellationConstellationOne of 88 recognized regions of the celestial sphere in which the object appears.Virgo
- DistanceDistanceThe physical distance from Earth to the astronomical object. Distances within our solar system are usually measured in Astronomical Units (AU). Distances between stars are usually measured in light-years. Interstellar distances can also be measured in parsecs.210 light-years
About the Data
- Data DescriptionData DescriptionProposal: A description of the observations, their scientific justification, and the links to the data available in the science archive.
Science Team: The astronomers who planned the observations and analyzed the data. "PI" refers to the Principal Investigator.NIRSpec Bright-Object Time Series Spectroscopy
- InstrumentInstrumentThe science instrument used to produce the data.NIRSpec
- Exposure DatesExposure DatesThe date(s) that the telescope made its observations and the total exposure time.June 23, 2023
- Object NameObject NameA name or catalog number that astronomers use to identify an astronomical object.WASP-107 b
- Object DescriptionObject DescriptionThe type of astronomical object.Warm Neptune Exoplanet
- Release DateMay 20, 2024
- Science ReleaseWebb Cracks Case of Inflated Exoplanet
- CreditIllustration: NASA, ESA, CSA, Ralf Crawford (STScI); Science: NIRSpec GTO Transiting Exoplanet Team, David Sing (JHU)
Related Images & Videos
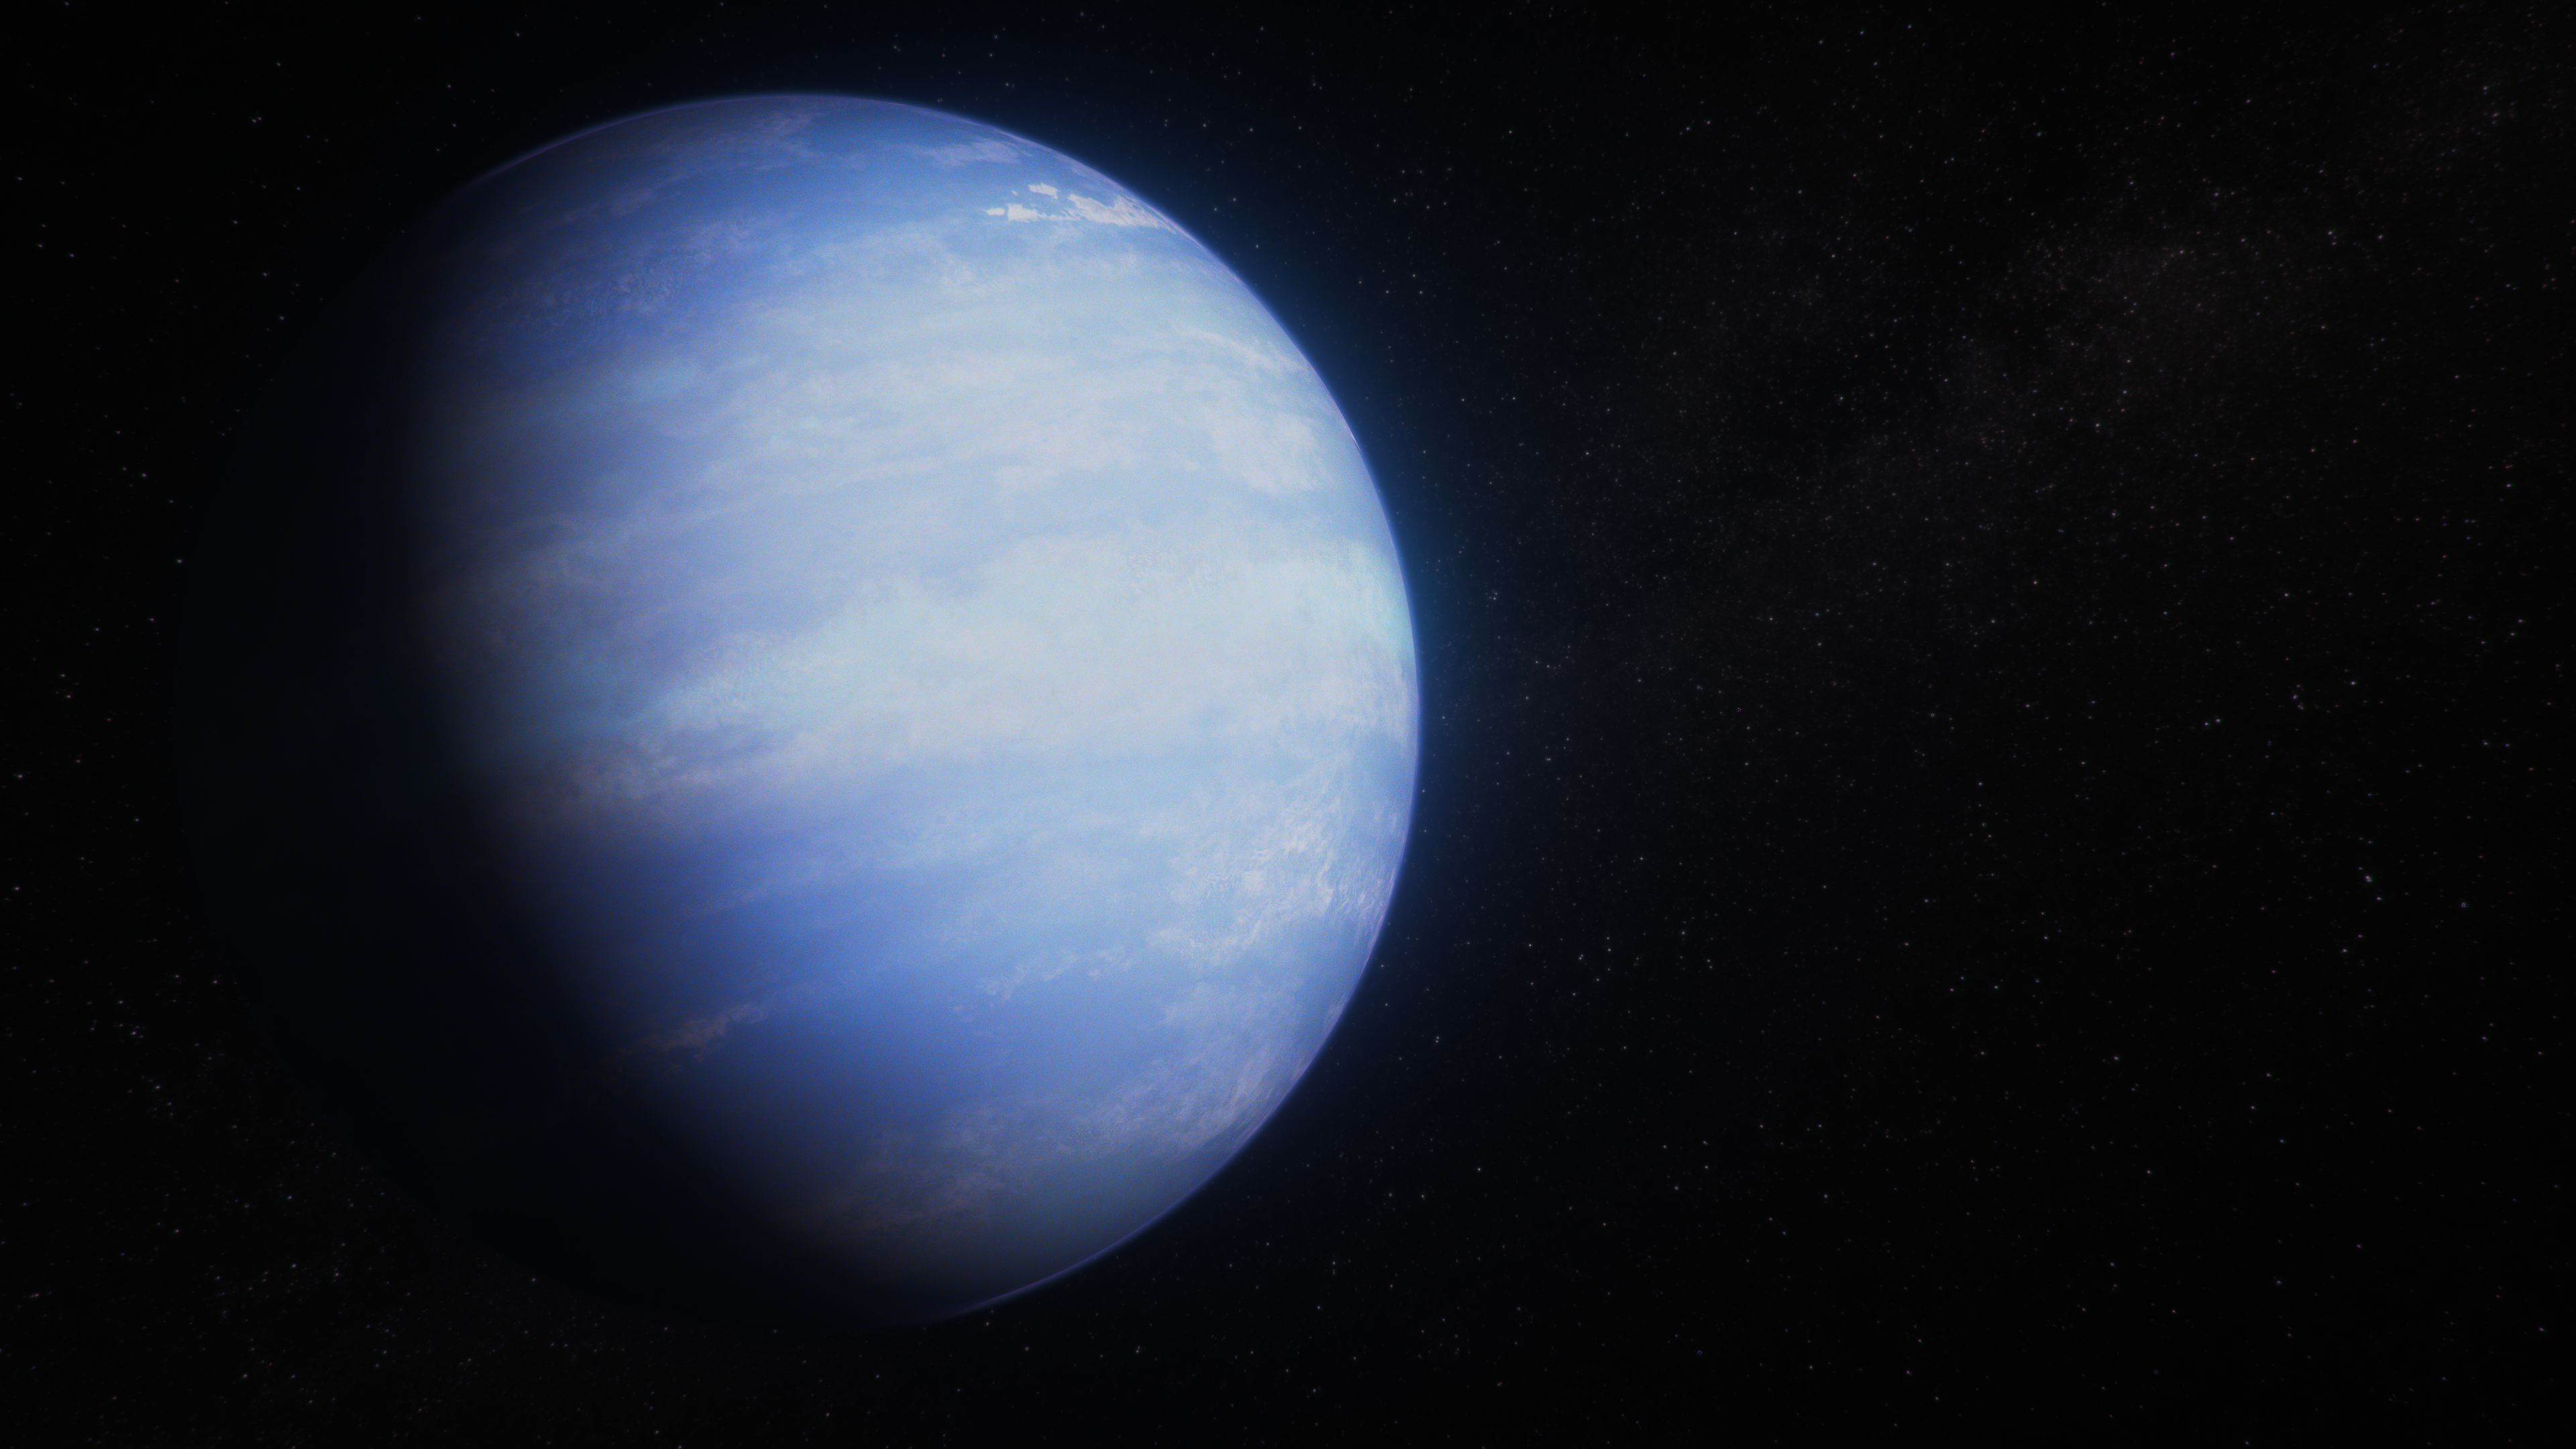
Warm Gas-Giant Exoplanet WASP-107 b (Artist's Concept)
This artist’s concept shows what the exoplanet WASP-107 b could look like based on recent data gathered by NASA’s James Webb Space Telescope, along with previous observations from Hubble and other space- and ground-based telescopes. WASP-107 b is a “warm Neptune” exoplanet...
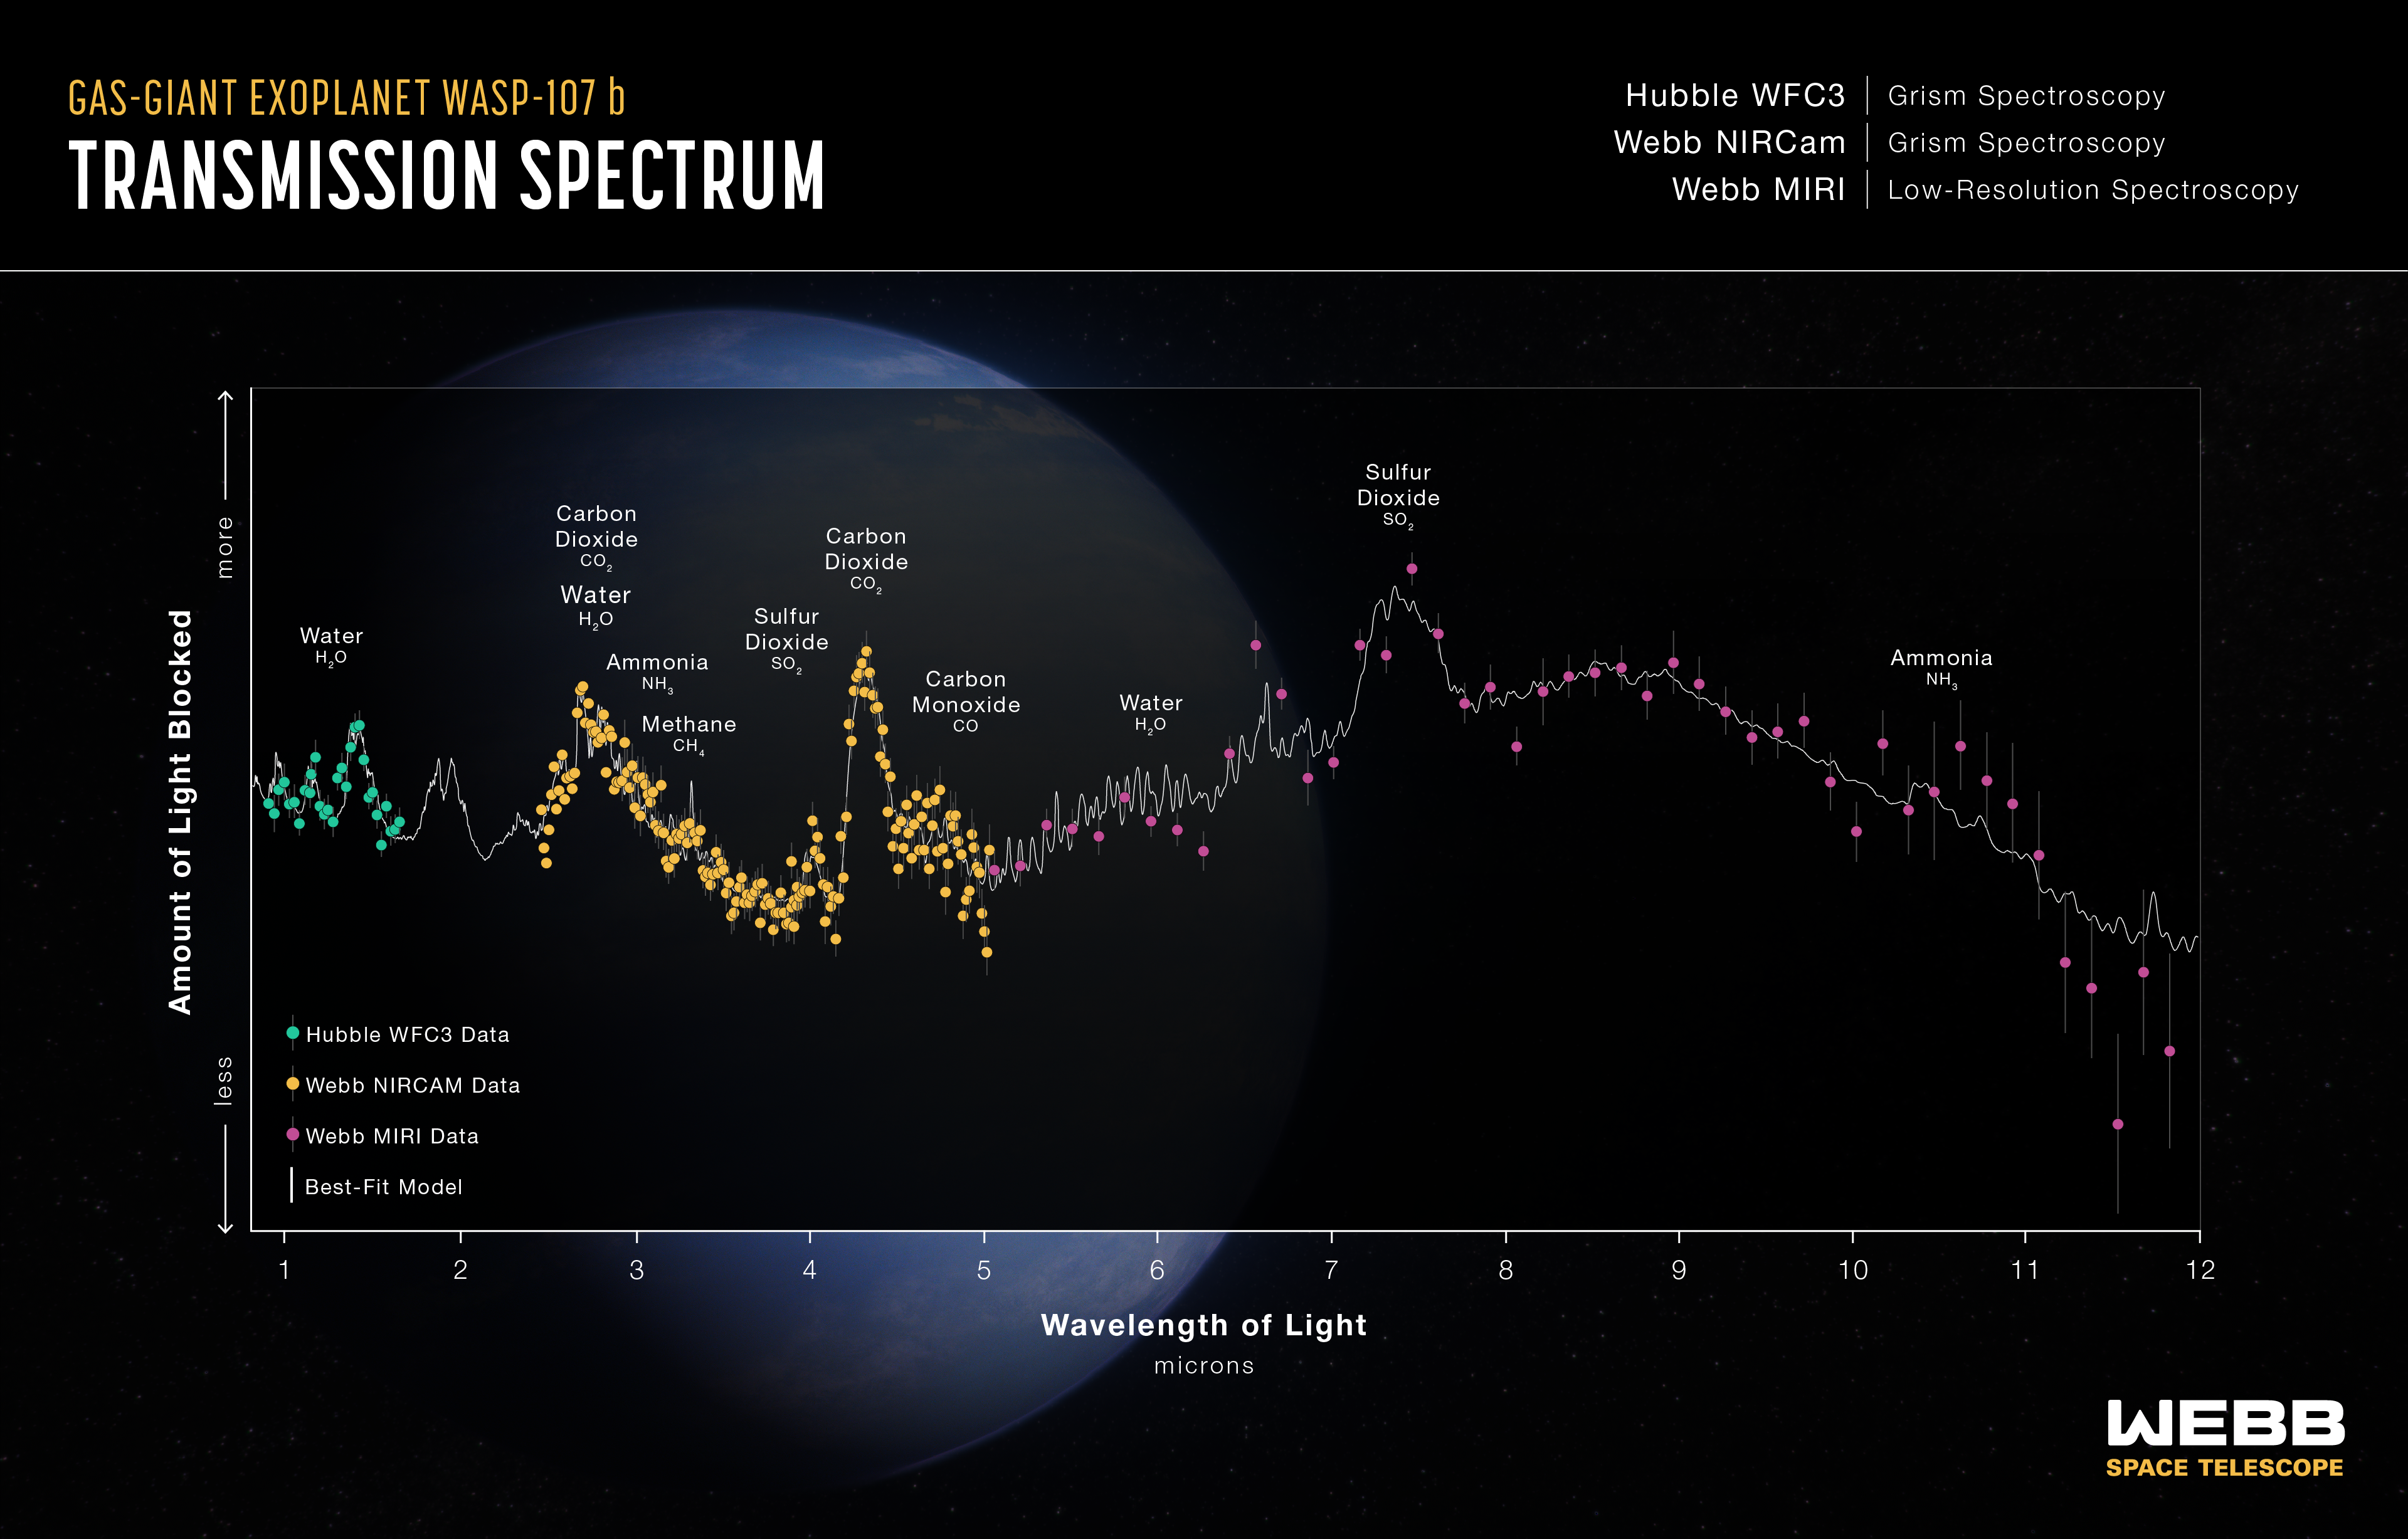
Warm Gas-Giant Exoplanet WASP-107 b Transmission Spectrum (Hubble WFC3, Webb NIRCam, Webb MIRI)
This transmission spectrum, captured using NASA’s Hubble and James Webb space telescopes, shows the amounts of different wavelengths (colors) of starlight blocked by the atmosphere of the gas-giant exoplanet WASP-107 b . The spectrum includes light collected over five separate...
Share
Details
Laura Betz
NASA’s Goddard Space Flight Center
Greenbelt, Maryland
laura.e.betz@nasa.gov
NASA, ESA, CSA, Ralf Crawford (STScI)
NIRSpec GTO Transiting Exoplanet Team, David Sing (JHU)


