A NASA-funded study uses temperature and vegetation data fromsatellites to help track and predict where West Nile virus is spreadingin North America. Scientists and public health officials hope one day touse near real-time maps to focus resources and stave off the diseasemore efficiently.
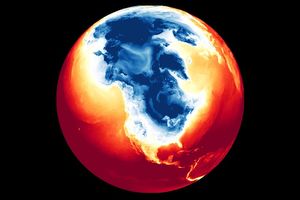
This image is a composite of land surface temperatures (LST) recorded between 1997 and2000 and was used to help monitor and predict the spread of West Nile virus inthe United States.
In the color figure above, the mean land surface temperatures are in red;annual amplitude—or the difference between low and high annualtemperatures—is in blue; and annual phase—or the timing of annualtemperature peaks—appears in green. Brighter colors mean higher values.The major north-south temperature difference (dull red in the upper partof the image to bright red in the lower part) is considerably affectedby the Rockies in the west and to a much lesser extent by theAppalachians in the east. The brighter blue in the upper part of theimage indicates the big difference between highest and lowesttemperatures during the course of a year at higher latitudes.There is less variation in the timing of the annualpeak of land surface temperatures, which occurs earlier in the south than in the north.
Black dots superimposed on this image are the locations (countygeo-centers) where birds infected with West Nile virus were reportedbetween January and October 2001.
Scientists working with the International Research Partnership forInfectious Diseases (INTREPID) program based at NASA are using suchimagery to define and predict the conditions where mosquitoes transmitWest Nile virus in the U.S.
The conclusion reached about the importance of any single variable depends both uponits value and context. A temperature of 30°Celsius (86° Fahrenheit) might be fatal for a mosquito at low humiditybut survivable at higher humidities. The work done here on West Nilevirus and other diseases shows very clearly that it is a uniquecombination of temperature, humidity, and vegetation variables that tendsto determine mosquito and disease presence and abundance.
For more information read: Satellites vs. Mosquitoes: Tracking West Nile Virus in the U.S.
References & Resources
The image was produced by INTREPID from data taken by the National Oceanic and Atmospheric Administration’s (NOAA) Advanced Very High Resolution Radiometer (AVHRR) instrument.