


Earth scientists who work with satellite data often fall into one of two categories. Some are driven by questions that can only be answered by viewing Earth on the planetary scale. How fast are people clearing tropical forests? Is the Earth more or less cloudy today than it was 20 years ago? For these scientists, satellite data are stepping stones.
In the second category are scientists who are driven to invent—the technophiles, the space junkies. For these scientists, the thrill is in figuring out how to observe things from space that no one has been able to observe before. Perfecting the picture of Earth that satellites provide is an end in itself.
Tropical climatologist Rong Fu, of Georgia Institute of Technology, is more of the former. Remote-sensing scientist Ranga Myneni, of Boston University, is more of the latter. Fu’s research group is trying to understand what causes the length and timing of the rainy season in South America to change from year to year. Myneni’s makes global estimates of leaf area from data collected by NASA’s Terra and Aqua satellites.

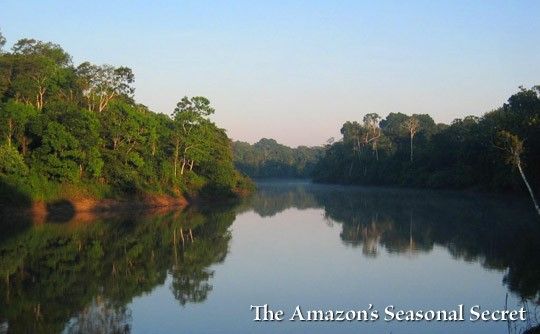
In 2005, the attention of these two scientists and numerous collaborators converged on a project to look for seasonal patterns in the amount of leaf area in the Amazon Rainforest. Their efforts revealed a previously unknown connection between the rainforest and the rain. Despite the evergreen nature of the forest, the team found, the Amazon’s trees and plants have an unmistakable seasonal side. Seasonal swings in the leaf area of the forest not only help make the case that light, rather than water, really limits plant growth in the tropics, but they also provide evidence that the link between the forest and the climate of the Amazon is even more intimate than scientists once supposed. In the Amazon, it seems, it’s not just the rain that makes a rainforest; the rainforest makes it rain.
A series of surprises
For nearly a decade, Ranga Myneni has been leading a team of scientists who were developing and fine-tuning the step-by-step, problem-solving calculations that translate satellite observations of light reflected from Earth’s surface into measurements of how many layers of leaves are within a satellite sensor’s field of view.
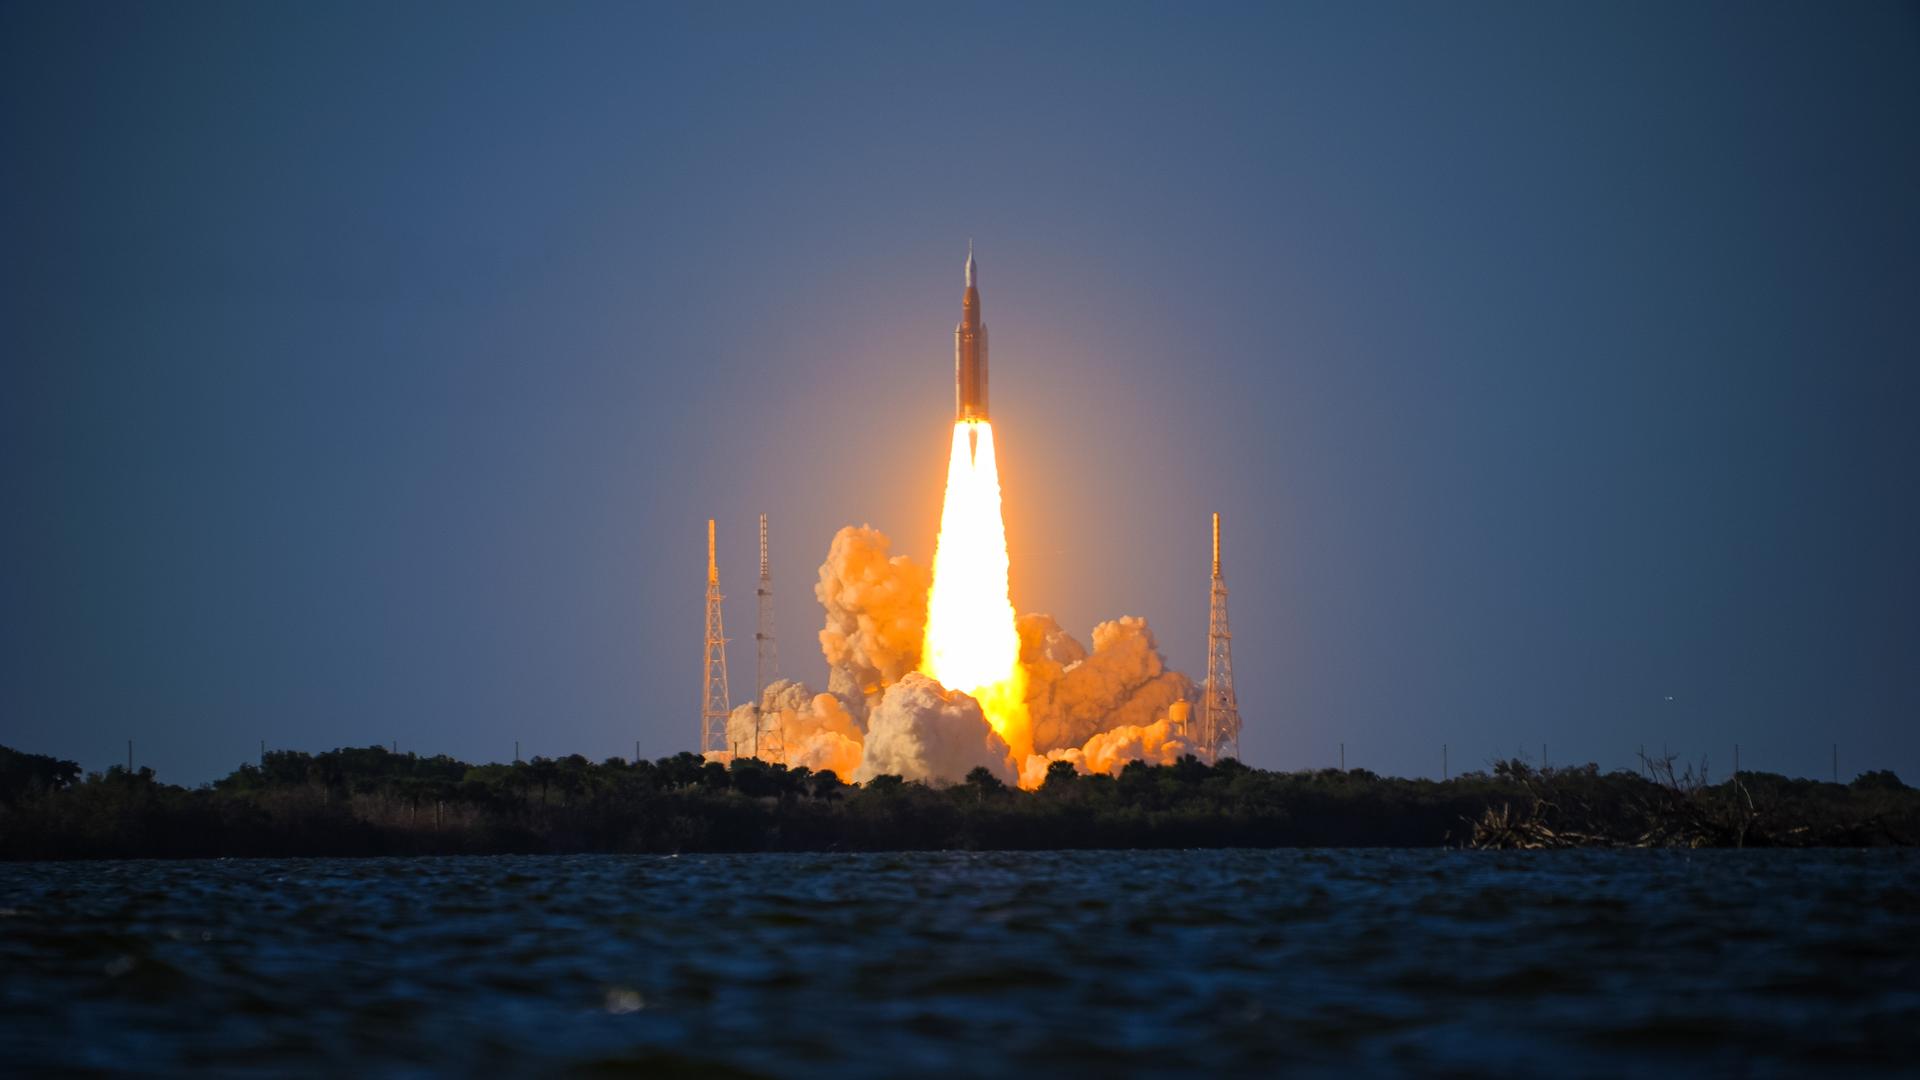
A plant’s leaves are the gatekeepers of the exchange of carbon dioxide and oxygen, energy, and water vapor between vegetation and the atmosphere; leaf surface area plays a critical role in carbon, water, and climate cycles on local and global scales. Before NASA’s launch of the Terra satellite in 1999 with an onboard sensor called MODIS (short for Moderate Resolution Imaging Spectroradiometer), no one had ever tried to measure leaf area on a global scale from space.
For Myneni, the Amazon project was sort of a maiden voyage for the leaf area product—a chance to really test the performance of a product to which he had devoted the past eight years of his life. But the choice to look for seasonal changes in Amazon leaf area wasn’t random. Myneni describes it as part of a continuing story, one with a series of surprises. The backdrop of the story is the Amazon rainfall cycle.
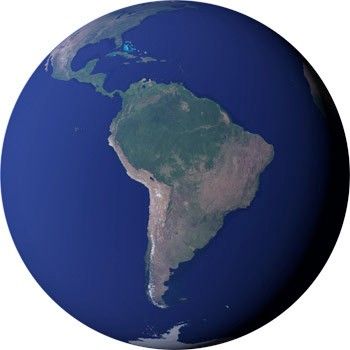
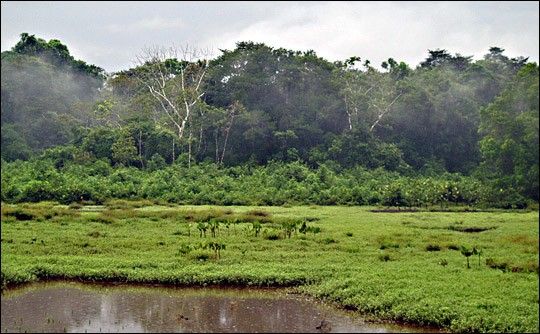
Contrary to many people’s imagination, in most parts of the rainforest, it doesn’t actually rain all year long. Rong Fu describes how variable the rain in the Amazon Rainforest really is. “To the north of the equator, the rainy season is in the summer—June, July, August,” she says. “But the majority of the Amazon is south of the equator, and over these areas, the rainy season starts somewhere around October or November and ends somewhere between March and April, sometimes May.” There are east-west differences as well. In the west, the dry season may only last one to three months, while in the east and southeast, it may last five, or even seven months. The forest stays evergreen because many trees extend roots several meters into the soil, and they redistribute the water stored deep underground to places where the soil is dry.

Against this backdrop of regular seasonal droughts, scientists originally thought that plant and tree growth would slow down in the dry season. But in the mid-1990s, people began building research towers that reached as high as the forest canopy. When they measured the flow of carbon dioxide into and out of the forest from those towers, they got a surprise. “They reported seeing the ecosystem storing carbon during the dry season,” says Myneni. Either photosynthesis increased during the dry season, or processes that release carbon dioxide, like decay and respiration, decreased.
Because the idea of better growth during the dry season seemed counterintuitive, the leading explanation for the dry-season carbon surplus was not increased photosynthesis. Instead, says Myneni, scientists speculated that hot, dry conditions slowed respiration, the physiological “flip-side” of photosynthesis. When plants, microorganisms, and fungi respire—break down sugars and starches for energy—they release carbon dioxide. If soil respiration slowed down in the heat, the forest would have a net gain of carbon.
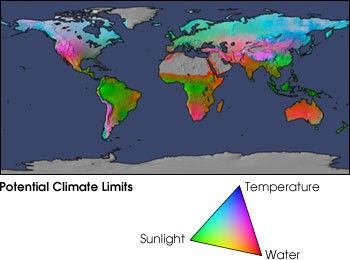
But over time, that explanation wasn’t able to account for all the evidence. In 2003, remote-sensing ecologist Rama Nemani of NASA’s Ames Research Center and seven other scientists, including Myneni, analyzed two decades of global satellite observations of clouds, sunlight, and vegetation. They found that while tropical cloudiness had declined, tropical vegetation had grown greener. These results suggested that tropical forest growth was limited not by dry-season water shortages, but by rainy season “sunlight shortages.”
Increasingly, the idea that rainforests might actually be more productive in the dry season gained traction. The thing that finally motivated Myneni to investigate whether the Amazon had a detectable seasonal pattern of leaf area was a 2006 paper by fellow MODIS teammate Alfredo Huete.
Huete used MODIS data to make maps of something remote-sensing scientists call greenness, a ratio of the relative amounts of red and near-infrared light that vegetation on the Earth’s surface reflects back to a satellite. Because plants absorb red (and other visible light) and reflect near-infrared light, a scale of vegetation greenness is a general indicator of the extent and density of vegetation within a satellite sensor’s field of view. With vegetation index maps, Huete showed that a majority of the Amazon was greener in the dry season than the wet.
Orchestrated Chaos
As Myneni and his colleagues began to read up on the subject of Amazon Rainforest ecology, they became aware of a paradox. Perhaps the most basic assumption about the rainforest is its evergreen nature, its lack of obvious seasonal change. “And yet, anytime people went in on the ground and looked specifically at when certain trees would flower, or bud, or when they put out leaves, they would always find some kind of seasonality,” Myneni explained. Still, the seasonal patterns of individual species apparently didn’t synch up to produce an obvious, forest-wide seasonal pattern. Given the conflicting evidence, the team wasn’t sure what they would discover.
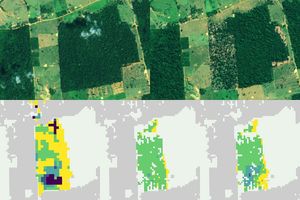
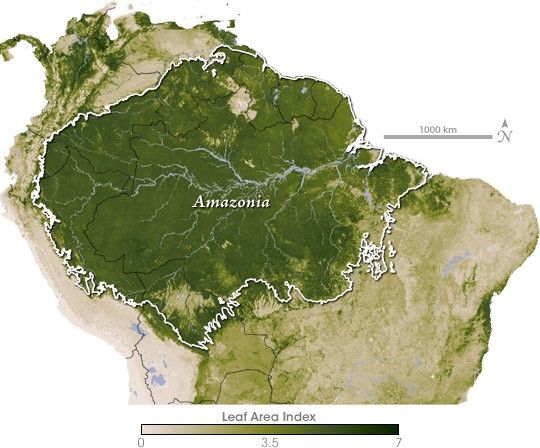
Myneni and his research team gathered leaf area data from the Terra MODIS sensor collected between 2000 and 2005. The data come in small squares called pixels; each pixel contains the 8-day average of the leaf area index of every square kilometer of the Amazon. (Leaf area index is the ratio of leaf surface area to ground surface area.) First Myneni averaged the 8-day data into monthly composites.
Then they tackled the problem of the Amazon’s incessant cloudiness. When computers at NASA’s Goddard Space Flight Center process MODIS data, special computer programs flag pixels that might be cloudy. Myneni wanted to be especially careful that the Amazon’s abundant wet-season clouds wouldn’t get in the way of an accurate leaf area measurements, so he took the 1-kilometer squares and grouped them into larger, 8-kilometer squares. To come up with a leaf area value for the big square, he selected and averaged only the pixels that the algorithm was confident were cloud-free.
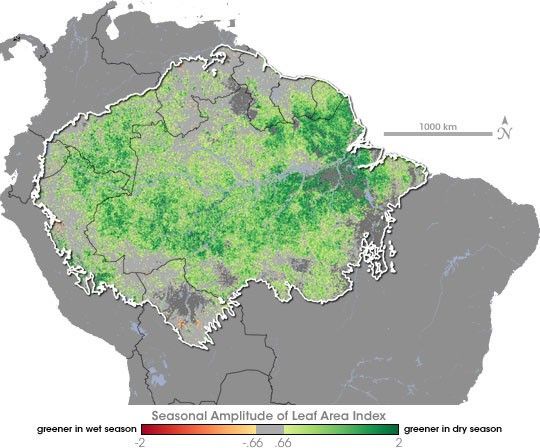
The team compared monthly leaf area amounts to estimates of incoming sunlight and rainfall (also based on satellite data). The majority of the rainforests had a clear seasonal cycle. A gradual crescendo in leaf area began just before the onset of the dry season and peaked a few months later. The peak dry-season leaf area was about 25 percent greater than the annual average. Once the wet season began, leaf area gradually declined.
To Myneni, one of the most interesting features of the trend is that it does not appear to be the sunlight itself that cues the trees to make new leaves. “They actually flush [grow new] leaves a little before the arrival of the dry season. It seems to be something in their genetic programming that allows them to anticipate the coming of the light-rich dry season, to prepare for enhanced photosynthesis.”
It might seem surprising that such a fundamental characteristic of a forest—the cycle on which it sheds and grows leaves—could have escaped scientists’ attention before now. Partly it’s because the sheer size and remoteness of the Amazon prevents widespread, routine ground observations. But the other reason, Myneni explains, is the nature of the trees themselves.
“Most of these Amazon trees are what we call leaf-exchanging trees.” Unlike deciduous trees, they don’t shed all their leaves over a short time span at a specific time of year. Instead, he says, “What they do is drop a leaf and then put on a new leaf, nearly instantaneously. Well,” he amends, “not like ten minutes or anything, but you know, a few days, or maybe a week. Depending on the type of tree, a leaf can live anywhere from 12 months to nearly 4 years,” he says.
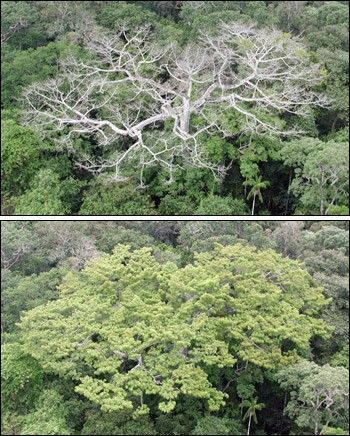
From the ground, what someone would see is a forest filled with millions of trees, each shedding and making new leaves on their own schedule. Sometimes, even trees of the same species are completely asynchronous, putting out new leaves or flowers at different times of the year. So how can the gradual, forest-wide changes in leaf area that MODIS measured emerge from this seeming chaos?
“First,” says Myneni, “imagine you have a tree that during the dry season drops 100 old leaves and puts on 125 new ones. That’s a 25 percent increase in leaf area. Now, if all the trees did this at the same time, what you would see is that, in the space of a week or so, leaf area would suddenly jump 25 percent. But that is not what we see. We see a gradual build up. So now imagine that you have 100 trees, and on day 1, maybe 5 of those trees will flush their new leaves, and on the next, another 5 trees will put on new leaves, and so on. You can imagine, then, that in 20 days, all these hundred trees will finally have more leaf area.”
With millions of trees over a seven-million-square kilometer area changing subtly from day to day, it’s easy to understand how the pattern could be been missed from the ground. Only with years of forest-wide satellite data did the Amazon’s seasonal secret become clear.
For Myneni, whose passion is the remote-sensing itself, few scientific accomplishments could be more rewarding than using a data product he helped invent to discover something that hadn’t been known before. But for tropical climatologist Rong Fu, the discovery had additional significance; it provided an explanation for yet another Amazon secret.
Monsoon Mystery
Among the mysteries of the South American Monsoon, explains Fu, is how the first thunderstorms of the wet season get started. A monsoon is an atmospheric see-saw in which the large-scale circulation of the atmosphere reverses direction on a seasonal basis. Winds that previously blew in one direction now blow in the opposite direction. Areas that were dry for months now receive months of steady rain.
The Amazon is in the realm of the trade winds, a belt of easterly winds that circles the globe a few degrees north and south of the equator. The winds bring moisture-laden air from the tropical Atlantic Ocean over the continent. Once that moisture-laden air is over the continent, northerly or southerly winds determine where in the Amazon the moisture will wind up. It is these winds that reverse during the monsoon.
So what causes a monsoon to reverse directions? The key ingredient, Fu explains, is elevated heating, heating of the atmosphere at high altitudes. The heated air rises, and air from farther away flows in to replace it. It is the heat at high altitudes that drives the atmospheric flow to overturn on a large scale. The question for the Amazon is where that heating comes from.
One way to get elevated heating is the presence of a large, high-altitude land surface. “For example, in the Asian monsoon, you have the Tibetan Plateau to provide elevated heating. When the seasons change, the Sun moves back to the Northern Hemisphere, back to the Plateau,” Fu explains. With an average elevation of several thousand meters above sea level, the Tibetan Plateau can heat the middle and upper layers of the troposphere—the atmospheric layer nearest Earth, where most weather happens.
The Amazon, on the other hand, has no equivalent to the Tibetan Plateau. “In the Amazon Basin the only way to inject heat into higher altitudes of the atmosphere is convection, or thunderstorms,” says Fu. Repeated thunderstorms kick-start the large-scale overturning of the atmosphere that causes the north-south winds to switch directions.
These facts left Fu with a riddle. In order for the wet phase of the monsoon to kick in over one part of the Amazon, the north-south winds must reverse direction and bring moisture into the basin. For the north-south winds to reverse direction, there must be heating at high levels of the atmosphere. To get heating high in the atmosphere in the Amazon, you need thunderstorms. “But how,” asks Fu, “can you have a thunderstorm before you have moisture being transported into the basin?”
This question is where Fu’s path intersected with Myneni’s. Back in 2004, Fu and one of her students had published a paper, based on Amazon weather observations and models, in which they hypothesized that the Amazon forest itself provided the trigger. “We showed that evapotranspiration—the release of water vapor from vegetation leaves—increased near the end of the dry season.”
The water vapor makes the air above the forest more buoyant (water vapor is lighter than dry air), allowing it to rise and initiate the season’s first thunderstorms. As water vapor in towering thunderstorm clouds condenses into rain, it releases heat into the atmosphere, beginning the process of overturning the atmosphere and reversing the monsoon.
“We concluded that a surge of evapotranspiration from the forest itself at the end of the dry season was needed to trigger the onset on the wet season. But we really didn’t know how evapotranspiration could increase,” says Fu.
Then one day, she opened her e-mail and found a draft copy of the manuscript that Myneni was preparing on his discovery of the Amazon’s seasonal leaf area pattern. A mutual colleague, Robert Dickinson, who was helping to write and review the paper, had passed the draft along.
“I was so excited,” Fu recalls. “I couldn’t believe it. When I talked to Ranga, I told him, ‘This is the missing piece; this is exactly what I didn’t know before.’ I was convinced that increased evaporation was necessary, but until I saw Ranga’s results, I did not know how we could get that increase.” The satellite data had provided one possible answer: more leaves.
Since plants evaporate water from microscopic openings in their leaves, more leaves means more surfaces for evapotranspiration. Leaf and evapotranspiration increase throughout the dry season to maximize growth when sunlight is abundant. Evapotranspiration releases more and more water vapor throughout the dry season until eventually, the air above the forest is buoyant enough to trigger widespread, frequent thunderstorms. These thunderstorms flip the monsoon switch, causing more and more moisture to be drawn into the area and perpetuating the rainy season. In other words, the rainforest itself seems to make it rain. “I think it is just so interesting,” says Fu, “that there is this connection between the rain and the underlying ecosystem.”
The discovery of this connection has generated an explosion of questions for the project’s many collaborators, each with the potential of spawning another chapter in the ongoing story of the intimate connections between Earth’s tropical ecosystems and climate. Will ground-based measurements of leaf area, evapotranspiration, and monsoon onset match up in the same way that satellites suggest they do? What processes besides an increase in leaf area might cause evapotranspiration rates to increase in the dry season? Will satellite-based leaf area measurements of other tropical forests find seasonal patterns like the Amazon’s? How do El Niño events affect the seasonal leaf area and greenness patterns in the Amazon? Will deforestation and global warming disrupt the connection between the rainforest and the rain? As the stories unfold, who knows what other secrets tropical forests might reveal?
NASA Earth Observatory story by Rebecca Lindsey; design by Robert Simmon
References
- Fu, R., Li, W., (2004). The influence of the land surface on the transition from dry to wet season in Amazonia. Theoretical and Applied Climatology 78 (1-3), 97-110. DOI: 10.1007/s00704-004-0046-7
- Li, W., Fu, R., (2004). Transition of the Large-Scale Atmospheric and Land Surface Conditions from the Dry to the Wet Season over Amazonia as Diagnosed by the ECMWF Re-Analysis. Journal of Climate, 17 (13) 2637-2651. DOI: 10.1175/1520-0442(2004)017<2637:TOTLAA>2.0.CO;2
- Myneni, R., Yang, W., Nemani, R., Huete, A., Dickinson, R., Knyazikhin, Y., Didan, K., Fu, R., Juárez, R., Saatchi, S., Hashimoto, H., Ichii, K., Shabanov, N., Tan, B., Ratana, P., Privette, J., Morisette, J., Vermote, E., Roy, D., Wolfe, R., Friedl, M., Running, S., Votava, P., El-Saleous, N., Devadiga, S., Su, Y., and Salomonson, V. (2007). Large seasonal swings in leaf area of Amazon rainforests. Proceedings of the National Academy of Sciences, 104 (12), 4820-4823. DOI: 10.1073/pnas.0611338104