Adventures in Space Science Mathematics

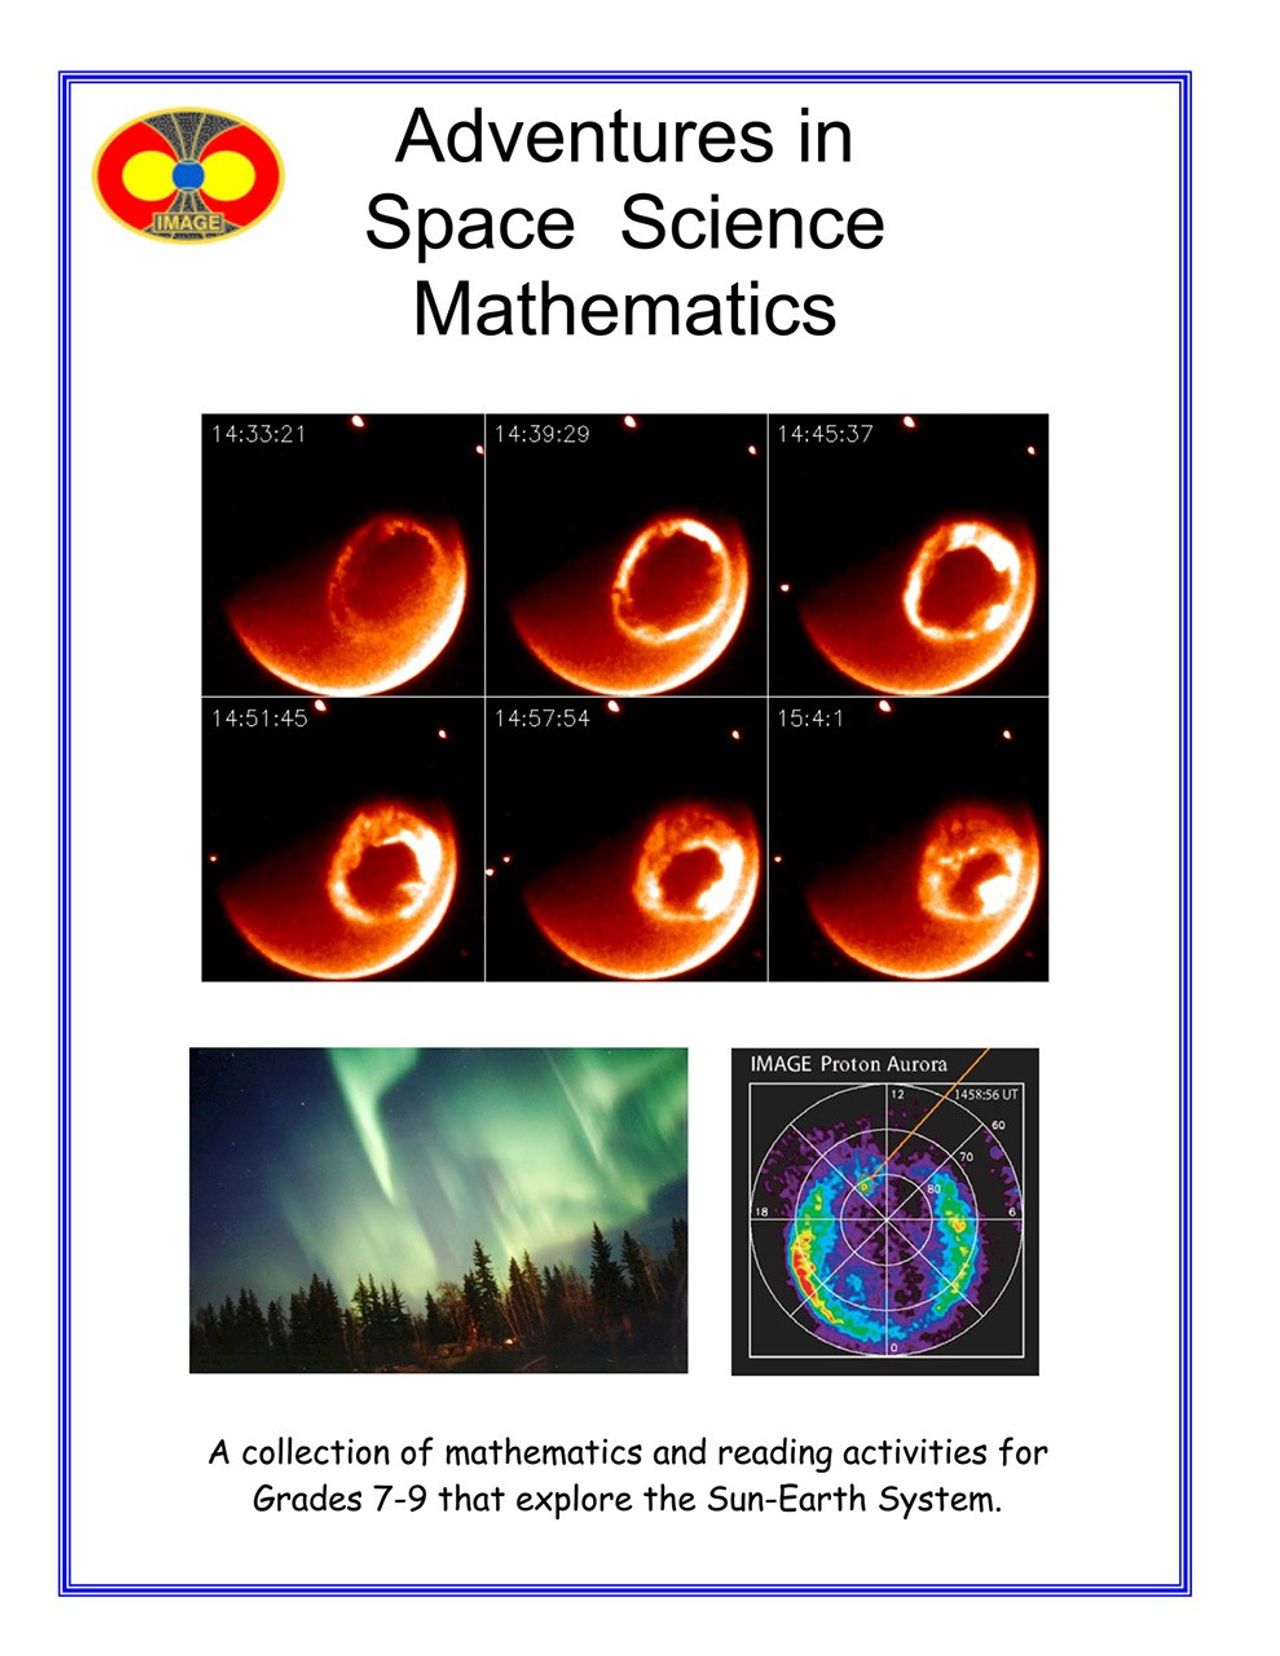
A series of images (left) of the Northern Lights from spacetaken by the IMAGE satellite. The front cover of the lesson includes: An oval IMAGE mission logo, with Earth in the center, represented by a blue circle. Earth’s magnetic field is shown with yellow lines, radiating out from Earth’s poles. The magnetic field lines are filled in with bright yellow, orange, and black. The title of the mission, “IMAGE” is printed on the bottom of the logo in gold.The title of the guide ‘Adventures in Space Science Mathematics’ is written in bold, black font.Below the title, a series of six Ultraviolet satellite image tiles of an orange Earth with the aurora appearing as a dark orange circle as a ring around the poles are in the middle of the page.  Numbers in the upper left hand corner of each image tile represent the time lapsed over an hour. Below and to the left is green hued Aurora Borealis streaming above the trees at night.  Below and to the right is a pinwheel plot showing solar wind data, which uses a color scale to show differences in density of particles in the aural ring over Earth’s pole. Red indicates higher density, while purple has lowest, with orange, yellow, green, and blue in between. The white lines, in concentric circles, separated into 8 sections, like a pie, define the parameters of the plot. The plot is titled, at the top, ‘IMAGE Proton Aurora.”In smaller black font, the bottom third reads ‘A collection of mathematics and reading activities for Grades 7-9 that explore the Sun-Earth System.’ There is a thin blue border around the entire page
Adventures in Space Science Mathematics
NASA
Levels
  • intermediate
Requirements
  • low_tech
  • low_cost
Helio Topics
  • coronal_mass_ejection
  • magnetosphere
  • space_weather
Helio Missions
  • solar_and_heliospheric_observatory_soho
CreditNASA
Language
  • english

Educator guide of activities will help students understand some of the real life applications of mathematics in the study of the Sun and Earth as a system. Through math and reading activities, students will learn:

  • how to search for trends and correlations in data
  • extract the average, maximum and minimum from data
  • use scientific notation to work with very large and small numbers
  • use a scale drawing to estimate the sizes of an aurora
  • use the Pythagorean Theorem to calculate magnetic field strength
  • how to use simple equations to convert raw data into physical quantities.