Graphing Global Temperature Trends Activity
| Levels |
|
|---|---|
| Material Type |
|
| Heliophysics Big Ideas |
|
| NGSS |
|
| Heliophysics Topics |
|
| Material Cost per Learner | Free |
| Language | English |
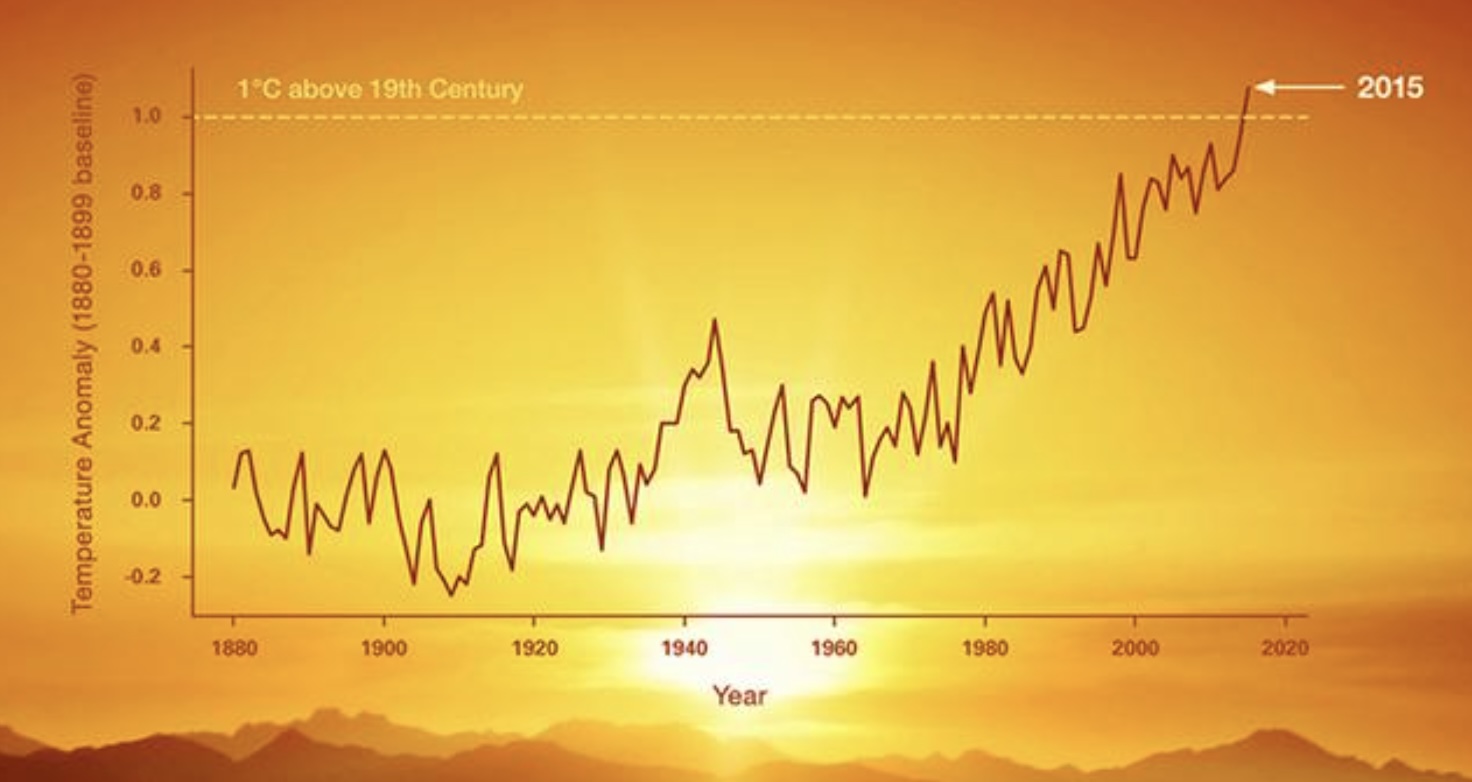
Students will use global temperature data to create models and compare short-term trends to long-term trends. They will then determine whether global temperature is rising based on the data. This activity is aligned to education standards for fifth grade and high school grade bands and has two sets of procedures, one for grade five and one for high school. Other variations for each grade band are indicated throughout the activity.


