


NOAA Solar Cycle Sunspot Progression Graph
NOAA Solar Cycle Sunspot Progression Graph
NOAA
| Levels |
|
|---|---|
| Material Type |
|
| Heliophysics Big Ideas |
|
| NGSS |
|
| Heliophysics Topics |
|
| Material Cost per Learner | Free |
| Language | English |
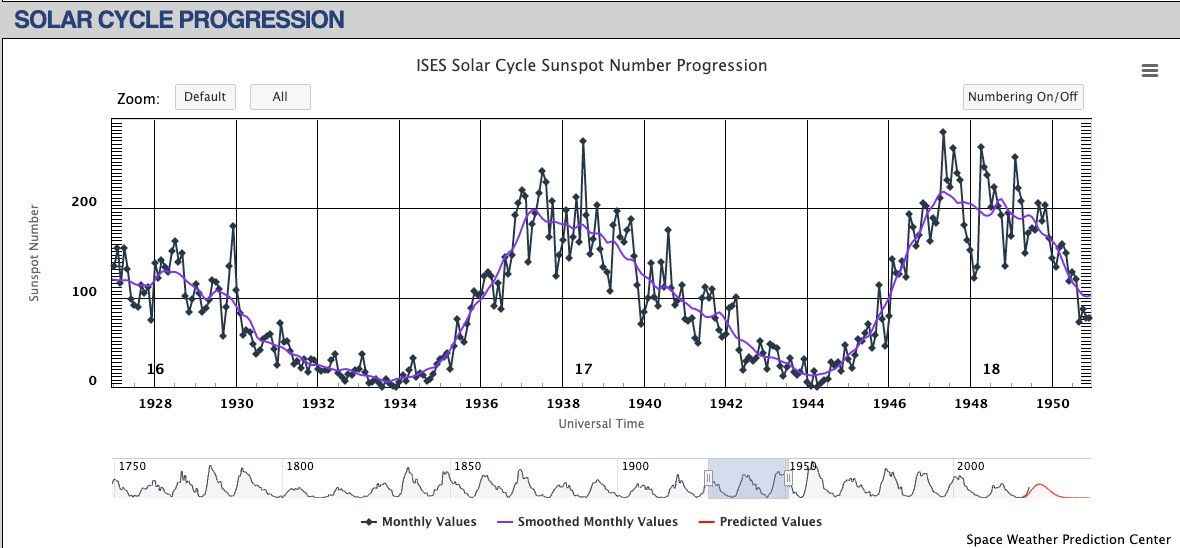
An interactive graph displays sunspot data all the way back to 1750, showing the correlation between the number of sunspots and the solar cycle. Part of NOAA’s Space Weather Prediction Center, learners can zoom in and out of the data, which includes prediction values and error bars. Older learners can also examine radio flux data. Counting sunspots is one way to predict activity on the Sun.