


Understanding Harmonized Landsat Sentinel-2 Vegetation Indices
In this explainer, each vegetation index includes a visualization, an example application, and a description of the index that highlights how HLS’s increased temporal revisit empowers new research.
This guide is part of an ongoing series covering nine vegetation indices; resources for each remaining index will be added upon completion.
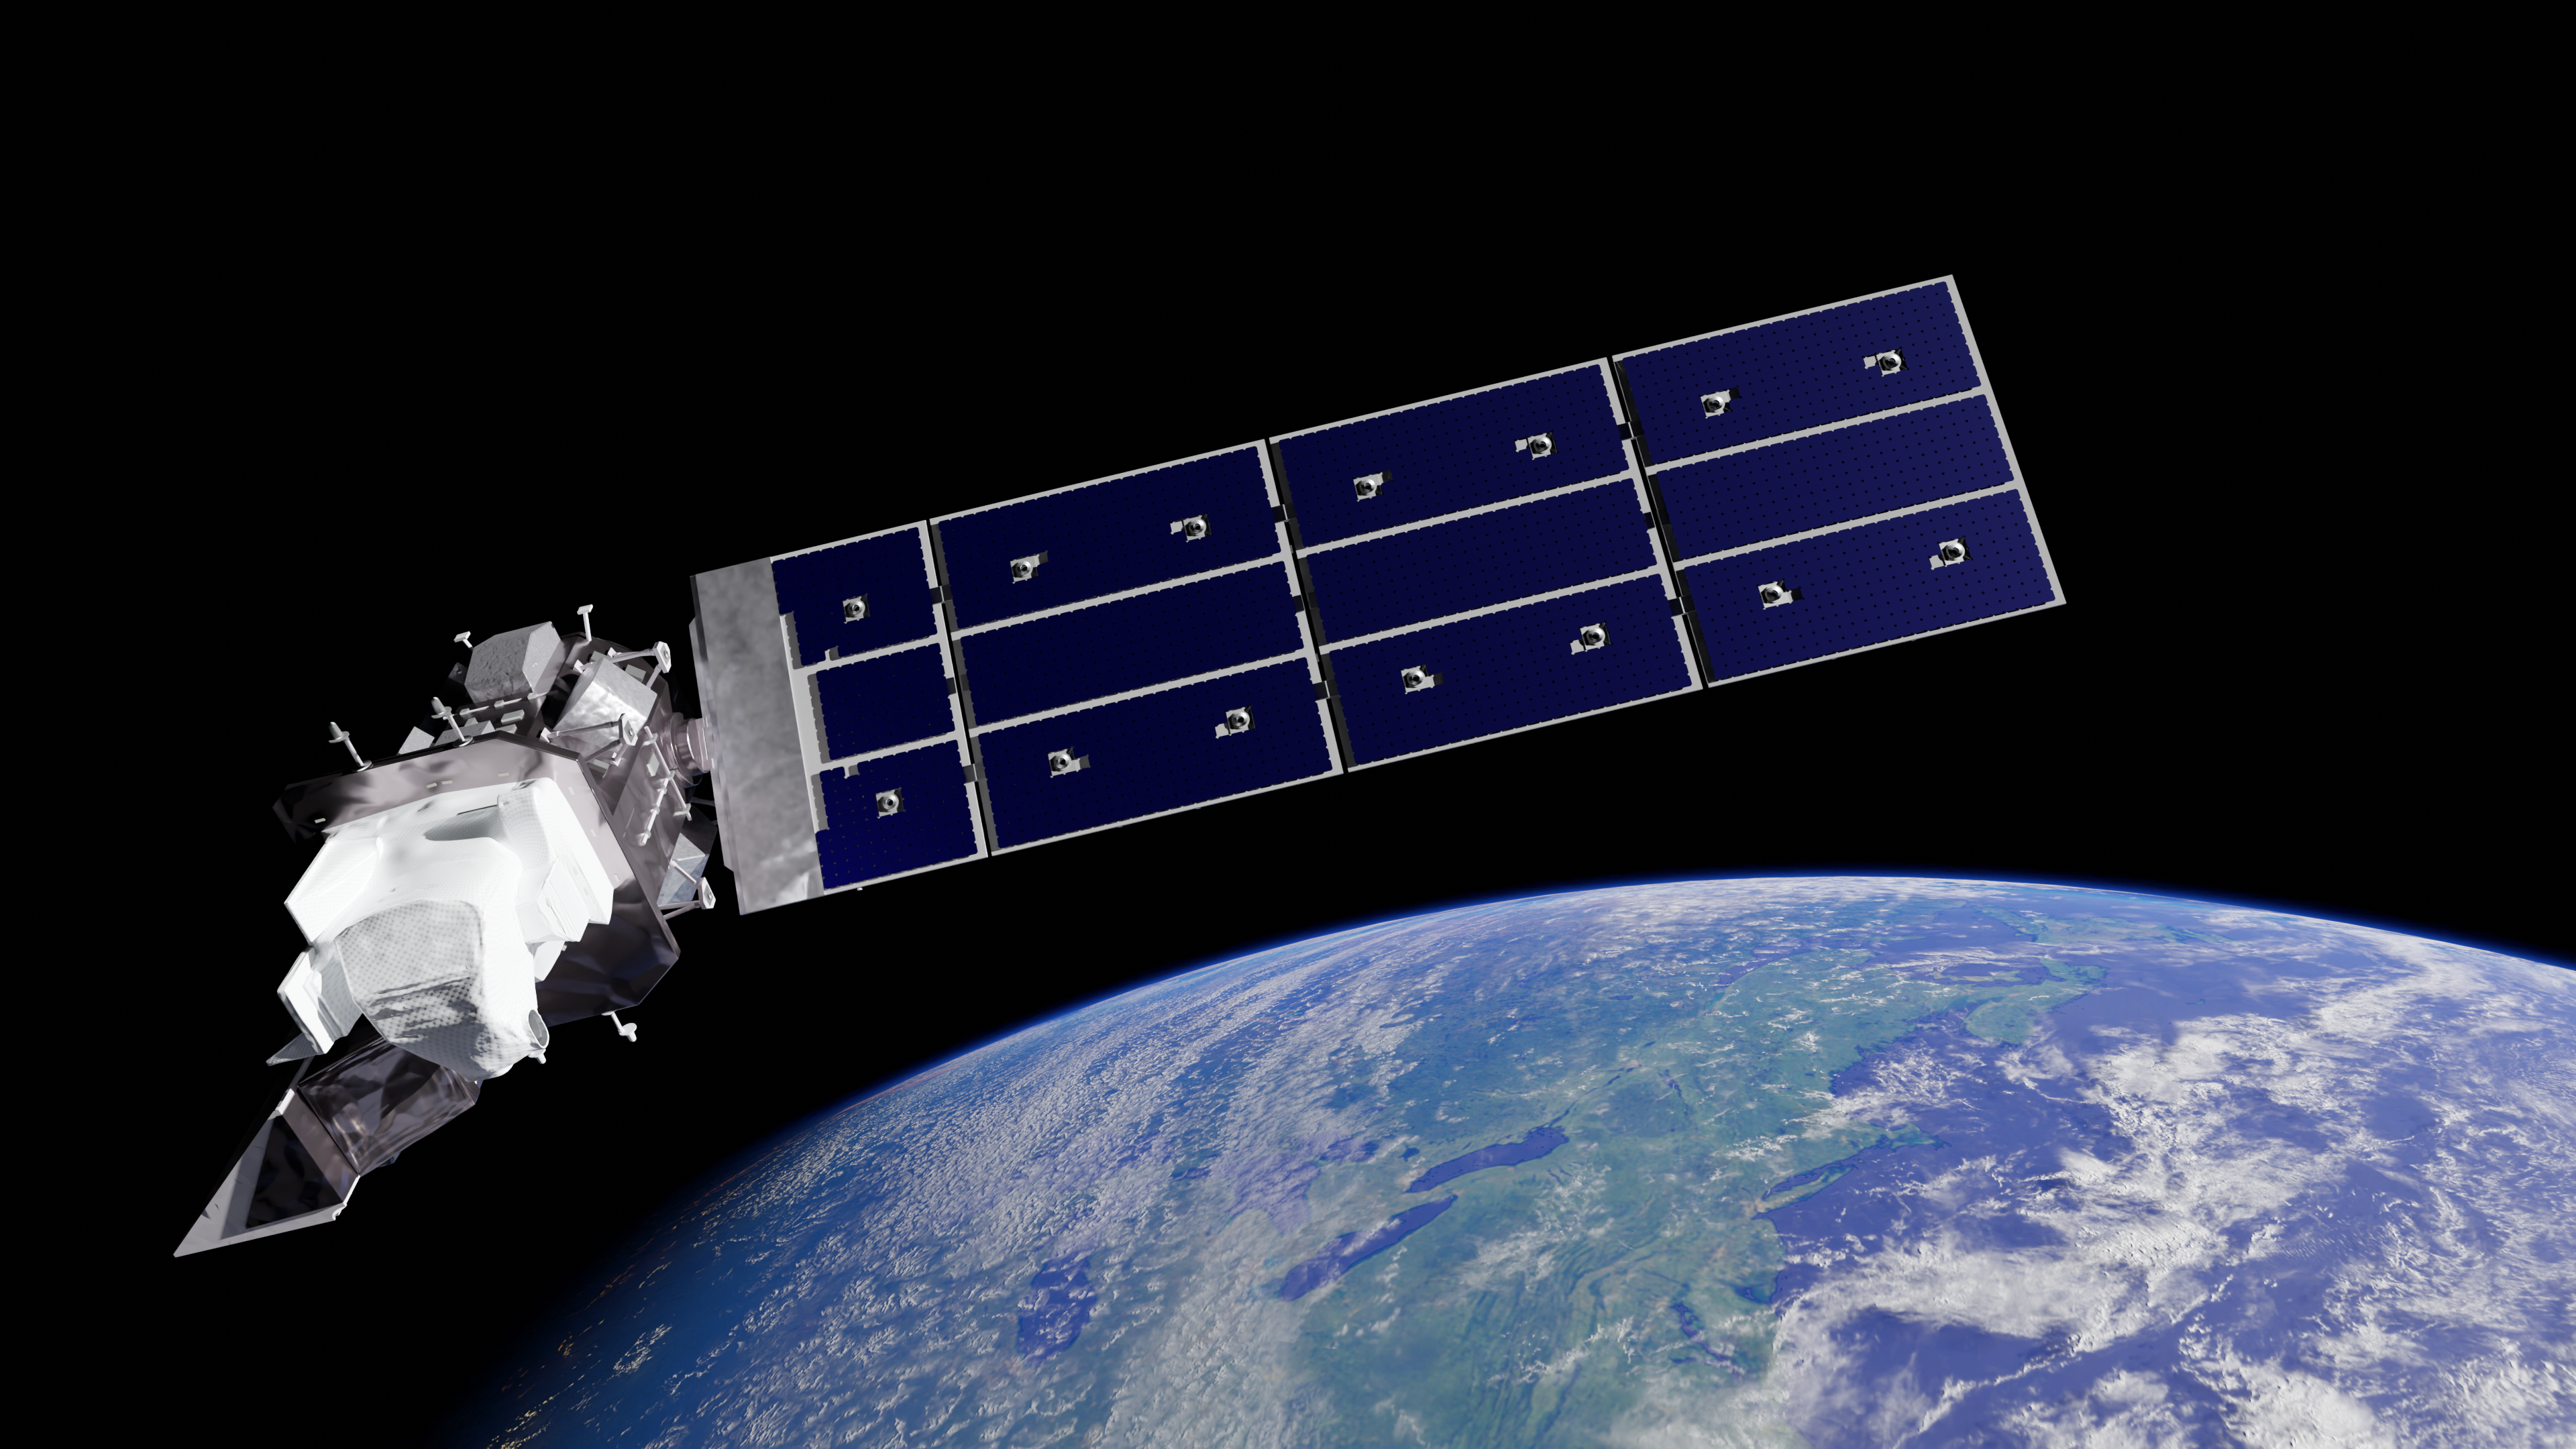
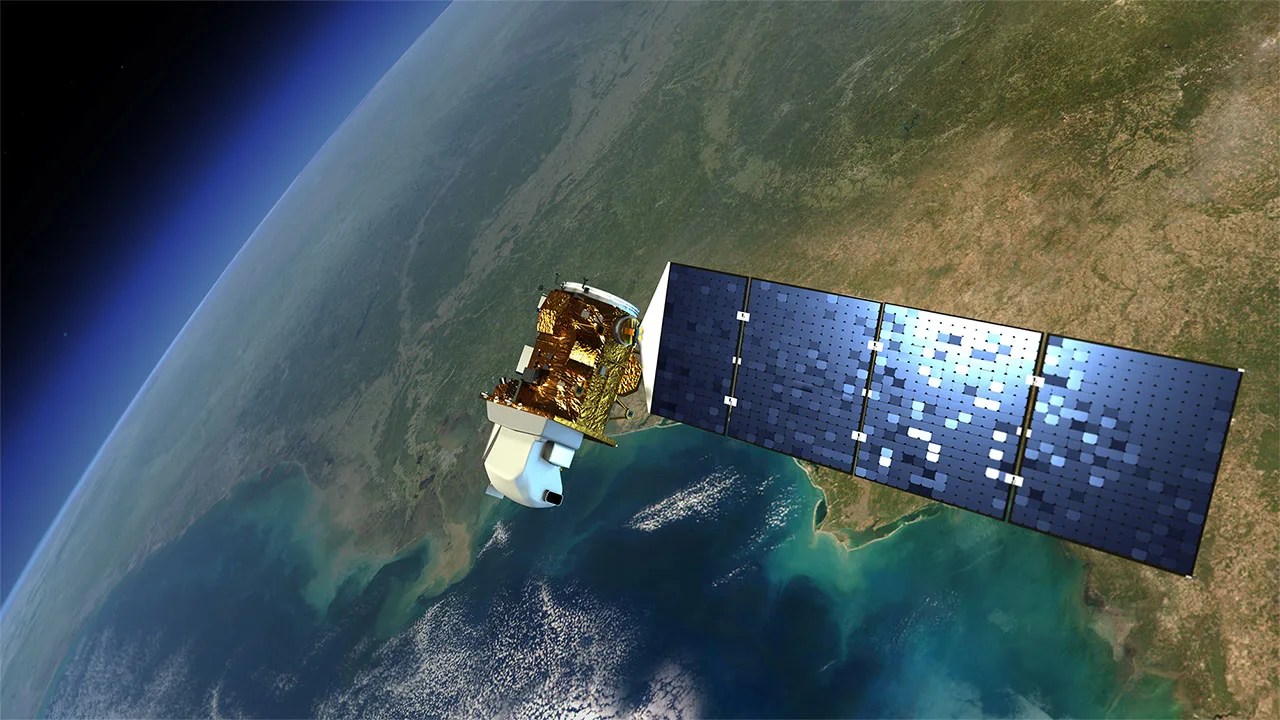
The Harmonized Landsat and Sentinel-2 vegetation index (HLS-VI) suite is a collection of nine indices that help scientists and land managers monitor the health and condition of vegetation across the entire planet. By combining data from NASA's Landsat 8 and 9 satellites and ESA’s Sentinel-2A, B, and C, the HLS product delivers 30-meter resolution snapshots of vegetation every 1-2 days, allowing users to track changes faster than with Landsat or Sentinel-2 imagery alone. These nine indices each have their own strengths: some measure overall plant health and greenness (NDVI, EVI), others detect water stress and moisture content (NDMI, NDWI), some are designed to work better in areas with exposed soil or sparse vegetation (SAVI, MSAVI), and others help assess damage from wildfires (NBR, NBR2) or monitoring changes in plant biomass and stress (TVI). By harmonizing data from Landsat and Sentinel-2, the HLS vegetation index products provide researchers with a powerful, consistent tool for applications ranging from tracking crop conditions and monitoring droughts to assessing wildfire damage and understanding how ecosystems respond to environmental change.
In this explainer, each vegetation index features a visualization, an example application, and a description of the index that highlights how HLS’s increased temporal revisit empowers new research. HLS is funded by NASA and is a deliverable of the Satellite Needs Working Group (SNWG), an interagency effort of the U.S. Government dedicated to identifying and addressing Earth observation needs across U.S. civilian federal agencies.
For more detailed technical information about the HLS-VI dataset, explore the Product User Guide.
NDVI
The Normalized Different Vegetation Index (NDVI) is the most popular vegetation index and is used to quantify crop health, assess vegetation density, and monitor plant stress.
NDVI = (NIR - Red) / (NIR + Red)
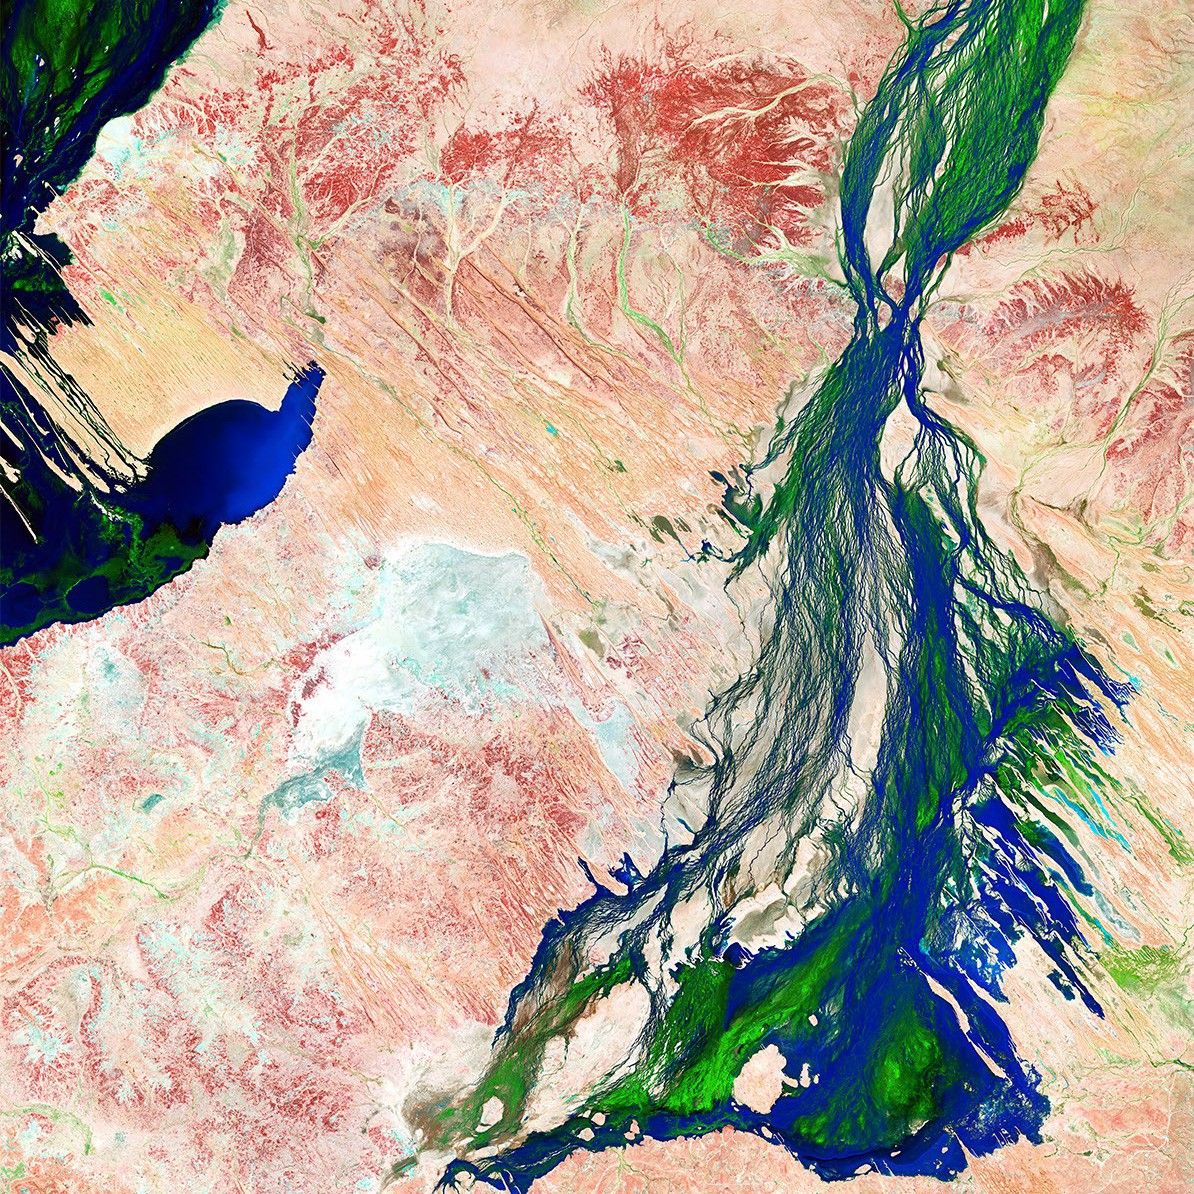
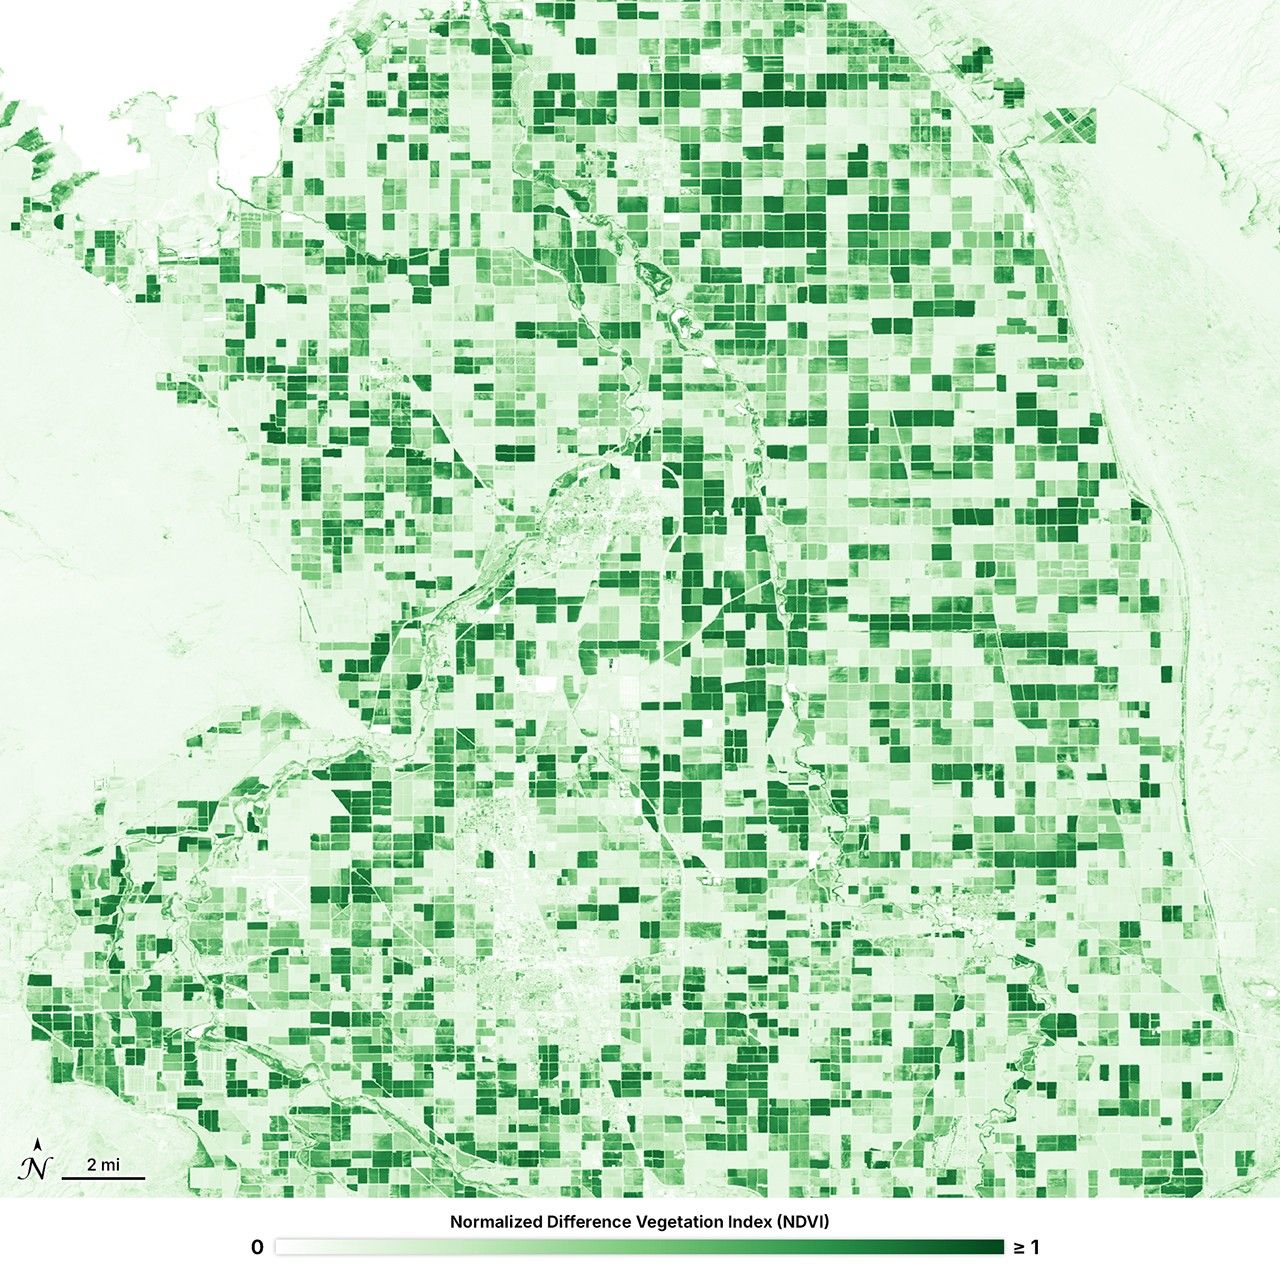
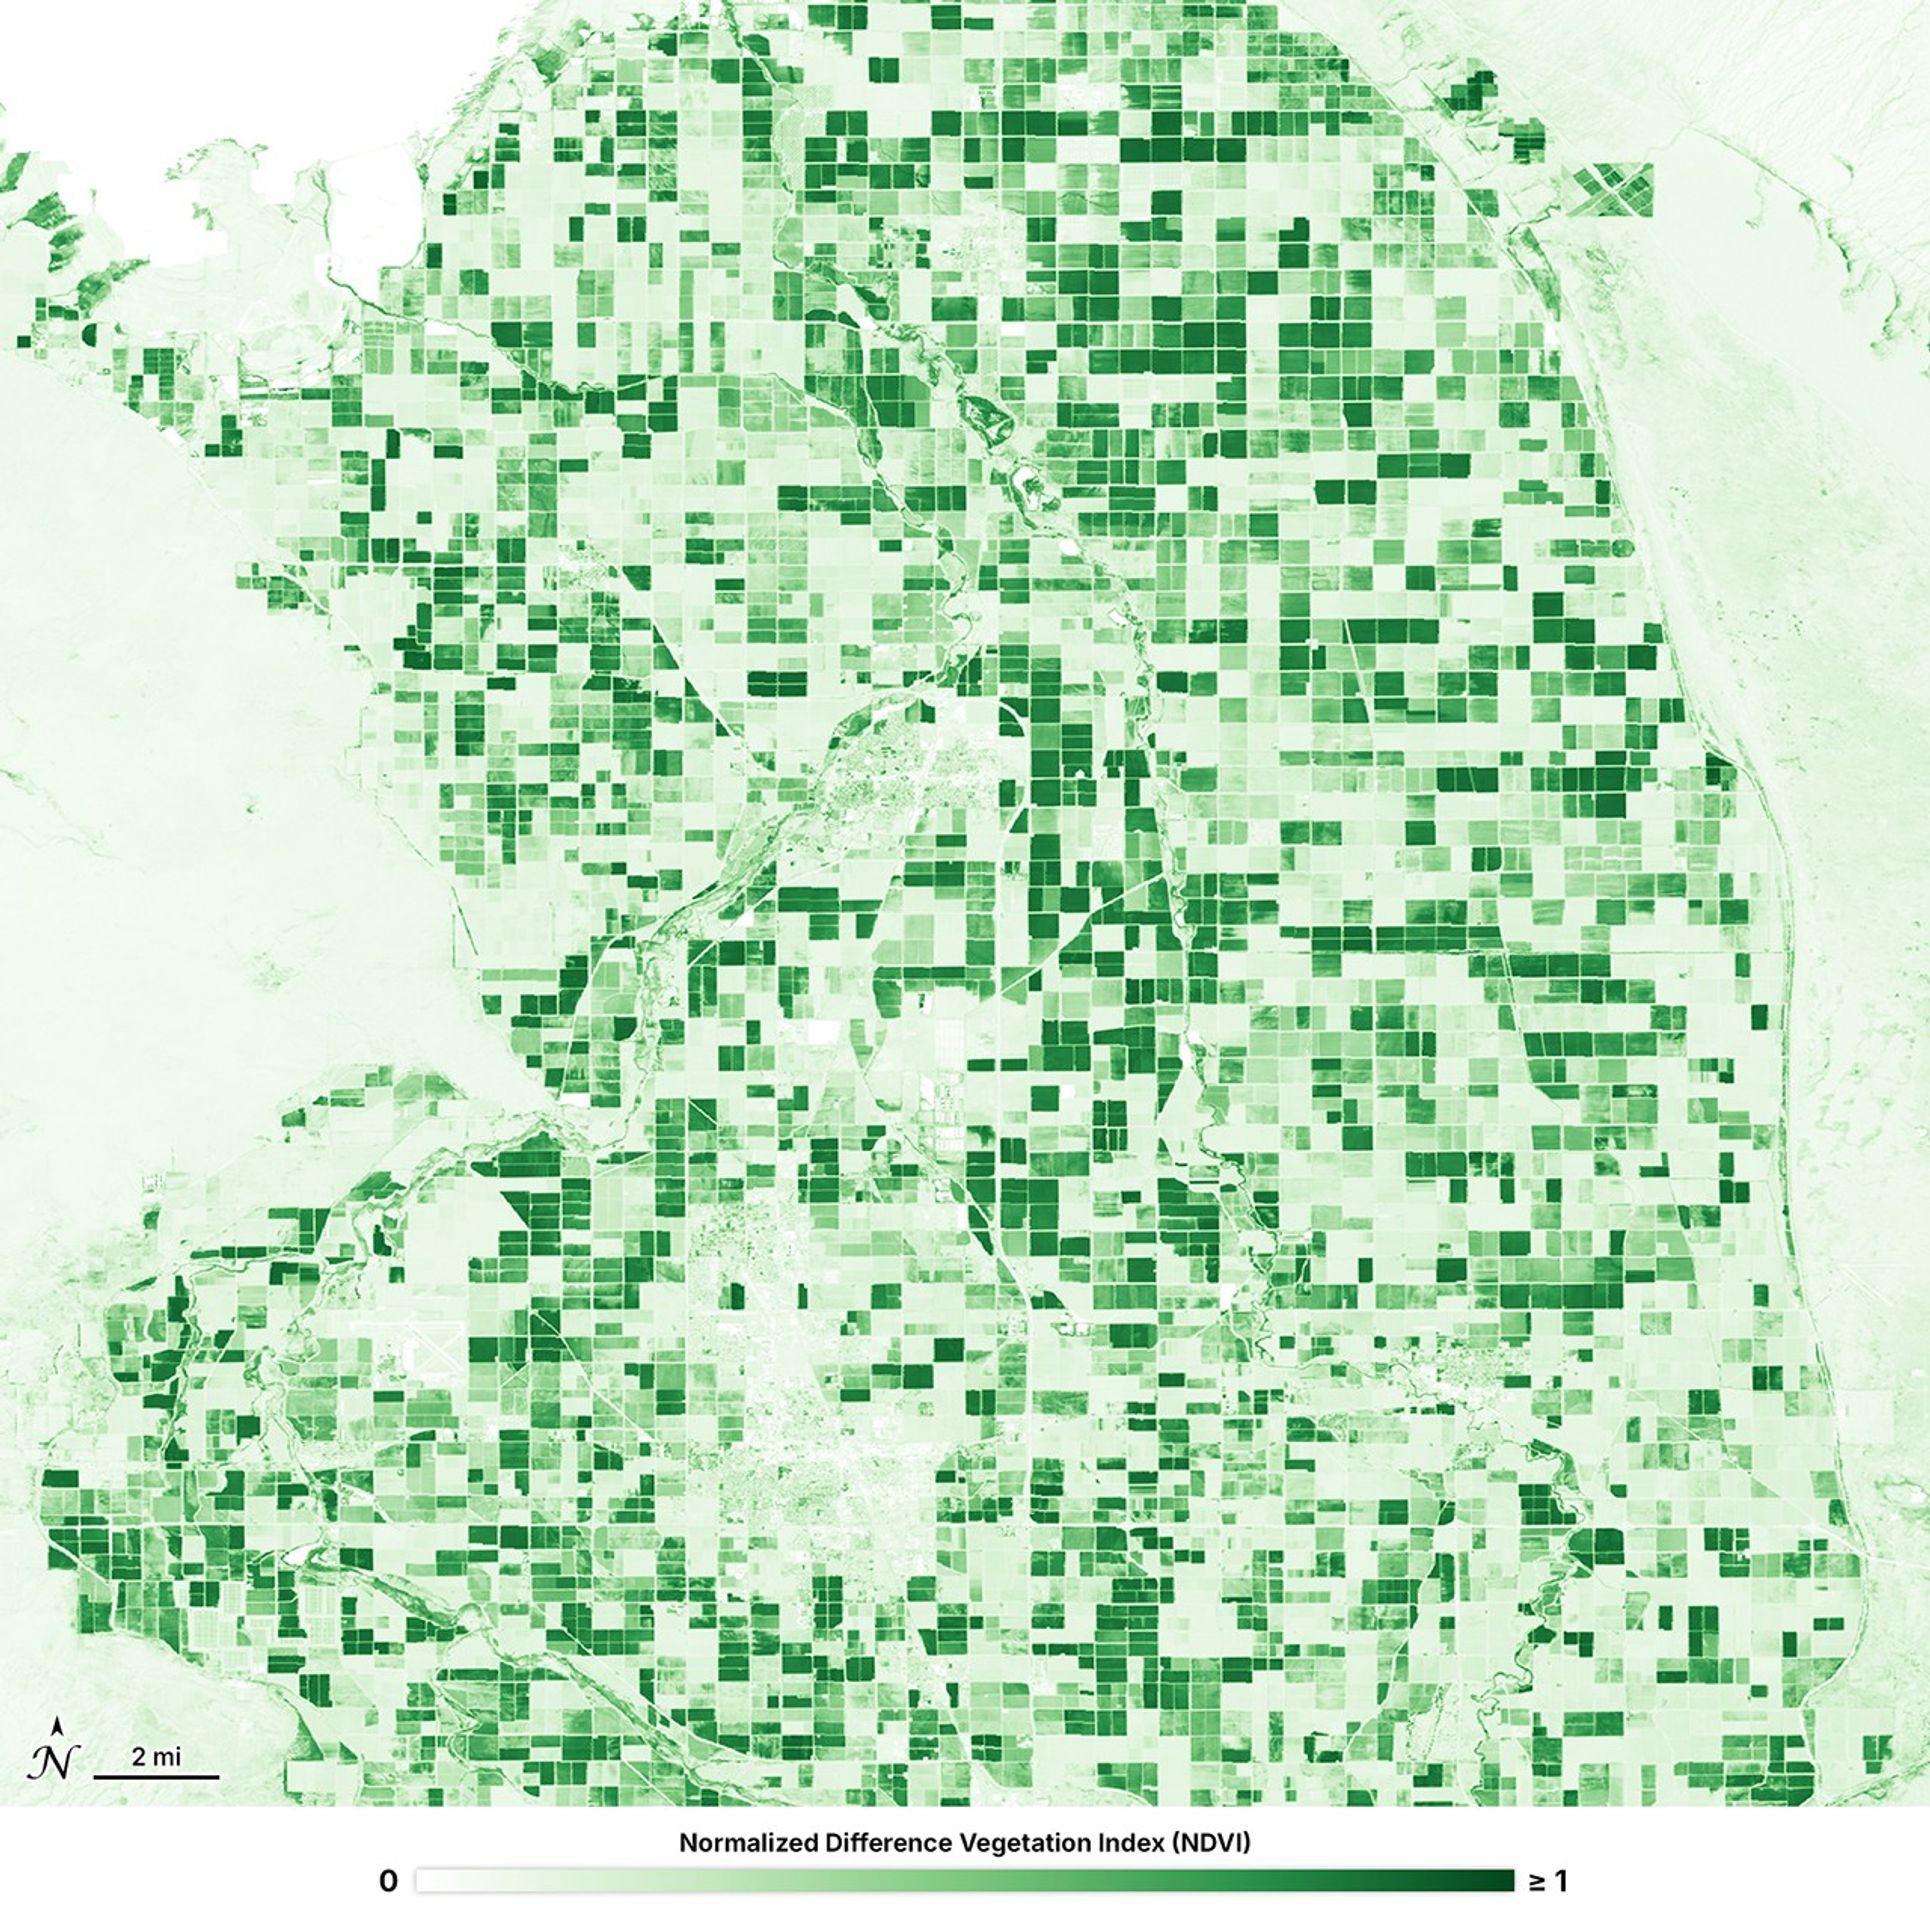
Against the background of the Sonoran Desert, agricultural fields flicker with life. This animation, which runs from October 12, 2024 to October 16, 2025, showcases crop cycles in the region with the Normalized Difference Vegetation Index (NDVI). Scientists use NDVI to assess vegetation presence, density, and stress levels by combining near-infrared (NIR) and red reflectance measurements from optical satellites. Darker green indicates healthier and denser vegetation, while lighter green indicates unhealthy or absent vegetation.
Over the course of one year, these rectangular fields flare dark green with each new crop planted before returning to light green after the harvest. The primary crop in this section of the Imperial Valley is alfalfa, which is planted and harvested three to four times a year. These shifting crop cycles occur just south of the Salton Sea, California’s largest inland water body. The Salton Sea is fed by agricultural runoff and has high concentrations of salt, as the lake’s only method of outflow is evaporation. Despite these conditions, the lake is a key stop for migratory birds passing through California. The animation is composed of images from Harmonized Landsat and Sentinel-2 vegetation indices (HLS-VI) product. HLS is a NASA product that combines imagery from the NASA/USGS Landsat 8 and Landsat 9 satellites and the European Space Agency’s Sentinel-2A, 2B, and 2C satellites.
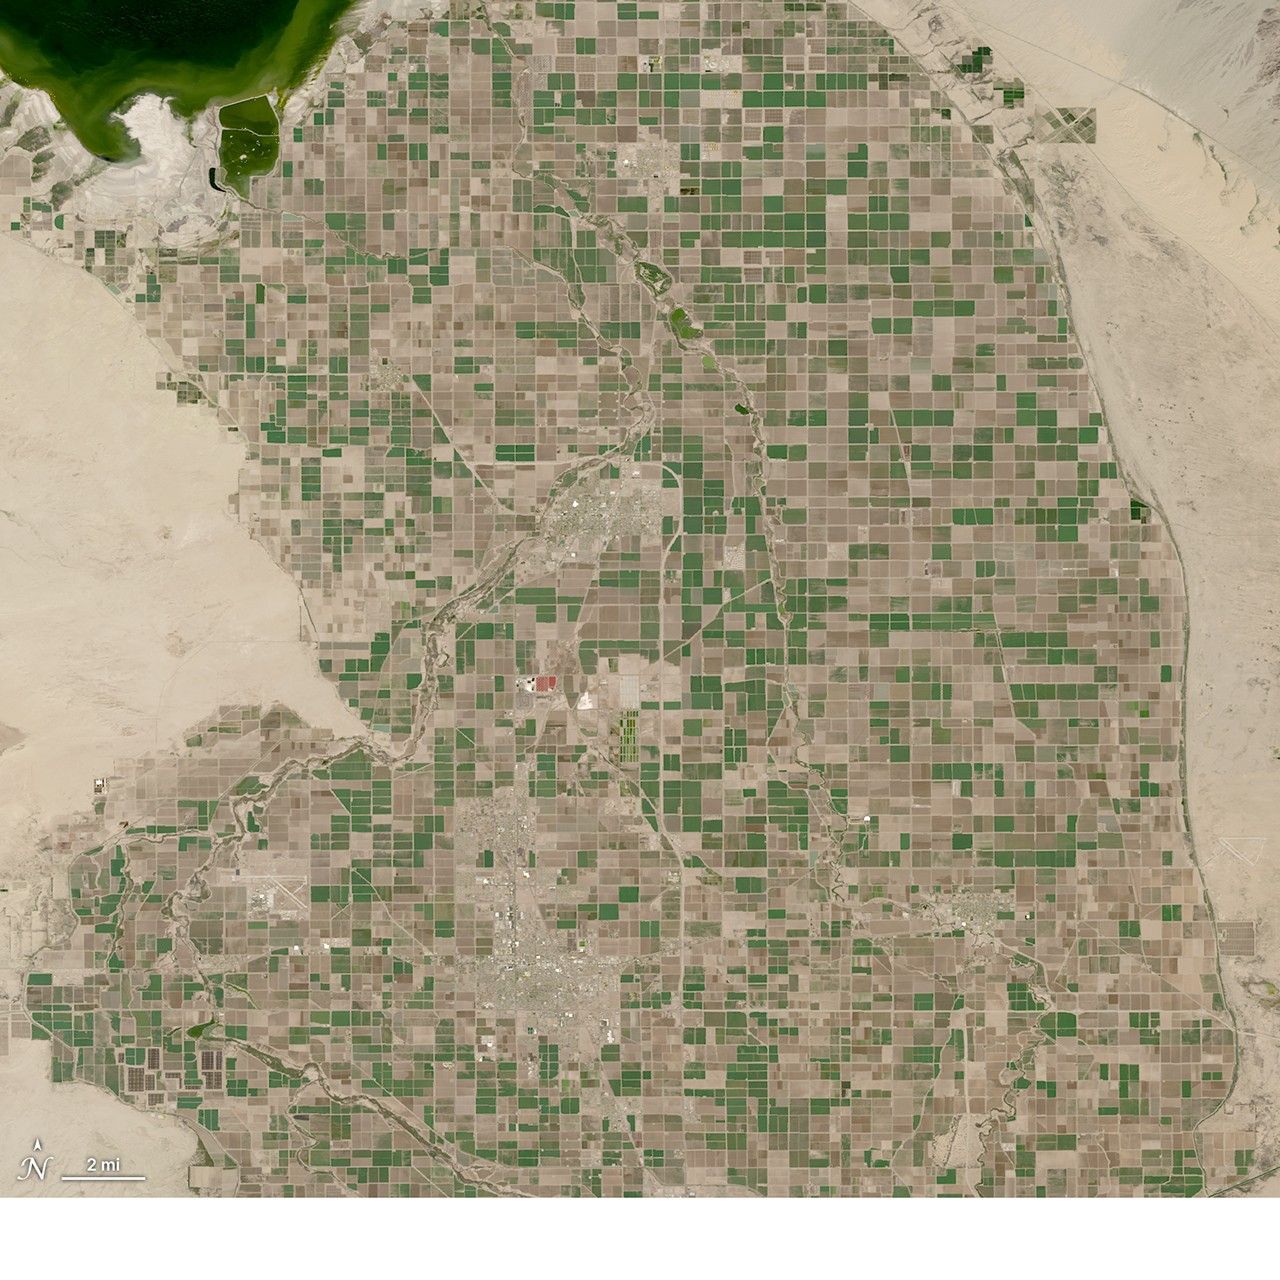
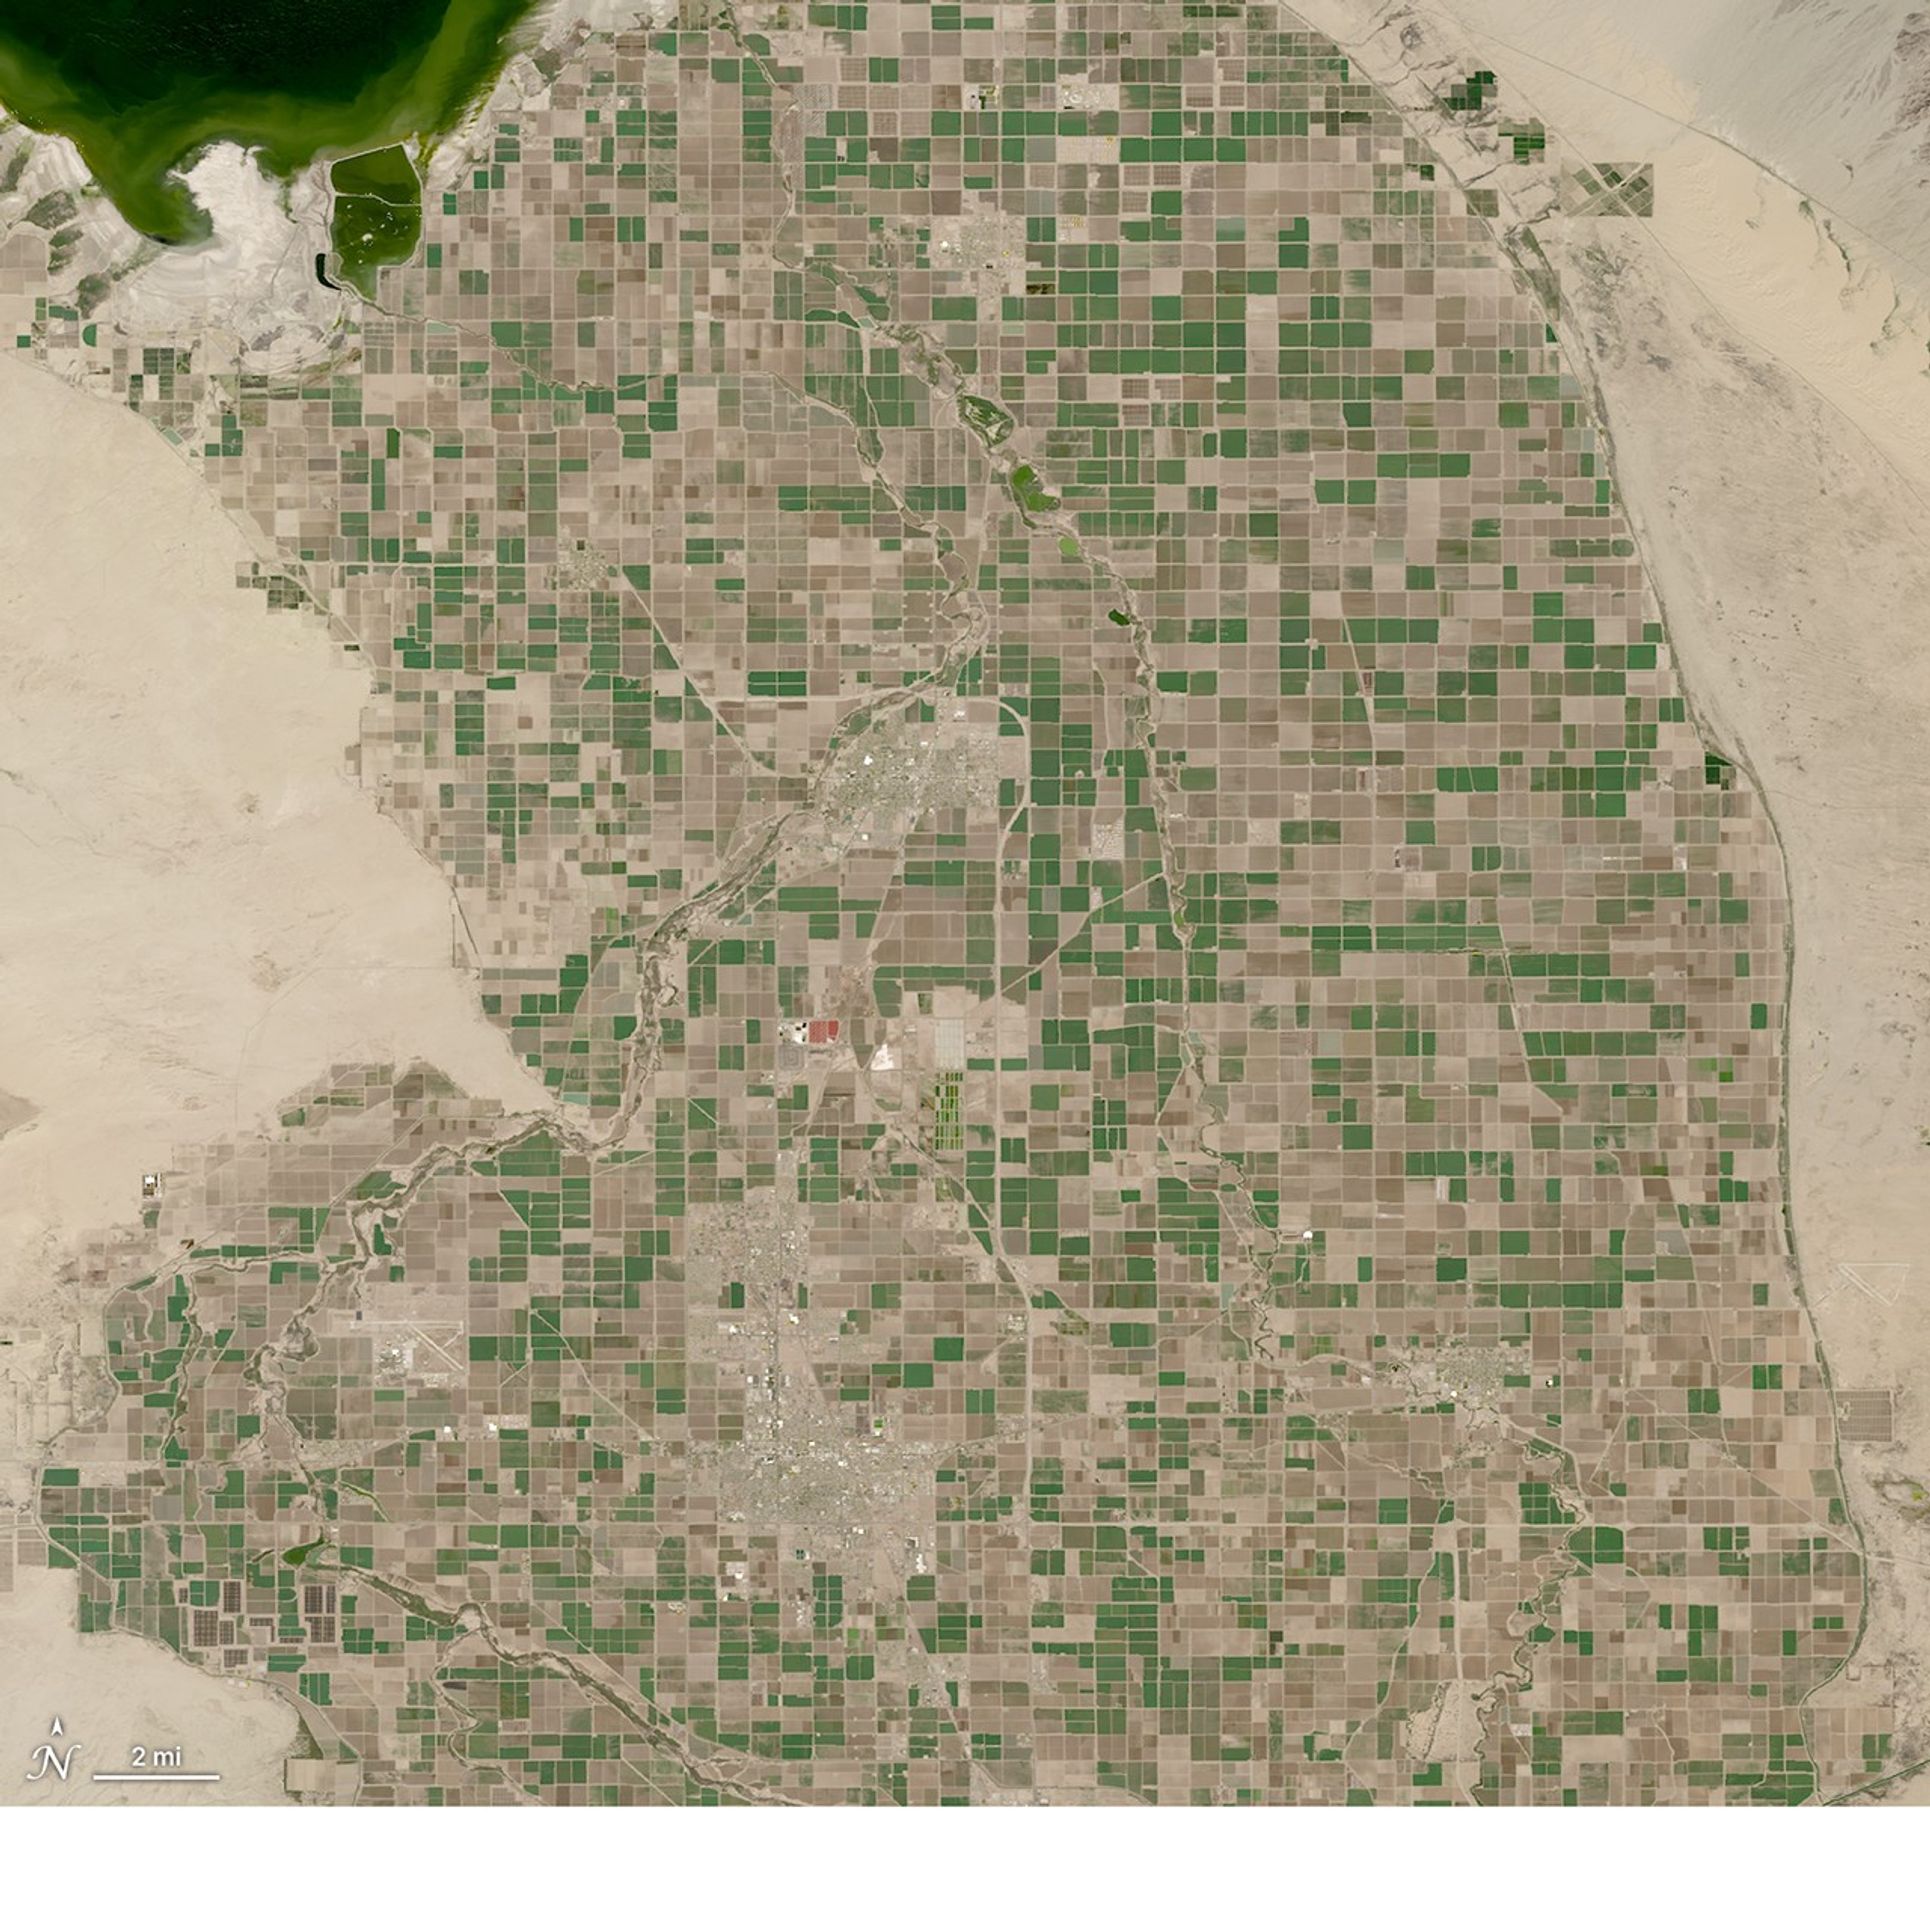
Cycles of Growth in the Imperial Valley
Values in the HLS-VI NDVI product range from -1 to 1, where values from 0.6 to 1 indicate healthier vegetation, values from to 0 to 0.6 indicate sparse or stressed vegetation, and values from -1 to 0 indicate non-vegetated features like water or bare soil.
Related Resources
- Normalized Difference Vegetation Index (NDVI), NASA Earthdata
- Measuring Vegetation (NDVI & EVI), NASA's Earth Observatory
- Salton Sea Validation, JPL
- Background Information on the Salton Sea, California Department of Fish and Wildlife