


1 min read
Merging Galaxies in the Extended Groth Strip
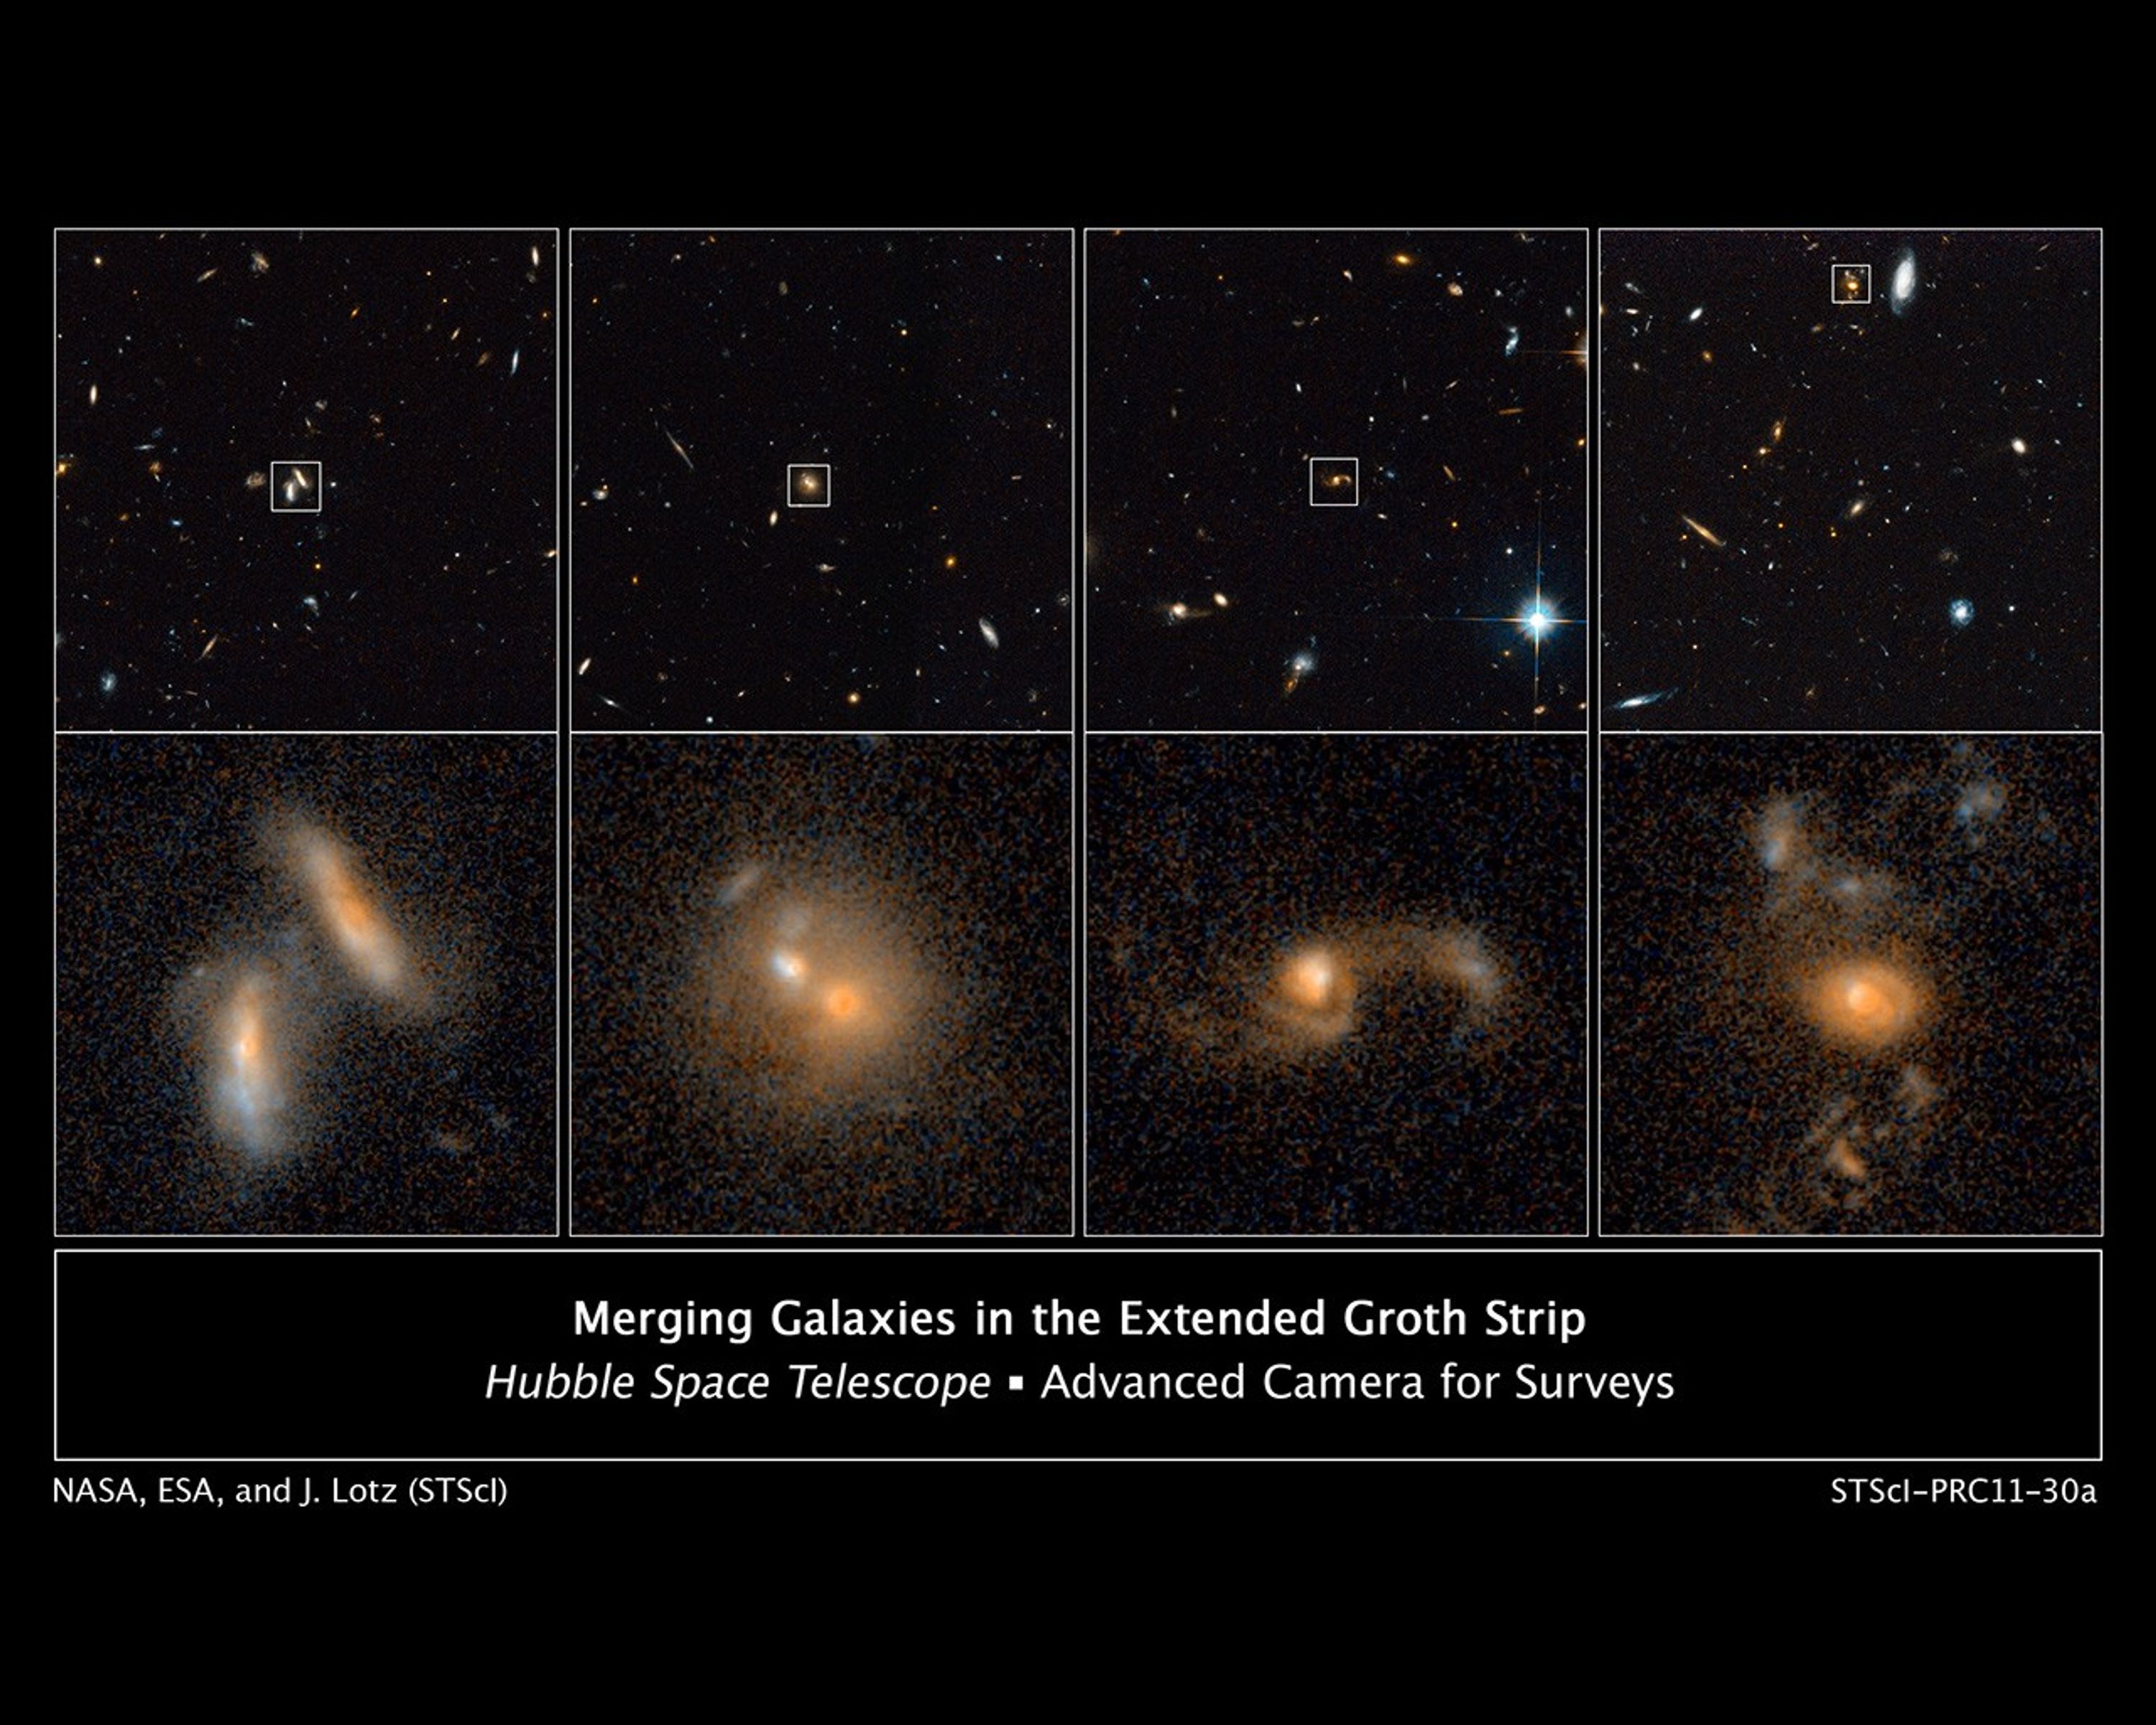
These images from NASA's Hubble Space Telescope show four examples of interacting galaxies far away from Earth.
The galaxies, beginning at far left, are shown at various stages of the merger process.
The top row displays merging galaxies found in different regions of a large survey known as the All-Wavelength Extended Groth Strip International Survey (AEGIS). The images were taken in 2004 and 2005 by Hubble's Advanced Camera for Surveys.
More detailed views of those galaxies are shown in the bottom row of images. The image at far left shows a close pair of galaxies that are just beginning to interact. The next image reveals two galaxies that are coalescing, yet still have two distinct cores. The third image displays a merging system with distorted spiral arms. The image at far right reveals the union of two galaxies, which still show signs of an irregular structure.
By studying many galaxy interactions at various distances from Earth, astronomers can measure the rate at which galaxies merge over time. This information yields important clues about how galaxies have changed throughout the universe's history.
About the Object
- R.A. PositionR.A. PositionRight ascension – analogous to longitude – is one component of an object's position.14h 17m
- Dec. PositionDec. PositionDeclination – analogous to latitude – is one component of an object's position.+52° 30'
- ConstellationConstellationOne of 88 recognized regions of the celestial sphere in which the object appears.Boötes
About the Data
- Data DescriptionData DescriptionProposal: A description of the observations, their scientific justification, and the links to the data available in the science archive.
Science Team: The astronomers who planned the observations and analyzed the data. "PI" refers to the Principal Investigator.The images released with this science finding were created from HST data from proposal 10134: M. Davis (University of California, Berkeley). Notes: The science team for this release comprises: J. Lotz (STScI), P. Jonsson (Harvard-Smithsonian Center for Astrophysics), T. J. Cox (Carnegie Observatories), D. Croton (Centre for Astrophysics and Supercomputing/Swinburne University), J. Primack (University of California, Santa Cruz), R. Somerville (STScI/JHU), and K. Stewart (NASA/JPL). The surveys used in this study include: COSMOS (HST; PI: N. Scoville; HST Archival Data), GEMS (PI: H.-W. Rix; HST Archival Data), GOODS (PI: M. Giavalisco; HST Archival Data), AEGIS (PI: M. Davis; HST Archival Data), HUDF (PI: S. Beckwith; HST Archival Data), and DEEP2 (PI: M. Davis; Keck Survey). - InstrumentInstrumentThe science instrument used to produce the data.HST>ACS/WFC
- Exposure DatesExposure DatesThe date(s) that the telescope made its observations and the total exposure time.June 2004 – March 2005
- FiltersFiltersThe camera filters that were used in the science observations.F555W (V) and F814W (I)
- Object NameObject NameA name or catalog number that astronomers use to identify an astronomical object.Merging galaxies in the Extended Groth Strip (EGS)
- Object DescriptionObject DescriptionThe type of astronomical object.Merging Galaxies from the All-Wavelength Extended Groth Strip International Survey (AEGIS)
- Release DateOctober 27, 2011
- Science ReleaseAstronomers Pin Down Galaxy Collision Rate
- Credit
This image is a composite of many separate exposures made by the ACS/WFC instrument on the Hubble Space Telescope using two different filters that isolate broad wavelengths. The color results from assigning different hues (colors) to each monochromatic image. In this case, the assigned colors are: Blue: F555W (V) Green: F555W (V) + F814W (I) Red: F814W (I)
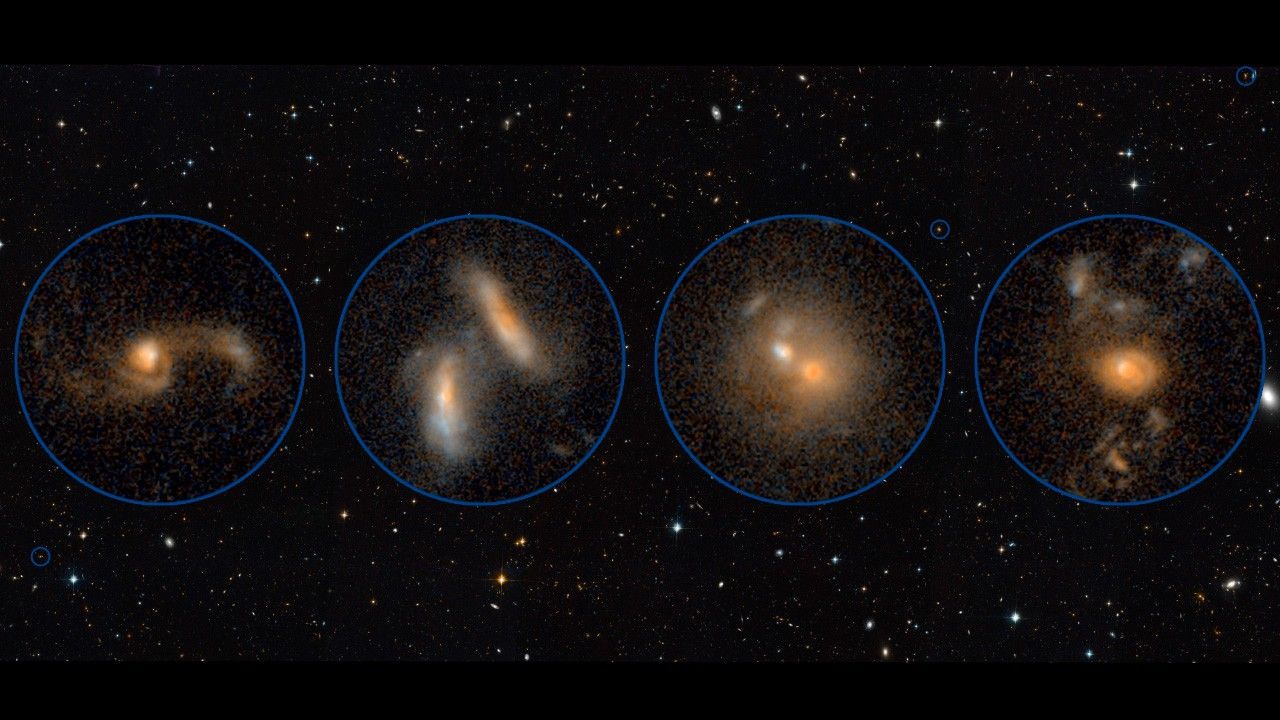
Related Images & Videos


Simulated Images of Merging Galaxies
These illustrations demonstrate how two galaxies coalesce in a slow dance that lasts about a billion years. The graphics are taken from a simulation astronomers created to determine how long it takes for galaxies to complete a merger. By understanding the time it takes for two...
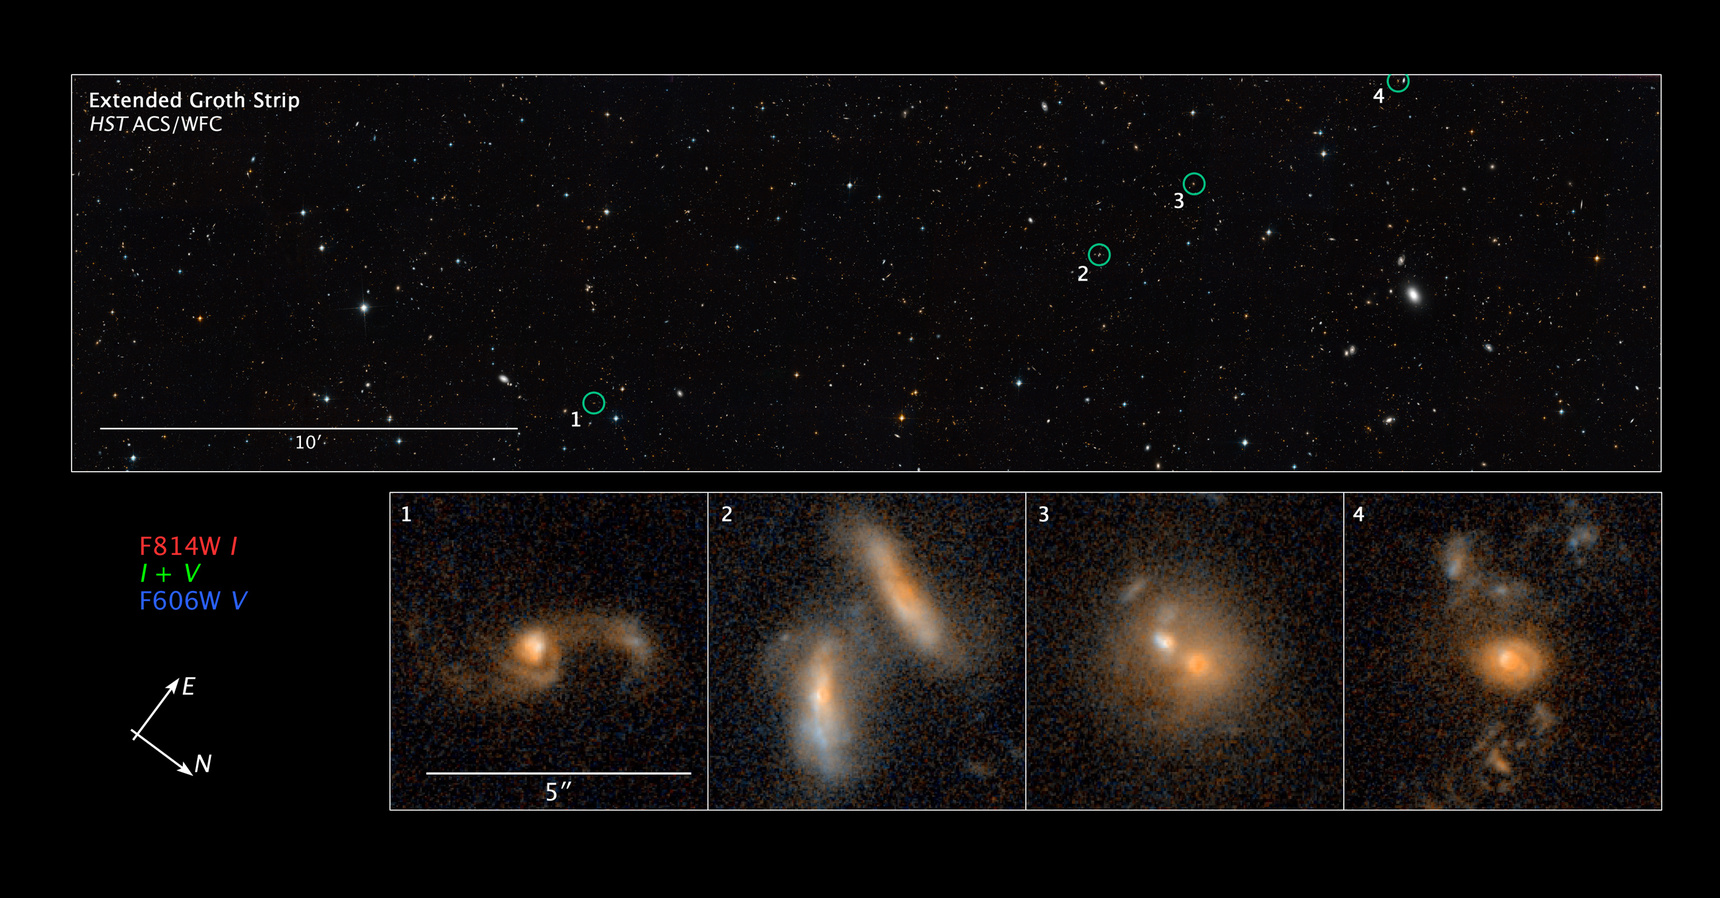
Compass and Scale Image of Merging Galaxies in the Extended Groth Strip
This image displays several merging galaxies (identified by the green circles) found in different regions of a large survey known as the All-Wavelength Extended Groth Strip International Survey (AEGIS). Hubble's Advanced Camera for Surveys took the image in 2004 and 2005. The...

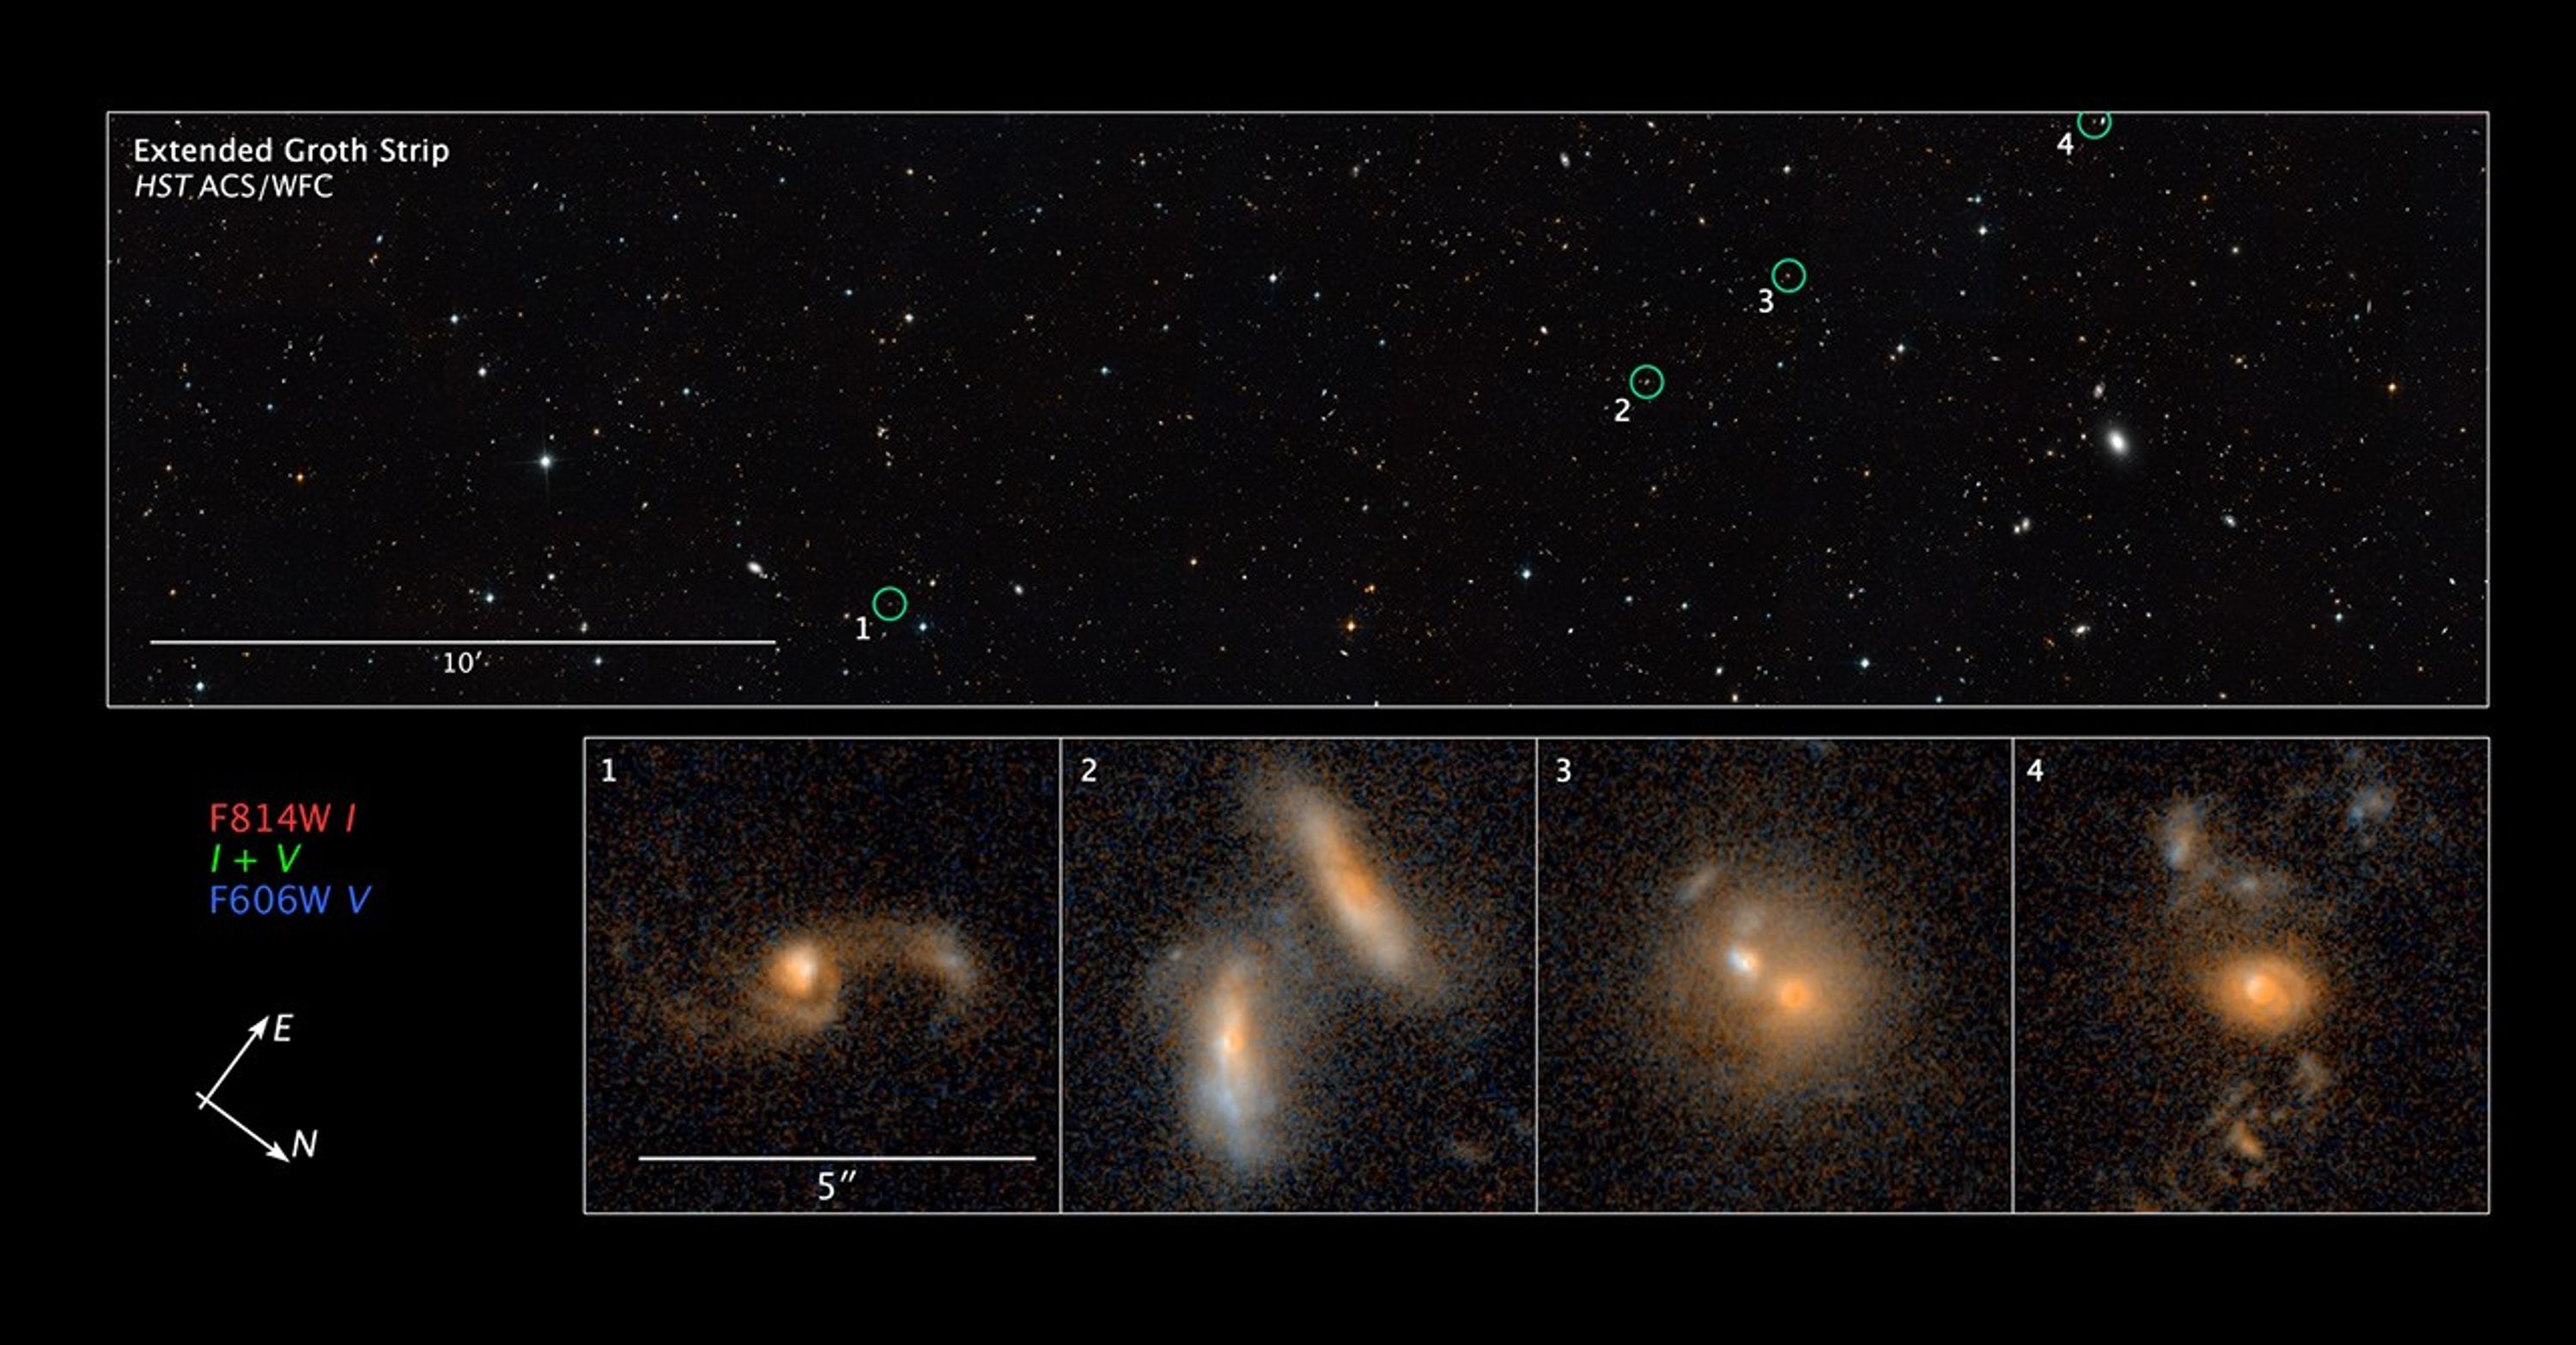
Zoom into Extended Groth Strip Merging Galaxies
A new analysis of Hubble surveys, including the All-Wavelength Extended Groth Strip International Survey (AEGIS), the Cosmological Evolution Survey (COSMOS), and the Great Observatories Origins Deep Survey (GOODS), combined with simulations of galaxy interactions, reveals that...
Share
Details
Claire Andreoli
NASA’s Goddard Space Flight Center
Greenbelt, Maryland
claire.andreoli@nasa.gov