


1 min read
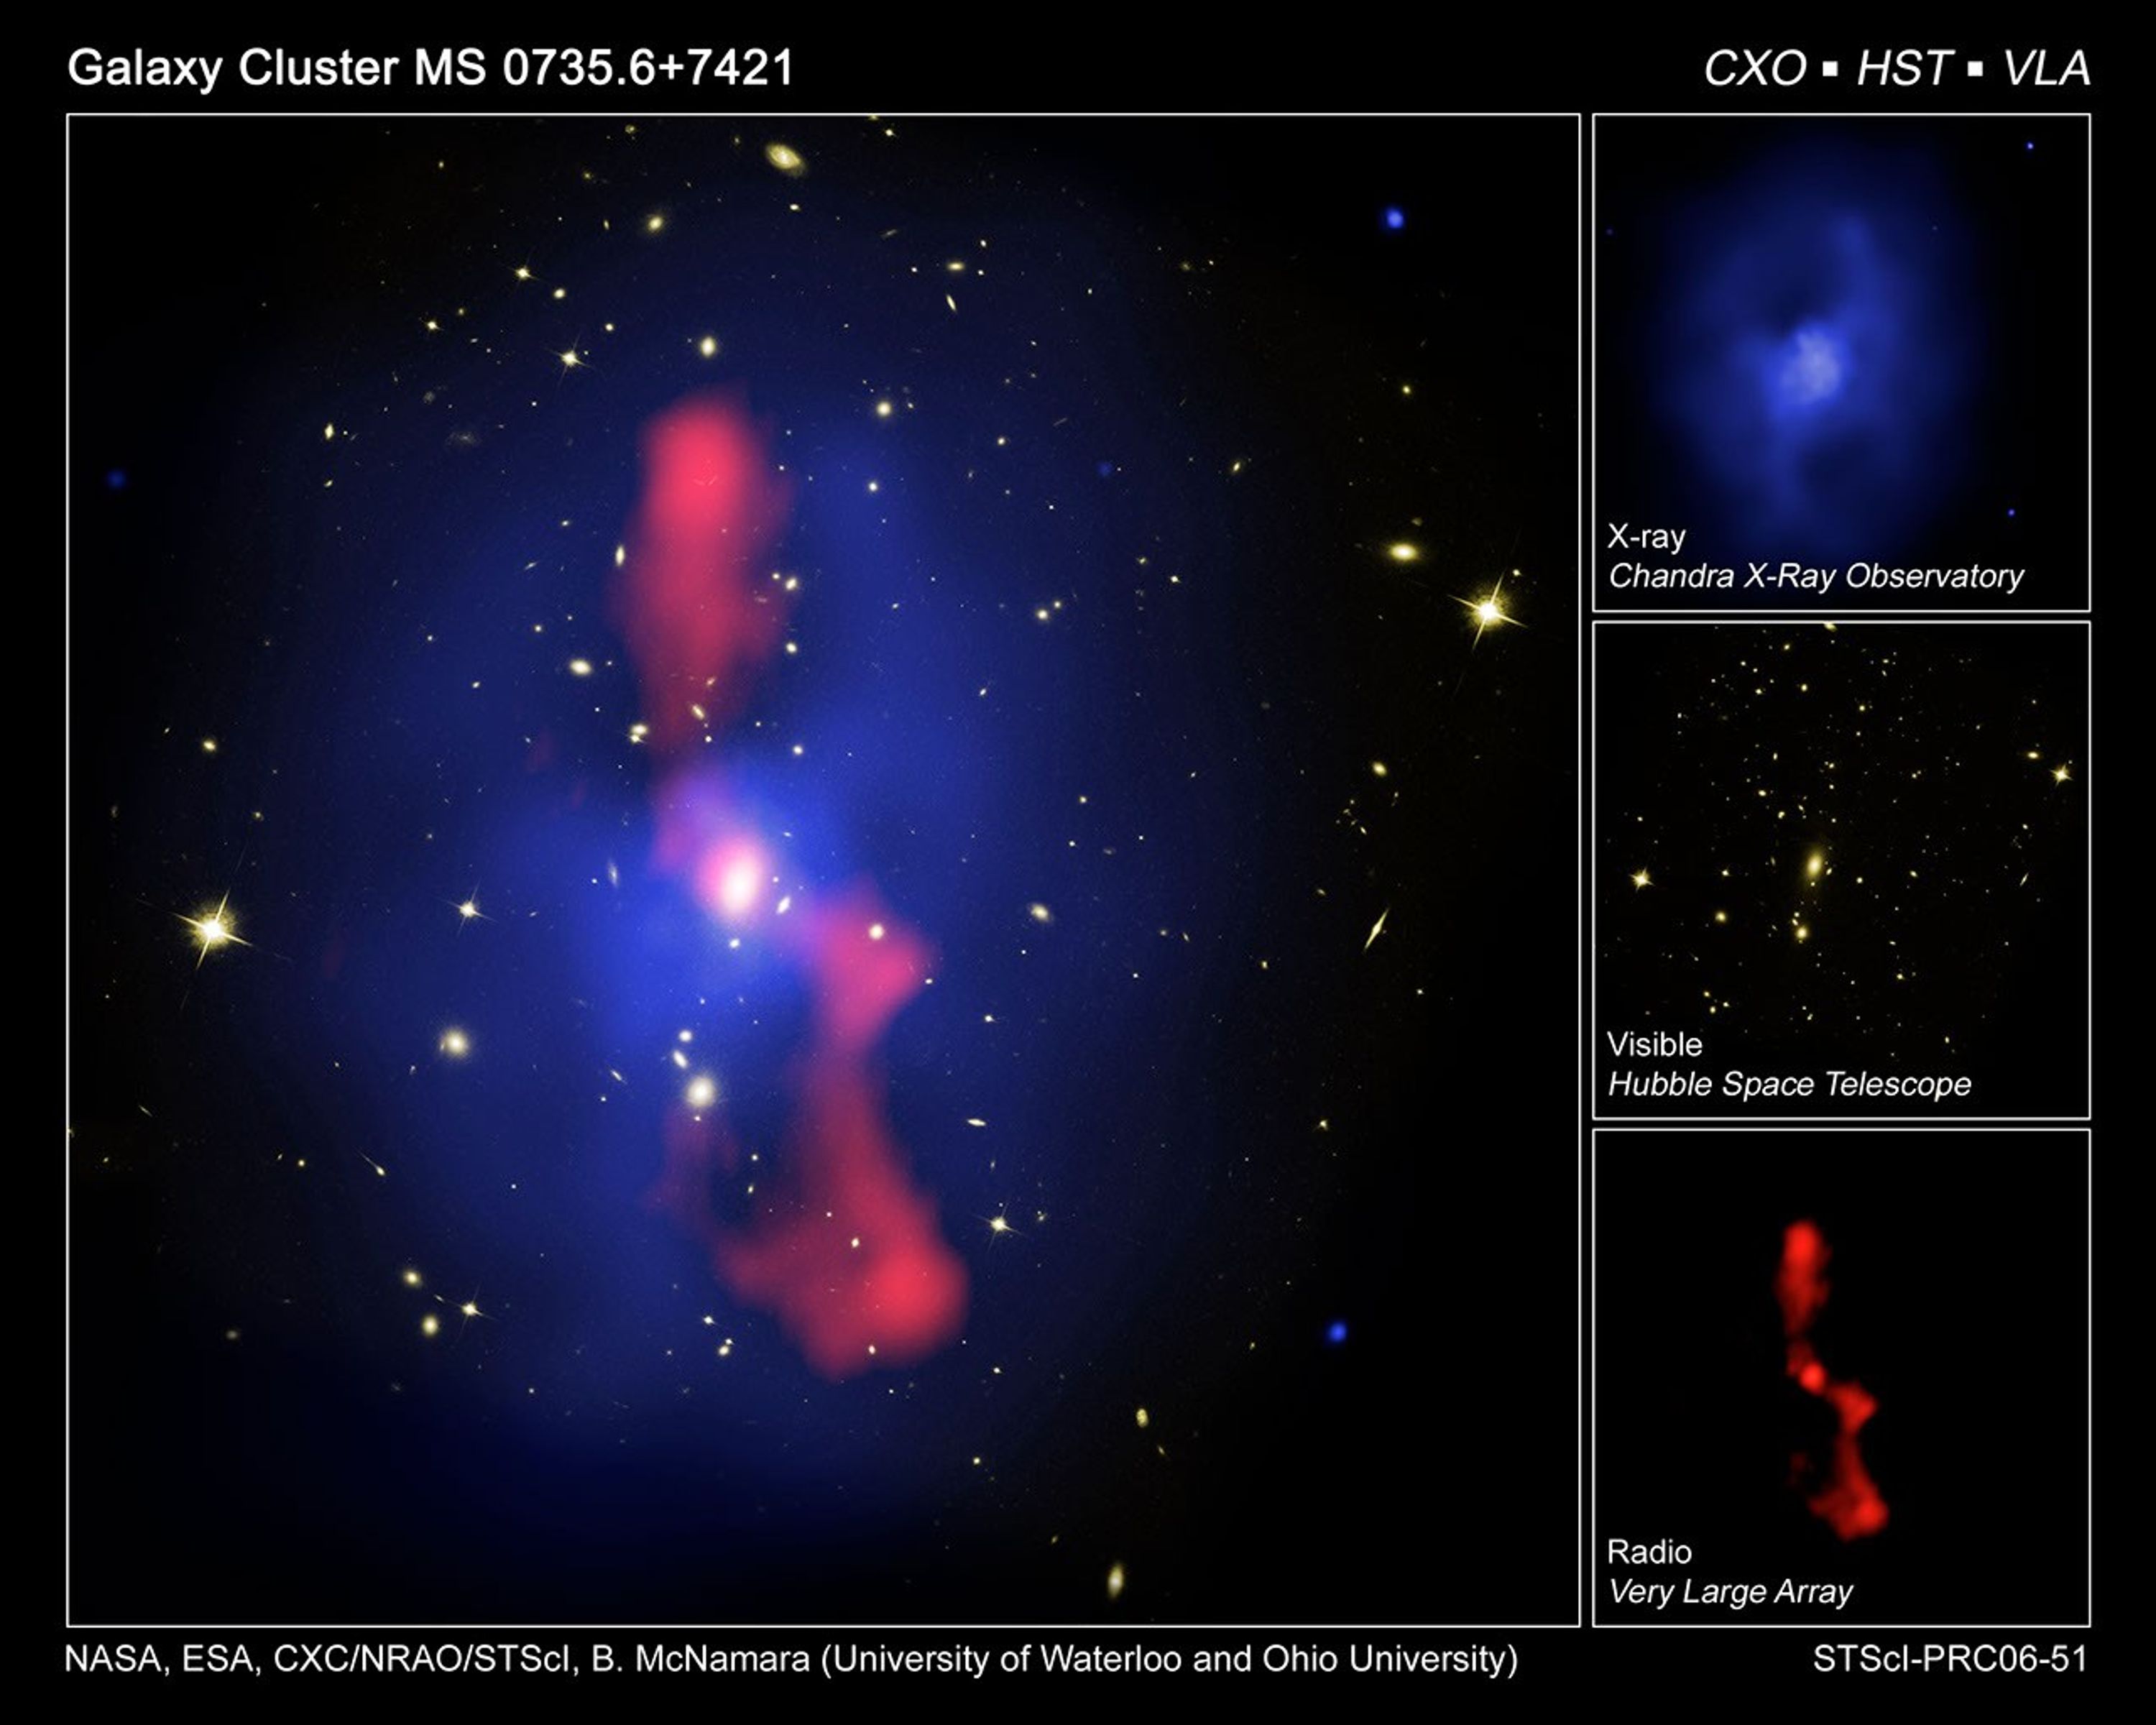
Galaxy Cluster MS 0735
About the Object
- R.A. PositionR.A. PositionRight ascension – analogous to longitude – is one component of an object's position.07h 41m 50.2s
- Dec. PositionDec. PositionDeclination – analogous to latitude – is one component of an object's position.74° 14' 51.0"
- ConstellationConstellationOne of 88 recognized regions of the celestial sphere in which the object appears.Camelopardalis
- DistanceDistanceThe physical distance from Earth to the astronomical object. Distances within our solar system are usually measured in Astronomical Units (AU). Distances between stars are usually measured in light-years. Interstellar distances can also be measured in parsecs.About 2.6 billion light years
- DimensionsDimensionsThe physical size of the object or the apparent angle it subtends on the sky.4 arcminutes (3 million light-years or 900 kiloparsecs) wide
About the Data
- Data DescriptionData DescriptionProposal: A description of the observations, their scientific justification, and the links to the data available in the science archive.
Science Team: The astronomers who planned the observations and analyzed the data. "PI" refers to the Principal Investigator.This image was created from HST data from the following proposal 10495: B. McNamara (Ohio University), M. Wise (Massachusetts Institute of Technology), and P. Nulsen (Harvard-Smithsonian Astrophysical Observatory). - InstrumentInstrumentThe science instrument used to produce the data.HST>ACS/WFC, CXO>ACIS, and VLA>"A" Configuration
- Exposure DatesExposure DatesThe date(s) that the telescope made its observations and the total exposure time.February 1, 2006 (HST), November 30, 2003 (CXO), and October 24, 2004 (VLA)
- Object NameObject NameA name or catalog number that astronomers use to identify an astronomical object.MS 0735.6+7421, Galaxy Cluster MS 0735
- Object DescriptionObject DescriptionThe type of astronomical object.Galaxy Cluster
- Release DateNovember 2, 2006
- Science ReleaseHost Galaxy Cluster to Largest Known Radio Eruption
- Credit
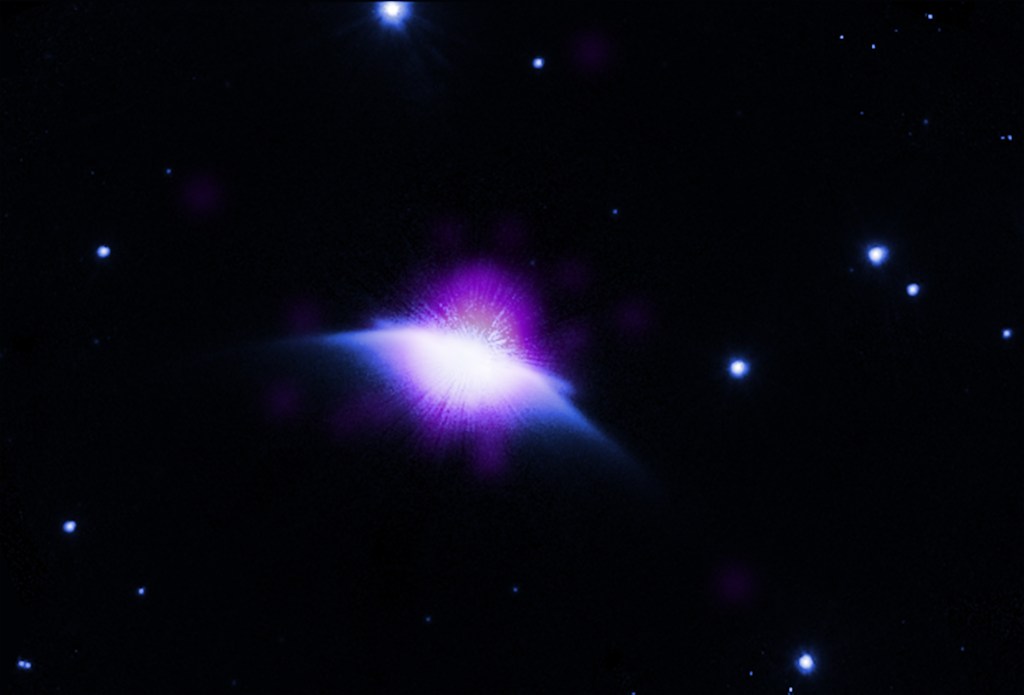
This image is a composite of many separate exposures made by several different instruments from the three missions listed above. The color results from assigning different hues (colors) to each monochromatic image. In this case, the assigned colors are: Blue (CXO: X-ray Yellow-green (HST): visible Red (VLA): radio

Related Images & Videos


X-ray Image of Galaxy Cluster MS 0735
This image of galaxy cluster MS 0735.6+7421 was taken by the Chandra X-ray Observatory in November 2003. Diffuse, hot gas with a temperature of nearly 50 million degrees permeates the space between the galaxies in the cluster. The gas emits X-rays, which are seen as blue in this...

Visible-Light Image of Galaxy Cluster MS 0735
This image of galaxy cluster MS 0735.6+7421 was taken with NASA's Hubble Space Telescope in February 2006. The Advanced Camera for Surveys image shows dozens of galaxies bound together by gravity. Diffuse, hot gas with a temperature of nearly 50 million degrees permeates the...

Radio Image of Galaxy Cluster MS 0735
This radio image of galaxy cluster MS 0735.6+7421 was taken by NRAO's Very Large Array (VLA) in October 2004. The radio image shows jets of high energy particles ejected from a supermassive black hole, which is buried in the middle of the large central galaxy. The jets created...
Share
Details
Claire Andreoli
NASA’s Goddard Space Flight Center
Greenbelt, Maryland
claire.andreoli@nasa.gov