


1 min read
Too Fast, Too Furious: A Galaxy’s Fatal Plunge
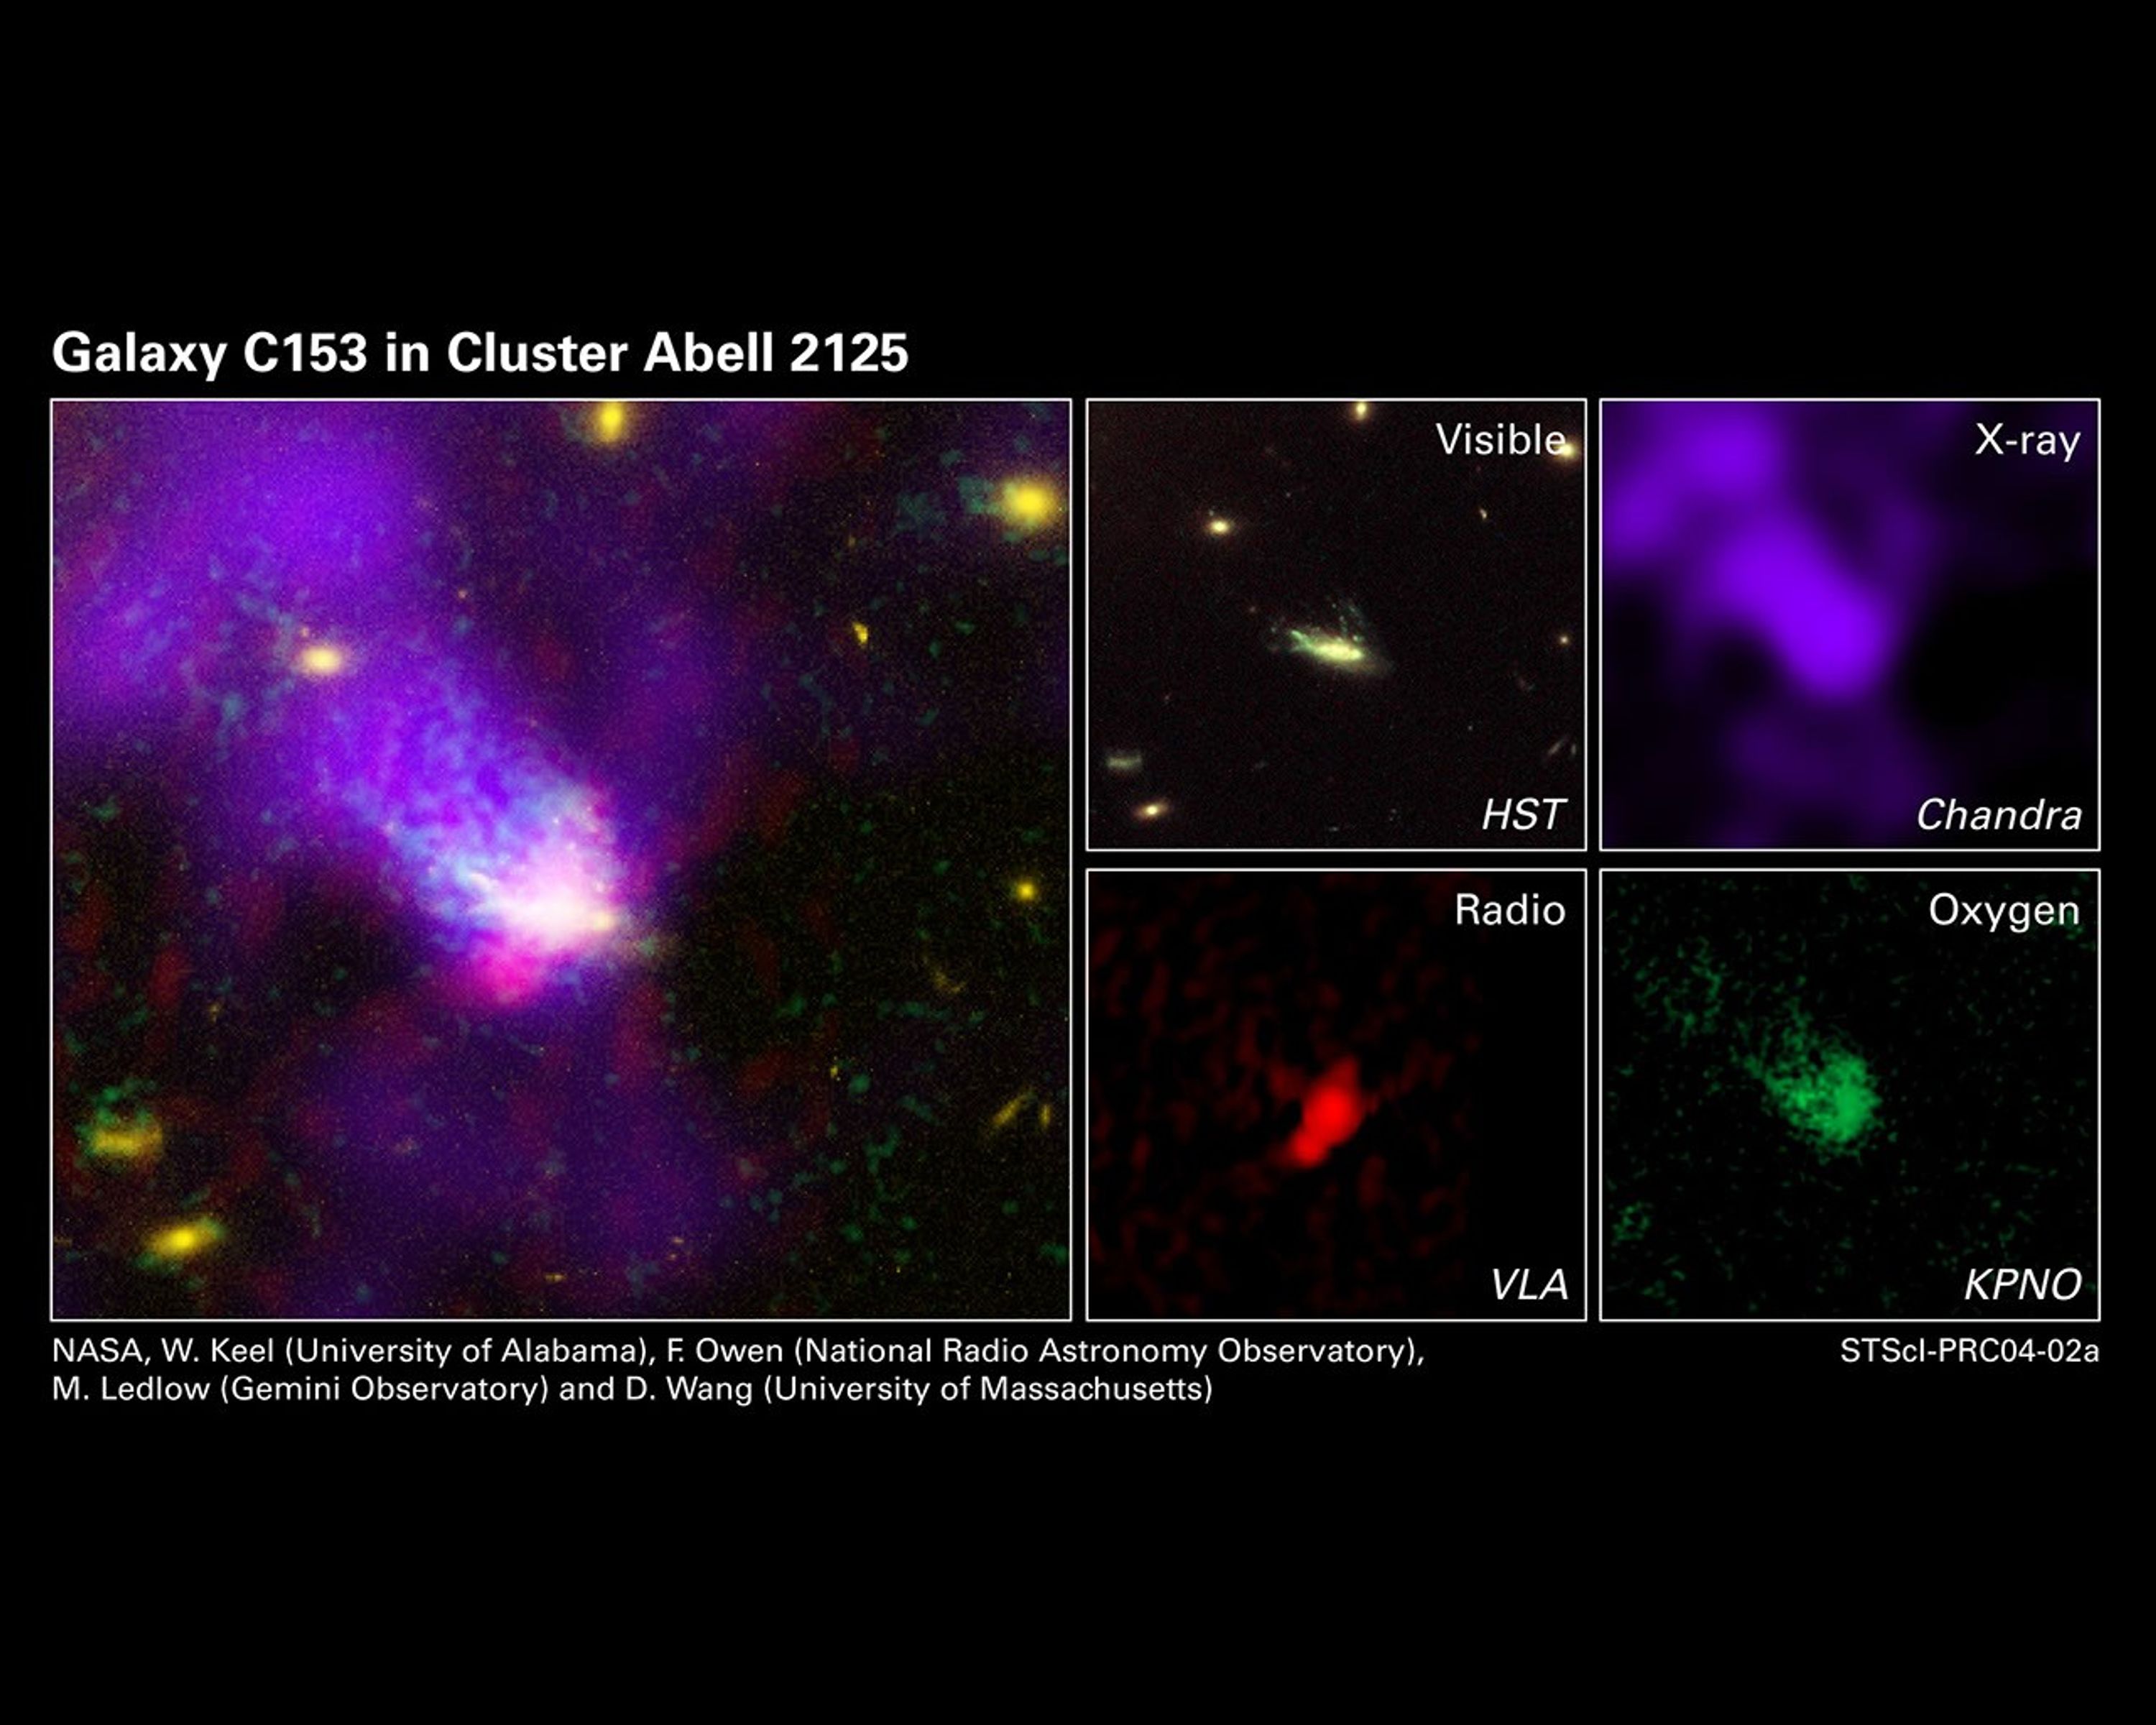
These images offer a dramatic look at a spiral galaxy like our Milky Way being ripped apart as it races at 4.5 million miles per hour through the heart of a distant cluster of galaxies. The images, taken over several wavelengths, provide evidence of the "galactic assault and battery," namely, gas being stripped from the doomed galaxy, called C153.
The composite photograph at left was made by combining the four images at right, taken in X-ray, radio, and visible wavelengths as well as the green light of oxygen gas. Astronomers studied the galaxy across several wavelengths to trace how stars, gas, and dust are being tossed around and torn from the fragile galaxy.
The composite image at left shows long streamers of gas flowing from the galaxy as it travels through the cluster, called Abell 2125. Hot gas from the cluster is stretching the galaxy's cooler gas into long streamers. Velocity measurements of several hundred galaxies in the cluster indicate that C153 is moving away from Earth within the cluster. The image, therefore, shows the streaking tail of "stripped gas." The image spans about 1 million light-years across. Abell 2125 is about 3 billion light-years away, on the boundary between the constellations Ursa Minor and Draco.
The visible-light image [above, right], taken by the Wide Field Planetary Camera 2 aboard NASA's Hubble Space Telescope, reveals intricate detail in the structure of stars and dust within C153. The galaxy exhibits evidence of a large-scale disturbance that has left its star-forming regions concentrated to one side of its disk and beyond. Dust features are twisted into chaotic patterns, obscuring any spiral pattern the galaxy once had.
X-ray emission [above, right], imaged by the Chandra X-ray Observatory, shows a gas tail extending from C153, which roughly matches the glowing gas tail observed in visible light. The temperature of the gas tail is cooler than the surrounding gas. This temperature difference is further evidence that gas is being "stripped" from the galaxy. The hotter gas is so diffuse that it cannot be seen in the image.
Radio observations [below, right] depict high-energy particles as they spiral through the galaxy's magnetic field, with some escaping in a perpendicular direction to the galaxy's disk. The particles probably came from an energetic black hole that was fueled by a collision between two galaxy clusters. This emission first marked C153 as unusual, leading scientists to conduct further observations.
The image [below, right], taken by the 4-meter Mayall telescope at Kitt Peak National Observatory, isolated the light from glowing oxygen gas. This view shows a tail forming as gas is pulled from the galaxy and stretched into long streamers that extends for about 200,000 light-years.
About the Object
- R.A. PositionR.A. PositionRight ascension – analogous to longitude – is one component of an object's position.15h 41m 9.76s
- Dec. PositionDec. PositionDeclination – analogous to latitude – is one component of an object's position.66° 15' 45.0"
- ConstellationConstellationOne of 88 recognized regions of the celestial sphere in which the object appears.Ursa Major
- DistanceDistanceThe physical distance from Earth to the astronomical object. Distances within our solar system are usually measured in Astronomical Units (AU). Distances between stars are usually measured in light-years. Interstellar distances can also be measured in parsecs.3 billion light-years (920 million parsecs)
- DimensionsDimensionsThe physical size of the object or the apparent angle it subtends on the sky.This image is 34 arcseconds (500,000 light-years or 150,000 parsecs) wide.
About the Data
- Data DescriptionData DescriptionProposal: A description of the observations, their scientific justification, and the links to the data available in the science archive.
Science Team: The astronomers who planned the observations and analyzed the data. "PI" refers to the Principal Investigator.HST Data: [7279] F. Owen (NRAO), W. Keel (U. AL), M. Ledlow (Gemini Obs.), G. Morrison (UNM), V. Andersen (U. AL) Chandra Data: [02800347] Q. Daniel Wang (U Mass.) KPNO Data: [0214] F. Owen (NRAO), W. Keel (U. Alabama), R. Windhorst (ASU), E. Richards (U. Alabama) VLA Data: [AO137/AO152] F. Owen (NRAO) - InstrumentInstrumentThe science instrument used to produce the data.HST>WFPC2, CXO>ACIS-I, KPNO 4-m>CCD Mosaic, and VLA>A and B arrays
- Exposure DatesExposure DatesThe date(s) that the telescope made its observations and the total exposure time.September 1999 (HST), August 2001 (CXO), June 2000 (KPNO), and April - May 1998 (VLA)
- FiltersFiltersThe camera filters that were used in the science observations.WFPC2: F606W and F814W ACIS-I: 0.5-2 keV CCD Mosaic: B and 4686 A and B arrays: 1.36 Ghz and 21.9 cm
- Object NameObject NameA name or catalog number that astronomers use to identify an astronomical object.C153
- Object DescriptionObject DescriptionThe type of astronomical object.Galaxy C153 in Cluster Abell 2125
- Release DateJanuary 6, 2004
- Science ReleaseToo Fast, Too Furious: A Galaxy’s Fatal Plunge
- CreditNASA, W. Keel (U Alabama), F. Owen (NRAO), M. Ledlow (Gemini Obs.), and D. Wang (U Mass.)
Yellow: Visible (HST) Violet: X-ray (CXO) Green: Oxygen (KPNO) Red: Radio (VLA)

Related Images & Videos


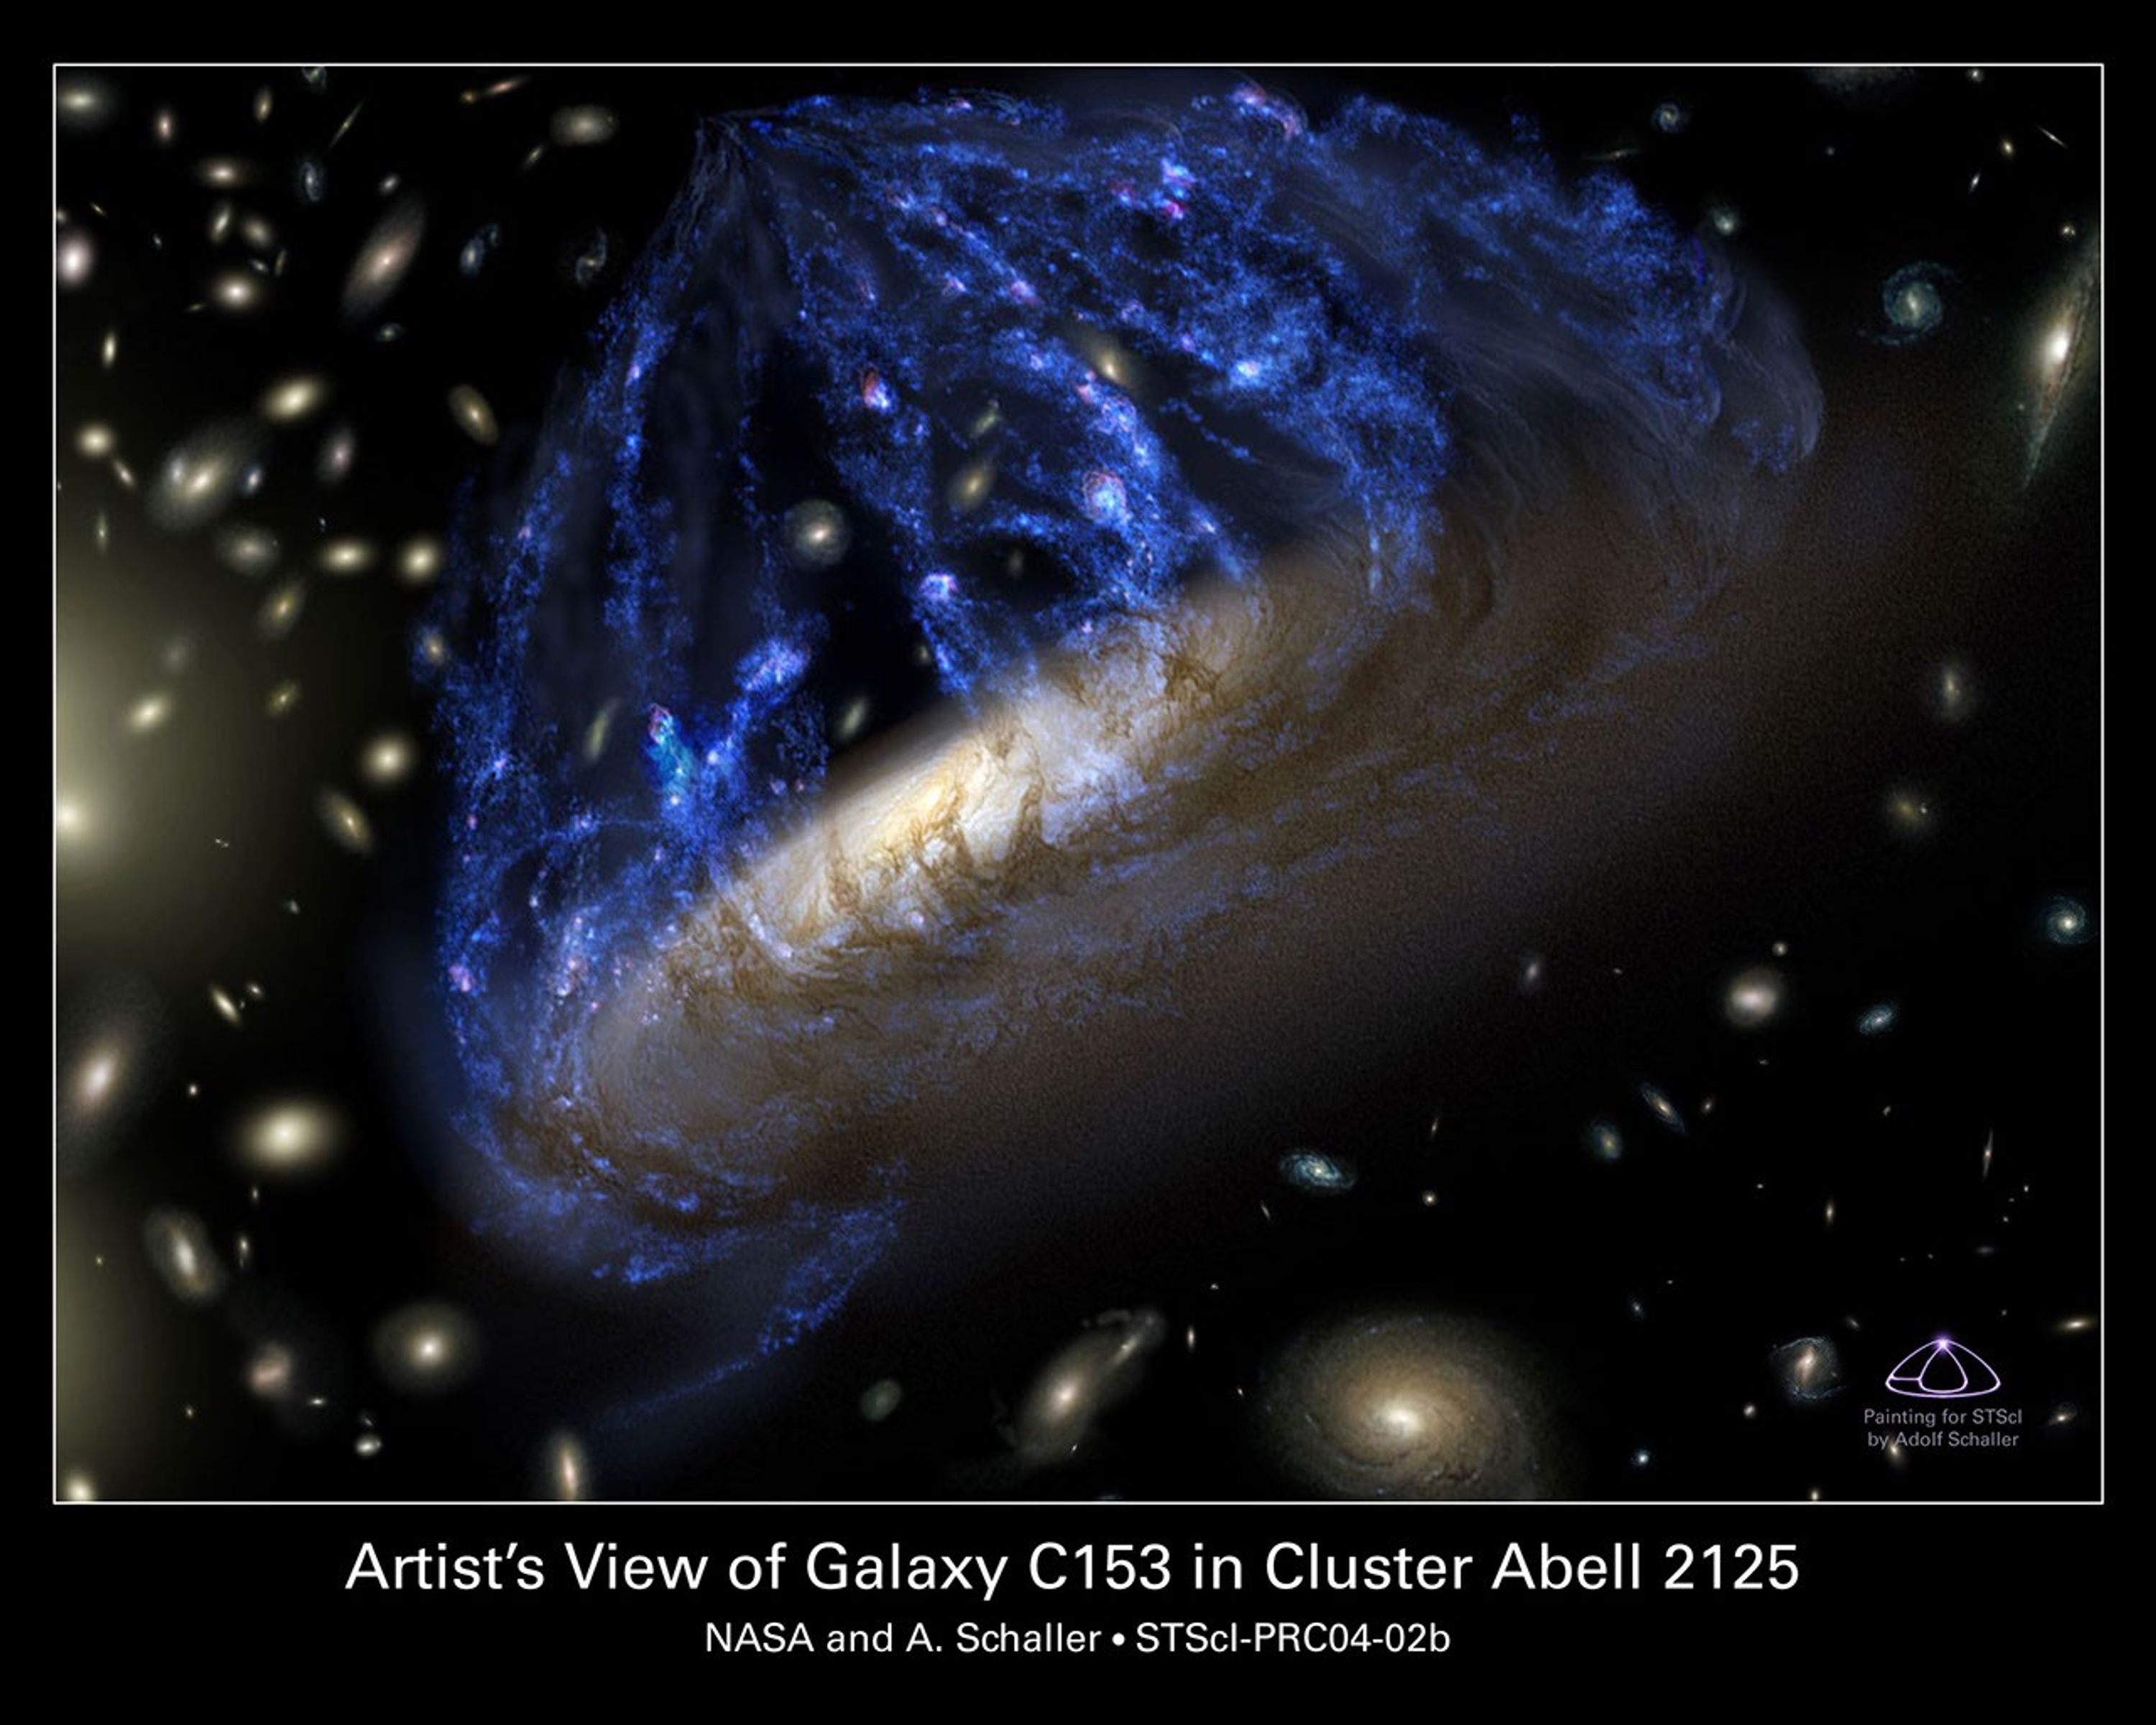
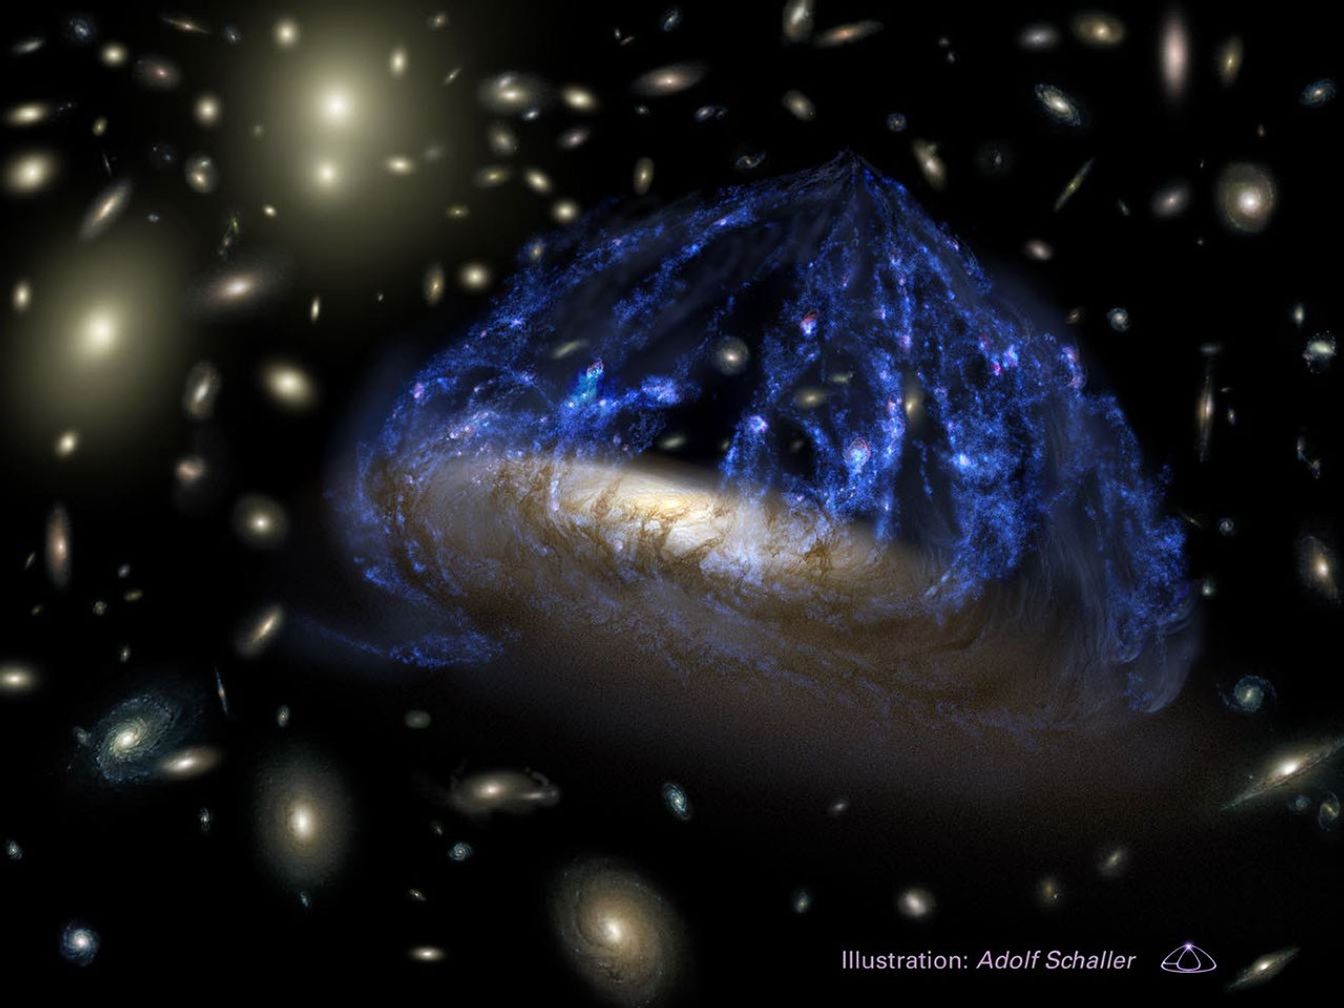
A Disintegrating Galaxy Plows Through Space
This is an artist's conception of the spiral galaxy C153. The galaxy looks peculiar because it is plowing through the heart of a distant galaxy cluster at 4.5 million miles per hour. Gas compressed along the galaxy's leading edge, like snow before a plow, ignited a firestorm of...
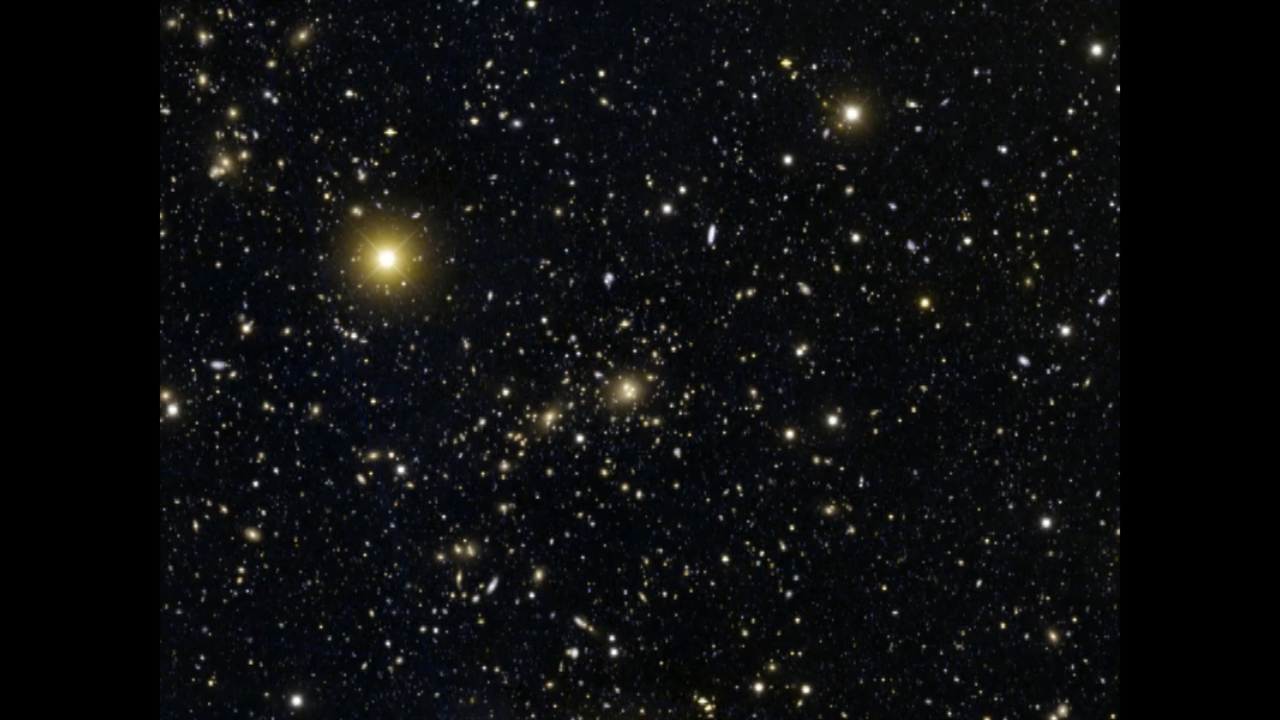
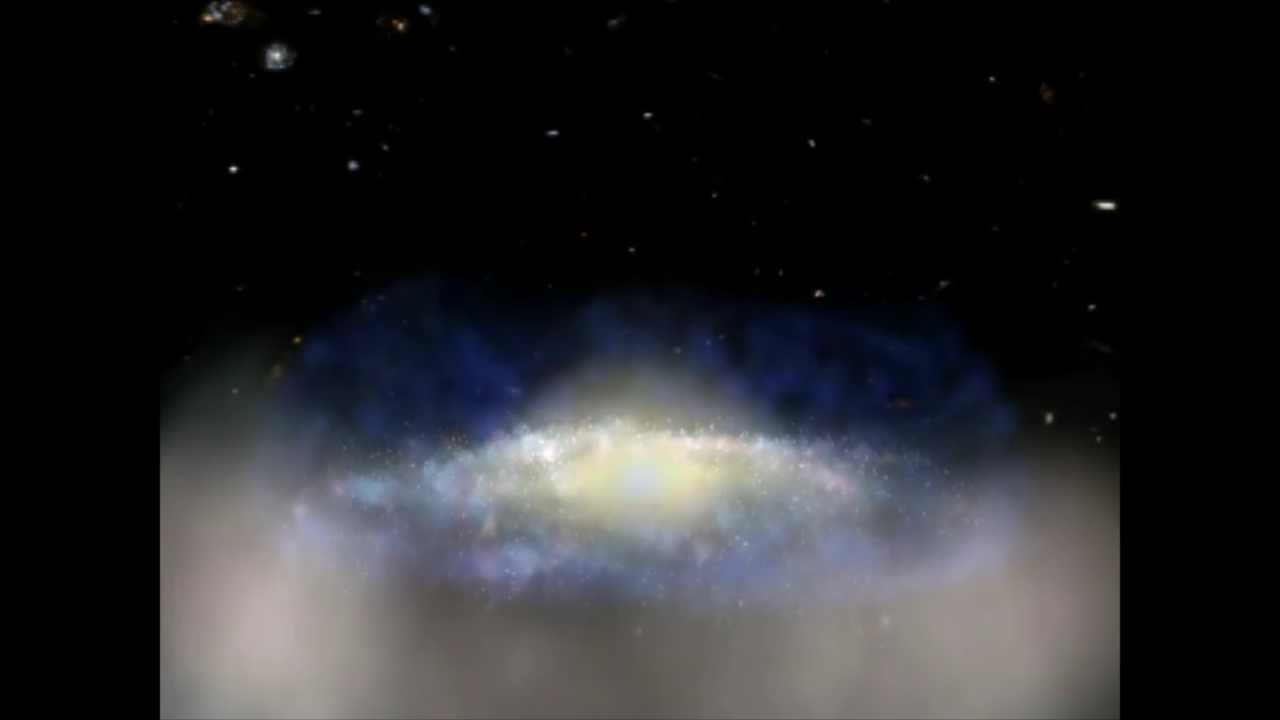
Zoom into the Spiral Galaxy C153
A Zoom into the C153 spiral galaxy found in the galaxy cluster Abell 2125. The initial view moves from the NOAO telescope mosaic into the Hubble Wide Field Planetary Camera 2 image of C153. This Hubble image then dissolves into a colorful composite detail of X-ray, radio, UV and...
Interview with Dr. William Keel (1st of 4 clips): What's Happening in C153
First of four interview clips with Dr. William Keel, Professor of Astronomy at the University of Alabama. Topic discussions on what is happening in galaxy C153, the scientific implications, how this could pertain to us and why the different observations were used.
Interview with Dr. William Keel (2nd of 4 clips): Scientific Implications
Second of four interview clips with Dr. William Keel, Professor of Astronomy at the University of Alabama. Topic discussions on what is happening in galaxy C153, the scientific implications, how this could pertain to us and why the different observations were used.

Interview with Dr. William Keel (3rd of 4 clips): Pertains to Us
Third of four interview clips with Dr. William Keel, Professor of Astronomy at the University of Alabama. Topic discussions on what is happening in galaxy C153, the scientific implications, how this could pertain to us and why the different observations were used.

Interview with Dr. William Keel (4th of 4 clips): Different Observations
Fourth of four interview clips with Dr. William Keel, Professor of Astronomy at the University of Alabama. Topic discussions on what is happening in galaxy C153, the scientific implications, how this could pertain to us and why the different observations were used.
Share
Details
Claire Andreoli
NASA’s Goddard Space Flight Center
Greenbelt, Maryland
claire.andreoli@nasa.gov