


1 min read
Exoplanet WD 1856 b (Transmission Spectrum)
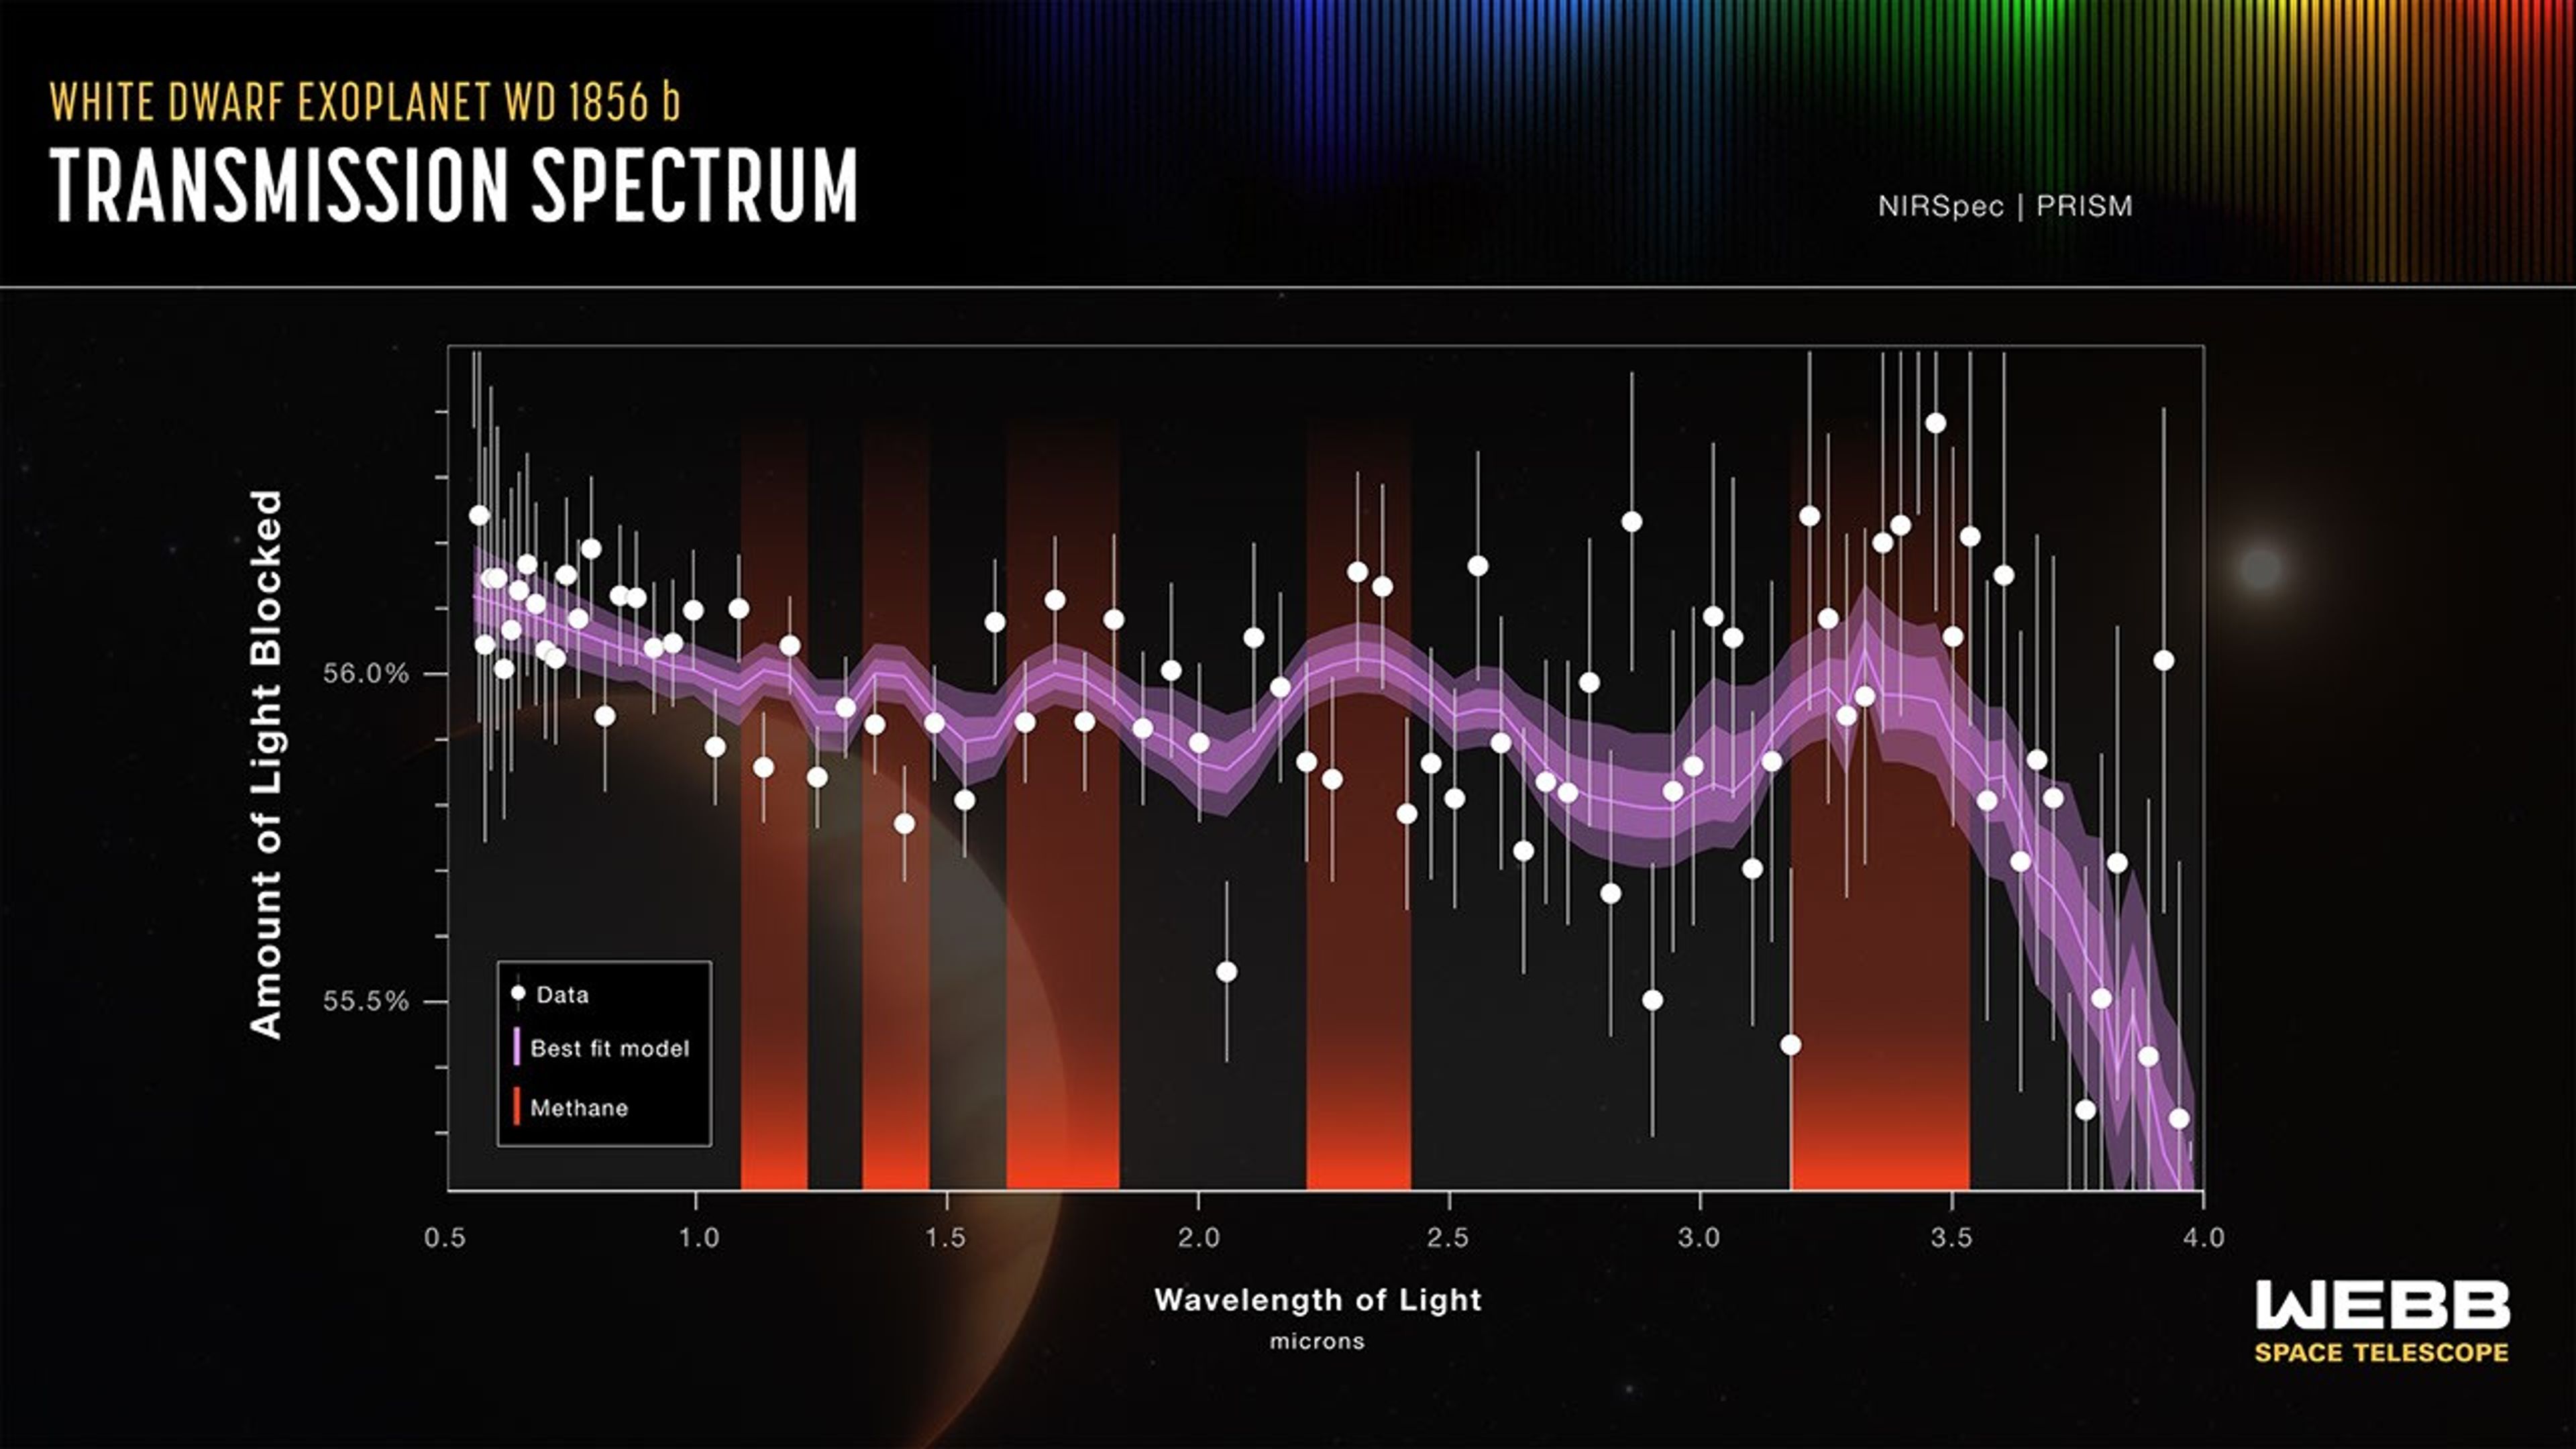
NASA’s James Webb Space Telescope measured the constituents of exoplanet WD 1856 b as it passed in front of its star, finding signs of methane. WD 1856 b orbits a white dwarf star the size of Earth. As a result, the planet blocks more than half of the star’s light. The red bands indicate where bumps in the spectrum show that this planet’s atmosphere contains methane.
- Release DateJuly 1, 2026
- Science ReleaseNASA’s Webb Studies How Planet Survived Death of its Star
- CreditIllustration: NASA, ESA, CSA, Joseph Olmsted (STScI)
Related Images & Videos
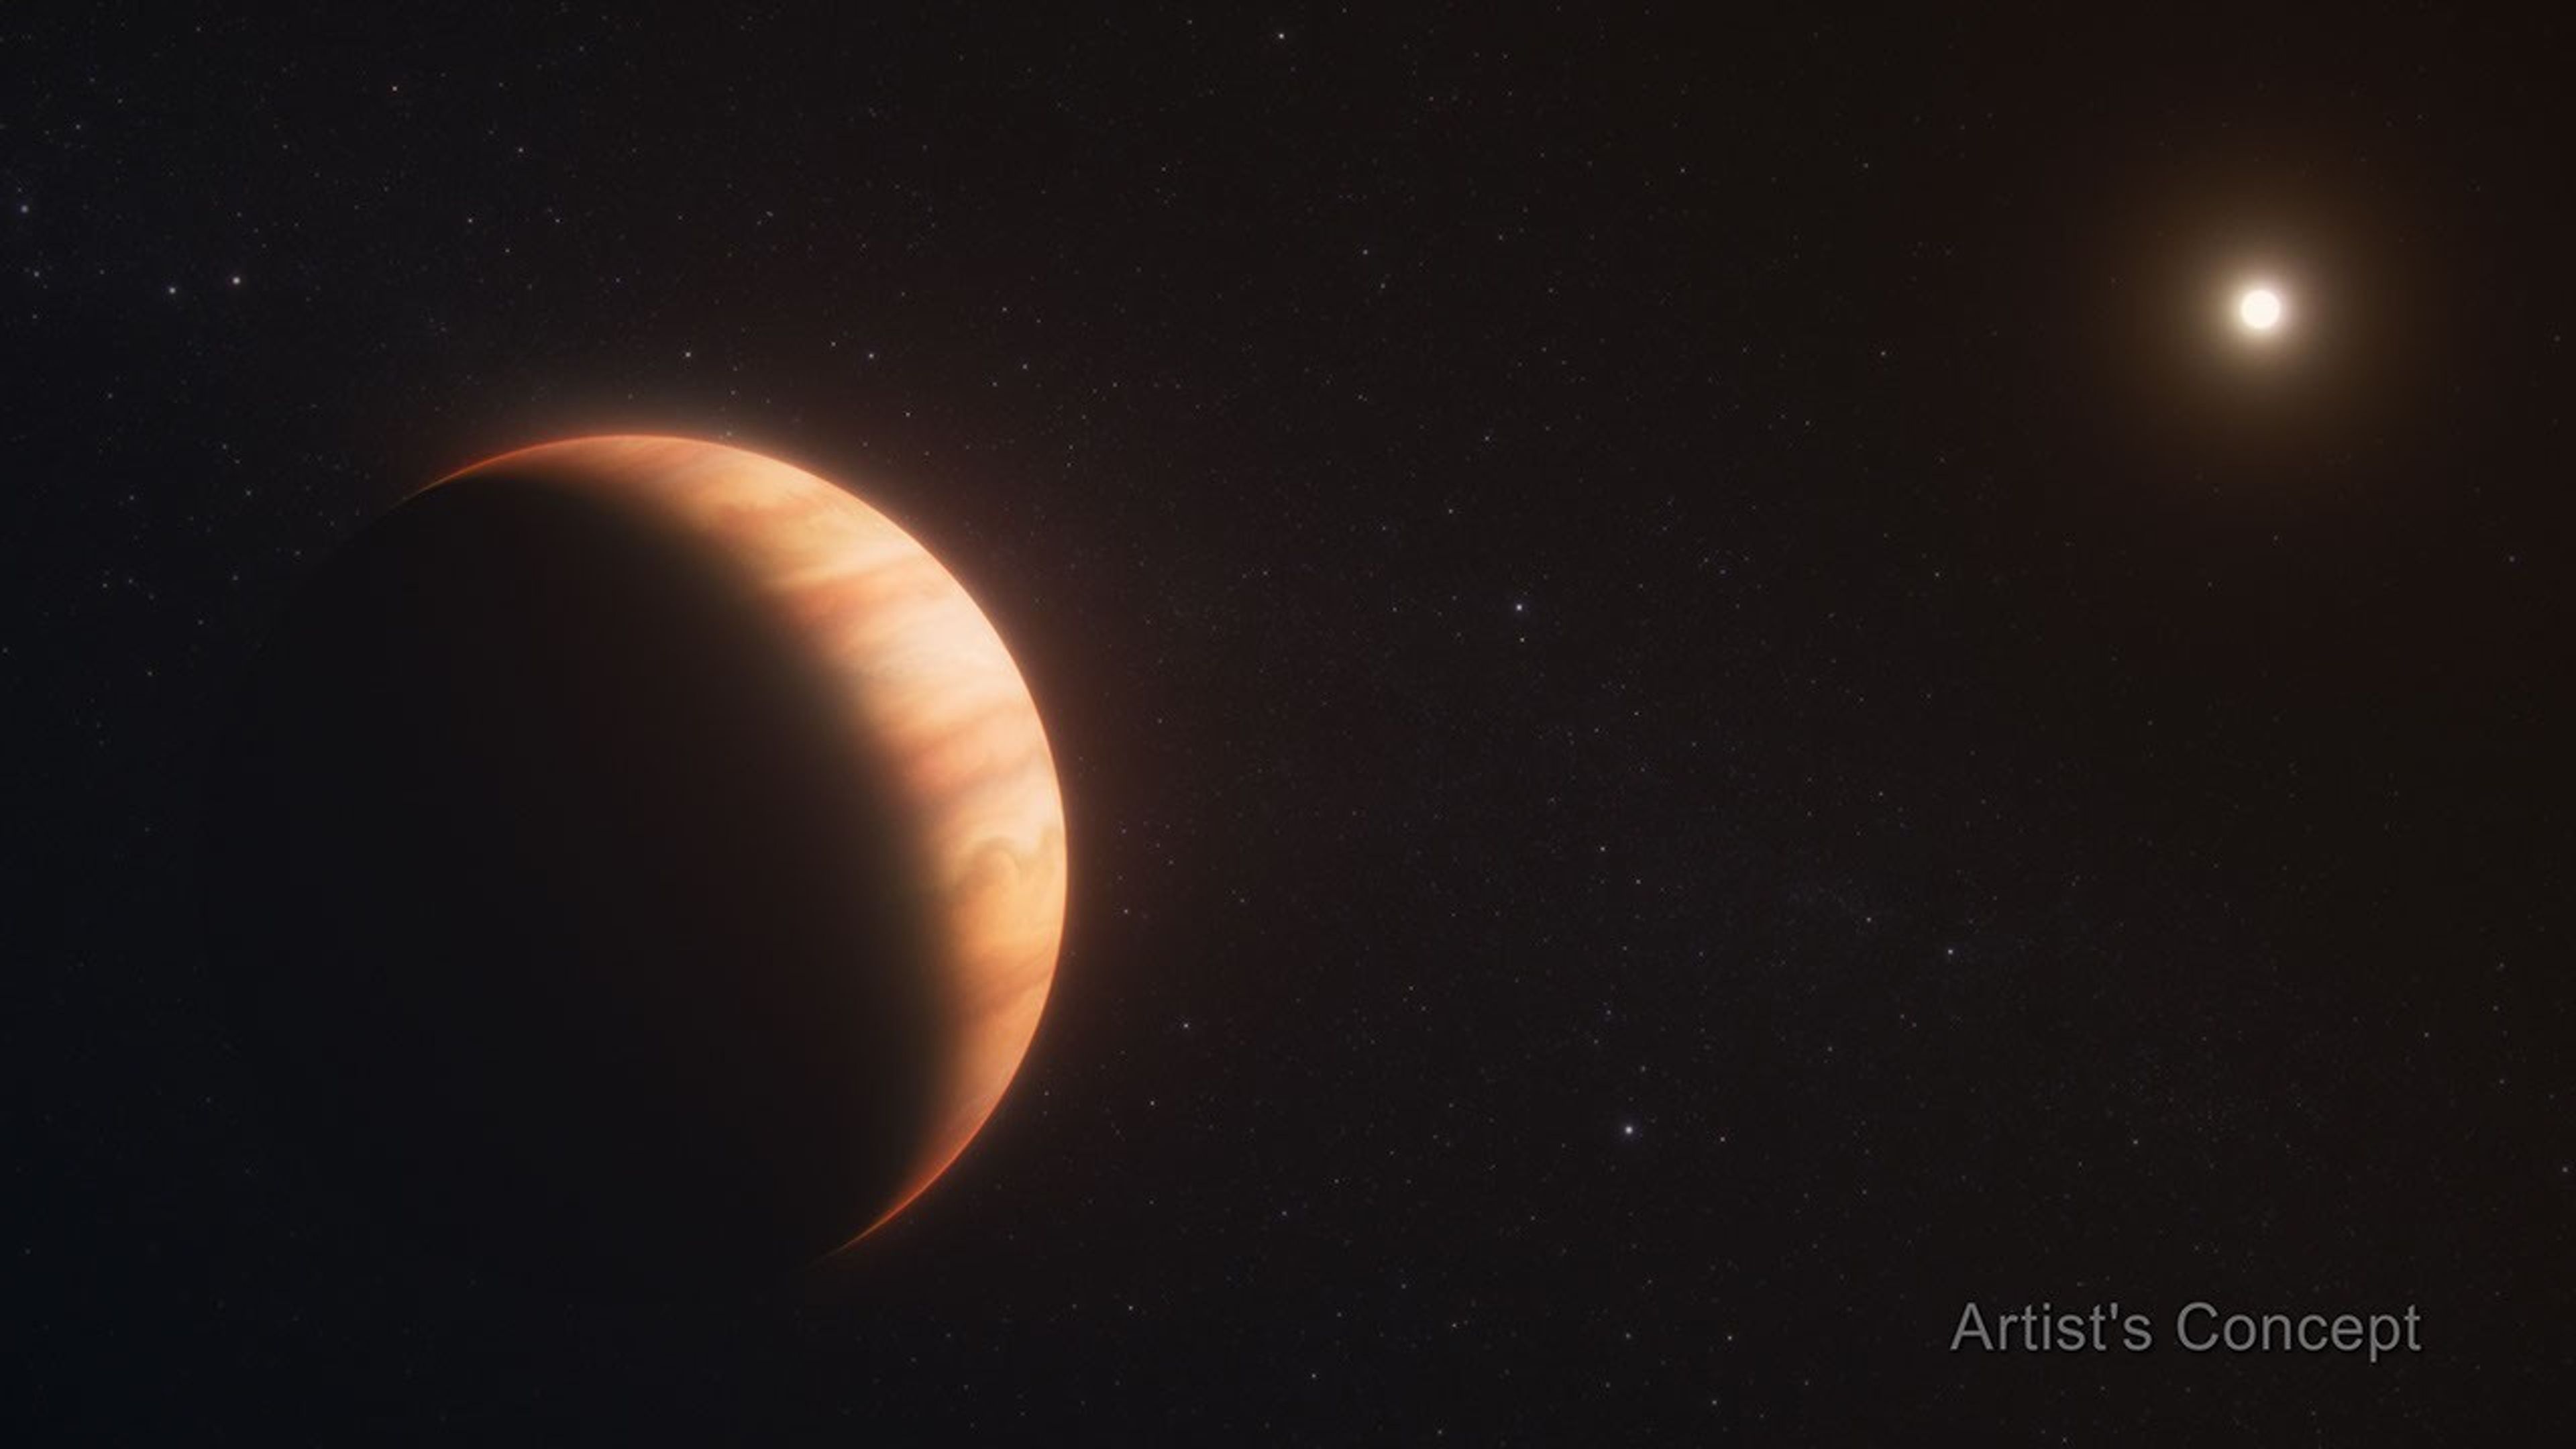
Exoplanet WD 1856 b (Artist's Concept)
Exoplanet WD 1856 b, shown in this artist’s concept, is a gas giant that orbits its star at a distance 50 times closer than Earth orbits the Sun. Observations by NASA’s James Webb Space Telescope determined the planet’s temperature and detected molecules in its atmosphere.
Share
Details
Last Updated
Jul 01, 2026
Contact
Media
Laura Betz
NASA’s Goddard Space Flight Center
Greenbelt, Maryland
laura.e.betz@nasa.gov


