


1 min read
Isolated Planetary-Mass Object SIMP 0136 (NIRSpec Light Curves)
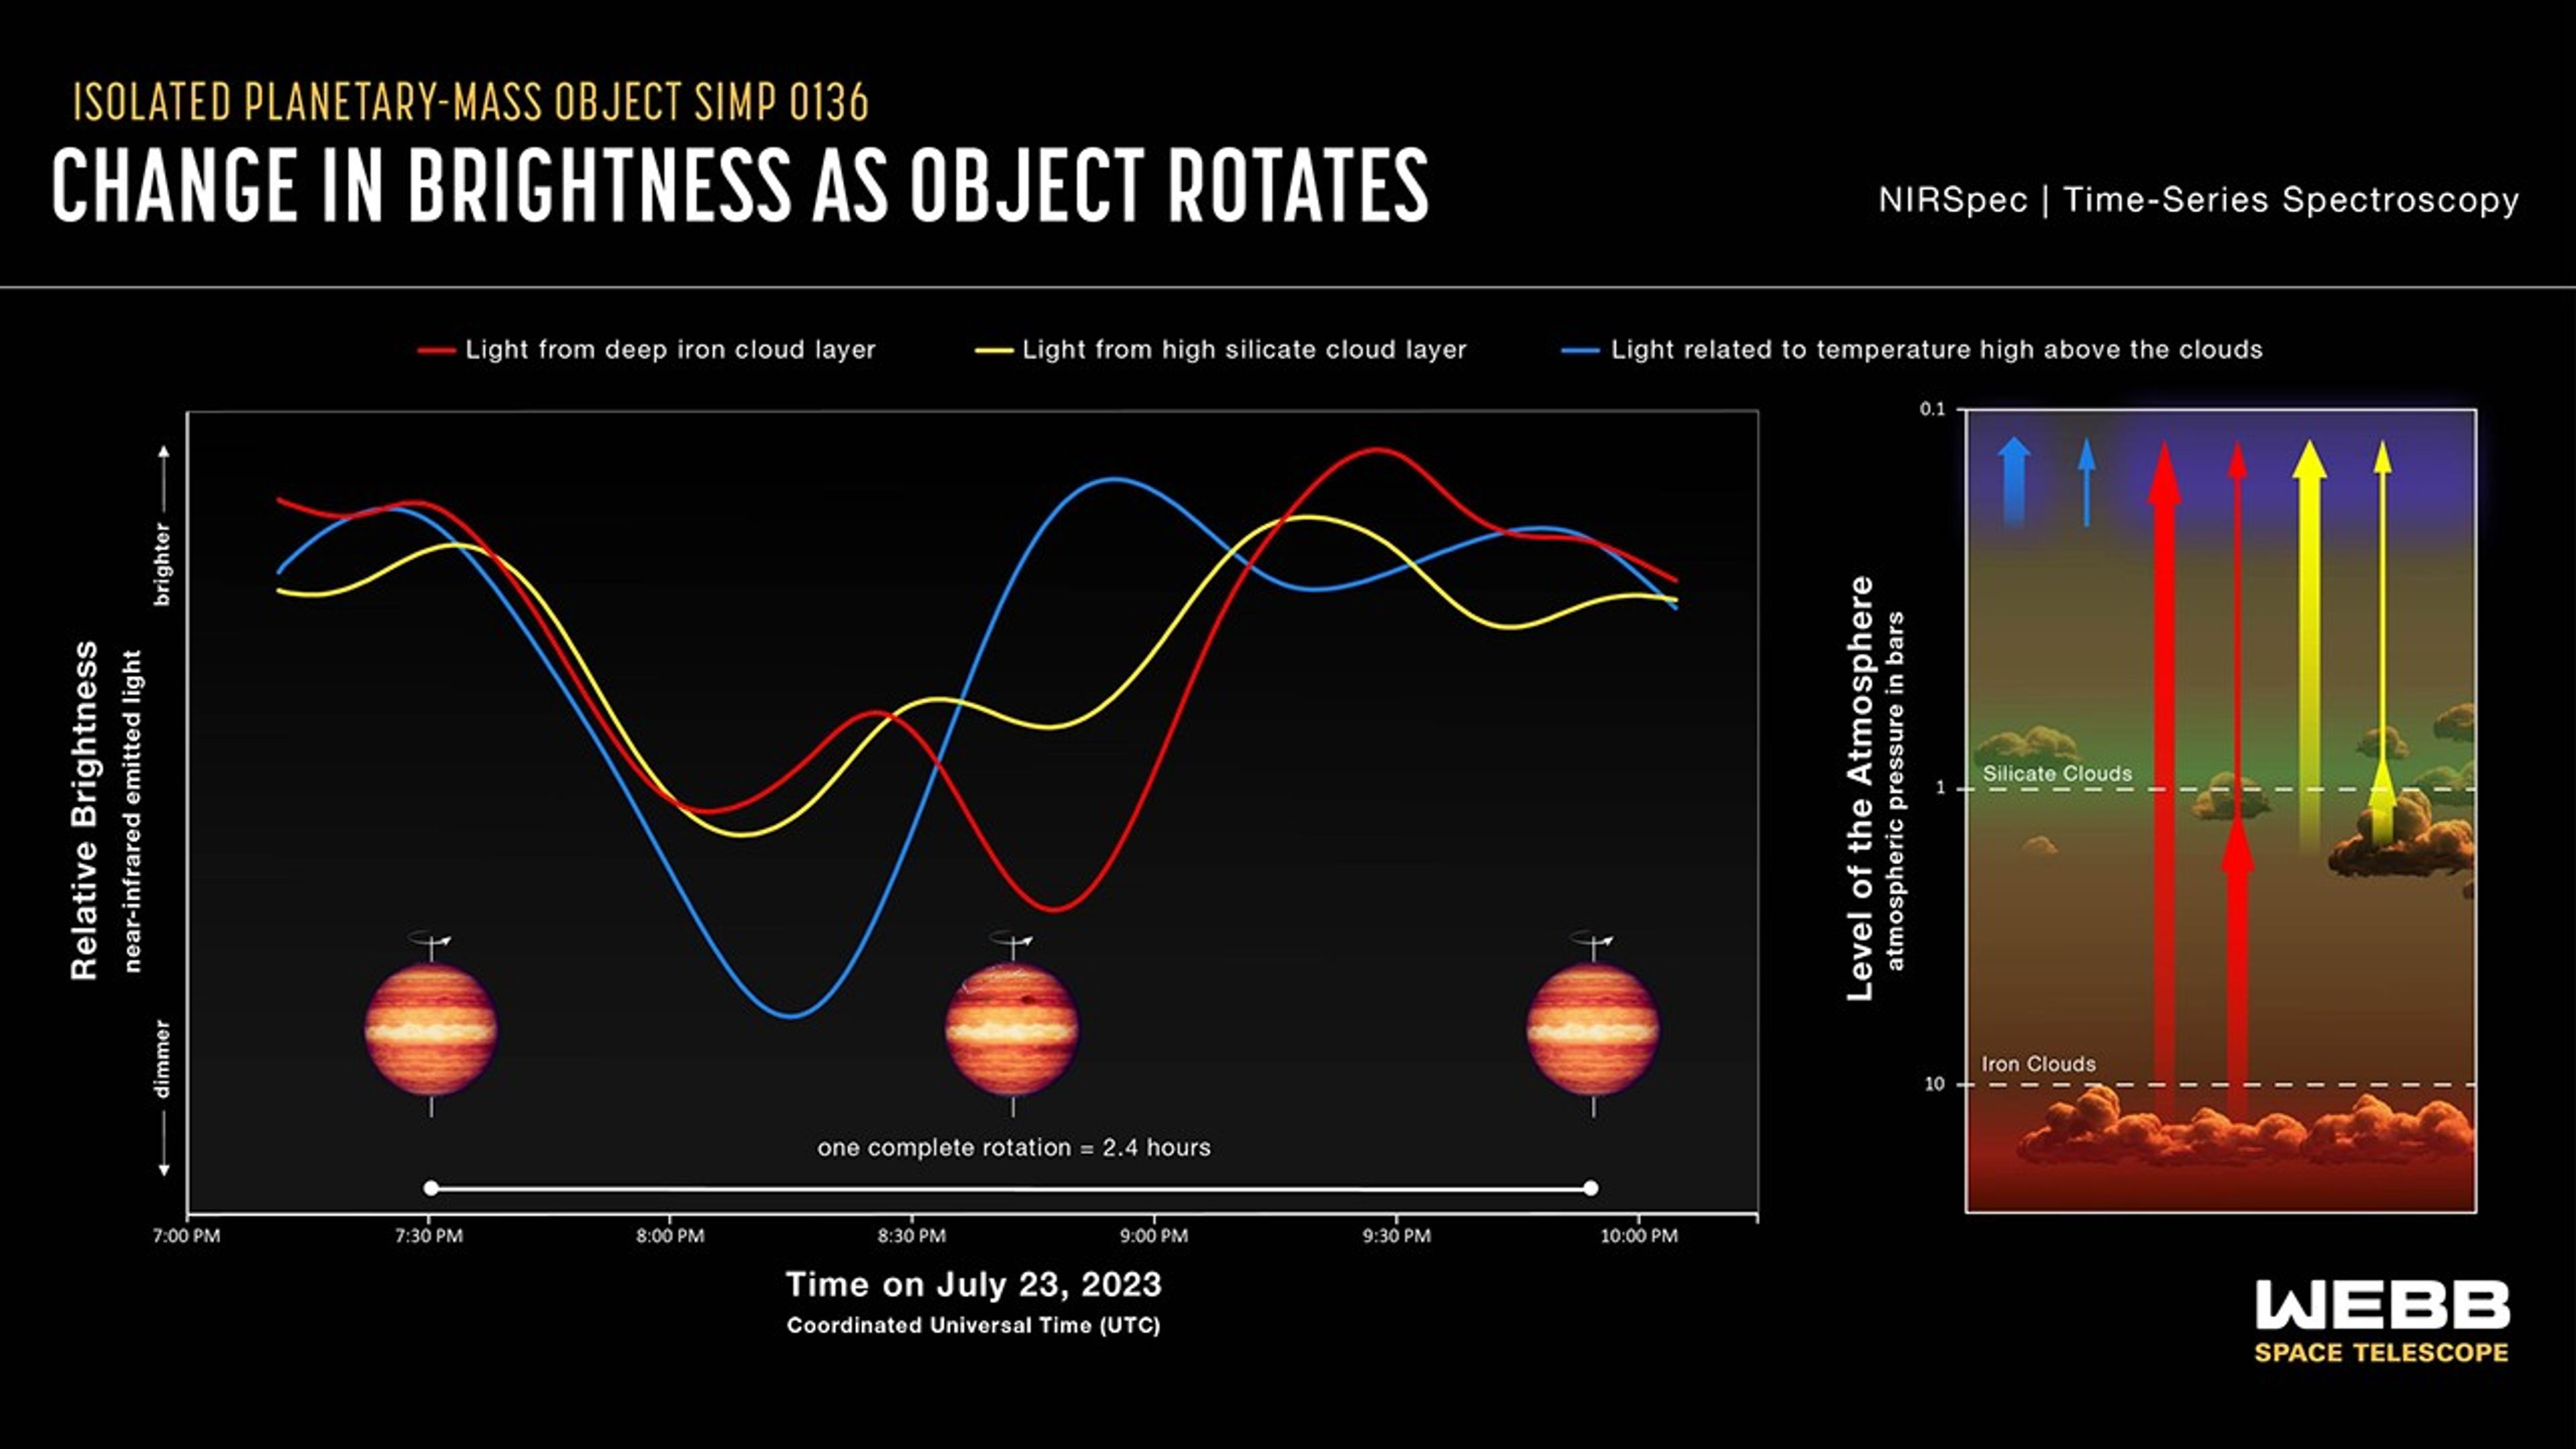
These light curves show the change in brightness of three different sets of wavelengths (colors) of near-infrared light coming from the isolated planetary-mass object SIMP 0136 as it rotated. The light was captured by Webb’s NIRSpec (Near-Infrared Spectrograph), which collected a total of 5,726 spectra — one every 1.8 seconds — over the course of about 3 hours on July 23, 2023. (SIMP 0136 completes one rotation every 2.4 hours.)
By comparing these light curves to models, researchers were able to show that each set of wavelengths probes different depths (pressures) in the atmosphere.
The curve shown in red tracks the brightness of 0.9- to 1.4-micron light thought to originate deep in the atmosphere at a pressure of about 10 bars (about 10 times the air pressure at sea level on Earth), within clouds made of iron particles. The curve shown in yellow tracks the brightness of 1.4- to 2.3-micron light from a pressure of about 1 bar within higher clouds made of tiny grains of silicate minerals. The variations in brightness shown by these two curves is related to patchiness of the cloud layers, which emit some wavelengths of light and absorb others.
The curve shown in blue tracks the brightness of 3.3- to 3.6-micron light that originates high above the clouds at a pressure of about 0.1 bars. Changes in brightness of these wavelengths are related to variations in temperature around the object. Bright “hot spots” could be related to auroras that have been detected at radio wavelengths, or to upwelling of hot gas from deeper in the atmosphere.
The differences in shape of these three light curves show that there are complex variations in SIMP 0136’s atmosphere with depth as well as longitude. If the atmosphere varied around the object in the same way at all depths, the light curves would have similar patterns. If it varied with depth, but not longitude, the light curves would be straight, flat lines.
Note that this graph shows the relative change in brightness for each given set of wavelengths over time, not the difference in absolute brightness between the different sets. At any given time, there is more light coming from the deep atmosphere (light curve in red) than from the upper atmosphere (light curve in blue).
The diagram at the right illustrates the possible structure of SIMP 0136’s atmosphere, with the colored arrows representing the same wavelengths of light shown in the light curves. Thick arrows represent more (brighter) light; thin arrows represent less (dimmer) light.
SIMP 0136 is located within the Milky Way, about 20 light-years from Earth, in the constellation Pisces. It is the brightest isolated planet or brown dwarf visible from the Northern Hemisphere, and is thought to be about 200 million years old. The artist’s concepts are based on Webb’s spectroscopic observations. Webb has not captured a direct image of the object.
Explore this observation on NASA’s Space Telescope Live.
Extended Description and Image Alt Text
Extended Description
Infographic titled “Isolated Planetary-Mass Object SIMP 0136, Change in Brightness as Object Rotates, NIRSpec Time-Series Spectroscopy.”
The graphic has two parts. On the left are light curves showing the change in brightness of three sets of near-infrared wavelengths over time. On the right is a cross-section of the object’s atmosphere, showing the altitude that each set of wavelengths originates and their relationship to cloud layers or temperature.
Key
Below the title is a key that applies to both the light curve and the diagram.
- Solid red line: “Light from deep iron cloud layer”
- Solid yellow line: “Light from high silicate cloud layer”
- Solid blue line: “Light related to temperature high above the clouds”
Light Curves
The left two-thirds of the infographic consists of a graph showing changes in brightness over time.
Axes
The y-axis is labeled “Relative Brightness: near-infrared emitted light,” with an arrow labeled “brighter” pointing upward, and an arrow labeled “dimmer” pointing downward. There are no units or tick marks.
The x-axis is labeled “Time on July 23, 2023, Coordinated Universal Time (UTC)”. The x-axis is labeled in equal increments of 30 minutes, starting at 7:00 PM at the origin on the left and ending at 10:15 PM on the right.
Illustration of Rotating Object
Just above the x-axis is a horizontal line segment that runs from 7:30 PM to 9:50 PM and is labeled “one complete rotation = 2.4 hours.”
Above the line segment are illustrations of a reddish-orange object with horizontal banding of red, orange, and yellow. The illustrations are placed above the beginning of the rotation period line segment at 7:30 pm, above the middle at about 8:40 PM, and above the end of the segment at 9:50 PM. Each includes a vertical rotation axis with an arrow showing that the object is rotating west to east. The faces visible at 7:30 and at 9:50 are the same. The face in the middle illustration shows the opposite side of the object, with a large dark red spot at the upper right that is not visible in the other two views.
Light Curves
There are three light curves, one in red, one in yellow, and one in blue. Each curve has a different shape, with peaks and valleys of different heights and depths occurring at different times during the observation as the object rotates. The curves overlap each other in places. In all three cases, the brightness pattern begins to repeat after 2.4 hours, which is one full rotation.
Diagram
The right one-third of the graphic is a rectangular cross-section of the object’s atmosphere. The diagram shows two levels of clouds and three sets of colored arrows, which match the colors of the three light curves. Along the left side, the diagram is labeled “Level of the Atmosphere: atmospheric pressure in bars,” with tick marks at 10 bars (about one-fifth of the way up from the bottom), 1 bar (middle), and 0.1 bars (at the top). A horizontal dashed line across the lower part of the diagram at 10 bars is labeled “Iron Clouds.” Below this line is a layer of patchy, orange-colored, pillow-like, clouds. A dashed line across the middle at 1 bar is labeled “Silicate Clouds.” Above and below this line are scattered, yellow-green, pillow-shaped clouds. The region between the iron clouds and silicate clouds is cloud-free with a hazy orange-green background, as is the region above the silicate clouds. Near the top, the atmosphere has a blue to gray tinge.
There are three sets of arrows representing the light that is emitted by the planet and detected by the telescope. Each set includes thick segments representing brighter light and thin segments representing dimmer light. Each set of arrows begins at a different level, but all extend up to the top. From left to right:
- Blue: Two short, blue arrows rise up from the upper part of the atmosphere, beginning about one-fifth of the way down from the 0.1 bar mark at the top. The arrow at the left is thick, and passes through a brighter blue background. The arrow at the right is thin, and passes through a darker gray portion of the upper atmosphere.
- Red: Two long, red arrows rise up from the iron clouds below 10 bars along the deep part of the atmosphere. The arrow on the left is thick all the way up. It does not pass through any other clouds. The arrow on the right is thick until it hits a silicate cloud at 1 bar. It then becomes thin and remains thin all the way to the top.
- Yellow: Two medium-length yellow arrows rise up from the silicate cloud layer below the 1 bar mark. The arrow on the left is thick all the way up. It begins in a region with no clouds and does not encounter any clouds. The arrow on the right begins in a silicate cloud. It is thick until it hits another cloud. It then becomes thin and remains thin all the way to the top.
Image Alt Text
Infographic titled “Isolated Planetary-Mass Object SIMP 0136, Change in Brightness as Object Rotates, NIRSpec Time-Series Spectroscopy” with a graph of brightness versus time on the left and an atmospheric cross-section on the right.
About the Object
- R.A. PositionR.A. PositionRight ascension – analogous to longitude – is one component of an object's position.01h 36m 56.56s
- Dec. PositionDec. PositionDeclination – analogous to latitude – is one component of an object's position.+09° 33' 47.31"
- ConstellationConstellationOne of 88 recognized regions of the celestial sphere in which the object appears.Pisces
- DistanceDistanceThe physical distance from Earth to the astronomical object. Distances within our solar system are usually measured in Astronomical Units (AU). Distances between stars are usually measured in light-years. Interstellar distances can also be measured in parsecs.20 light-years (6 parsecs)
About the Data
- Data DescriptionData DescriptionProposal: A description of the observations, their scientific justification, and the links to the data available in the science archive.
Science Team: The astronomers who planned the observations and analyzed the data. "PI" refers to the Principal Investigator.bright object time-series spectroscopy
- InstrumentInstrumentThe science instrument used to produce the data.NIRSpec
- Exposure DatesExposure DatesThe date(s) that the telescope made its observations and the total exposure time.July 23, 2023
- Object NameObject NameA name or catalog number that astronomers use to identify an astronomical object.SIMP 0136
- Object DescriptionObject DescriptionThe type of astronomical object.Isolated Planetary-Mass Object
- Release DateMarch 3, 2025
- Science ReleaseNASA’s Webb Exposes Complex Atmosphere of Starless Super-Jupiter
- CreditIllustration: NASA, ESA, CSA, Joseph Olmsted (STScI)
Related Images & Videos

Isolated Planetary-Mass Object SIMP 0136 (Artist’s Concept)
This artist’s concept shows what the isolated planetary-mass object SIMP 0136 could look like based on recent observations from NASA’s James Webb Space Telescope and previous observations from Hubble , Spitzer, and numerous ground-based telescopes. SIMP 0136 is about 13 times...
Share
Details
Laura Betz
NASA’s Goddard Space Flight Center
Greenbelt, Maryland
laura.e.betz@nasa.gov
NASA, ESA, CSA, Joseph Olmsted (STScI)


