






A Holistic Perspective on Florida’s Wetland Emissions
by Cheryl Doughty, Qing Ying, and Erin Delaria (University of Maryland/NASA’s Goddard Space Flight Center and Ayia Lindquist (SSAI/NASA’s Goddard Space Flight Center
Like other early career researchers who collaborate to address Earth’s most pressing issues, we four scientists work together to support NASA’s BlueFlux project, bringing together data that allow us to observe important changes happening on our Earth. We are driven by the question “Will the benefits we get from wetlands be lost with the ever-increasing pressures of human needs and climate change?”
To address these issues, our science takes us from NASA’s Goddard Space Flight Center (GSFC) to the field. We’ll splash into mangrove and freshwater wetlands of the Everglades with Cheryl Doughty of the University of Maryland and GSFC’s Qing Ying; we’ll take off in planes to fly over the South Florida region with Erin Delaria, also from GSFC; and we’ll assimilate into the communities of people whose lives are intertwined with the health of the whole Everglades ecosystem with GSFC’s Ayia Lindquist. Along with the many scientists who helped with the BlueFlux field campaign that began in 2022, our shared research goal is to better understand whether wetlands will remain resilient carbon sinks as they face changing conditions in an environment heavily influenced by humans.

March 16 – 24, 2022: Forest inventory team, field campaign #1
Our first days of the field campaign began in the Ten Thousand Islands National Wildlife Refuge, which marks the northwest corner of the larger Everglades ecosystem that extends from Lake Okeechobee southward to the Everglades National Park and is bordered by large urban coastal cities including West Palm Beach, Fort Lauderdale, and Miami to the east. This refuge is often described as a labyrinth of water and mangroves, making it a suitable home to many creatures of land and sea — and best explored by boat!

Our fieldwork on foot in the wetlands that dominate Florida’s coasts allowed us to experience firsthand a range of contrasting mangrove conditions. These forest plots can be so dense with trees that it’s hard to see the scientists, but luckily the green canopy lets us work in the shade. The soils here are squishy and always slightly wet, covered with falling leaf litter, and quite smelly— but you learn to love how rotten eggs smell when it’s coming from a healthy mangrove forest.
We began by visiting a healthy and regenerating mangrove forest to conduct our fieldwork to inventory the above- and belowground carbon stocks — snapshots of where and how much carbon, the element foundational to all life on Earth, is stored. We do this by measuring the height and diameter of individual trees within a given area and using allometric equations to estimate how much biomass is aboveground. For belowground estimates, we use a special tool called a peat auger that’s a cross between a shovel and a sword. It extracts a cylindrical core of the soil that can tell us how much biomass and carbon is stored beneath the mangroves.

The next day we didn’t have to travel far to reach an otherworldly example of what a mangrove forest can become when it gets damaged from hurricanes and is not able to recover. These areas have earned the eerie title of mangrove “ghost forests.” To compare these desert-like areas to the healthy forests, we take similar measurements for aboveground and belowground carbon; however, there are a few extra observations we need in order to assess the amount of carbon stored in standing dead trees and fallen branches and trunks.

Three days into our campaign, we made the drive into the Everglades National Park. The enormity of this ecosystem was felt in the hours of driving, but even more so in the diversity of many wetland types we passed through along the way. As we drove south, the influence of freshwater draining slowly from Lake Okeechobee graded into the more low-lying coastal influence of saltwater tides. We stopped at the same vistas frequented by the million visitors to the park every year, collecting a few vital measurements along the way.

One important measurement we took was from a special instrument called a spectrometer, which helps us connect what’s on the earth surface to what’s seen by satellites. That’s always the goal when working on NASA-funded research! The spectrometer captures how sunlight bounces off whatever you point it at —plants, soils, water—using a fiber cable that outputs a “spectra” or graph, showing light reflectance at each wavelength of the sunlight spectrum. This spectrum ranges from the visible light that human eyes see and that plants absorb to do photosynthesis— to the near-infrared energy that is important for monitoring plants’ health. When we pair this data with other satellite images or data collected by NASA, it helps us understand the health of wetland ecosystems at a much bigger scale.

For the rest of the field campaign, we repeated our collections of data on plant reflectance and forest inventories in select mangrove areas that represent a wide range of mangrove health and hurricane impacts across the Everglades.
It’s important to understand where and how mangroves are recovering, or regenerating. We see this best as seedings spring up in the mud or as new sprouts emerge from the dead trunks. All the ecological possibilities at these small scales have big implications for how the mangroves’ relationship to carbon is changing.
The balance of carbon uptake and emissions is at risk. As mangroves photosynthesize through their wide, thick, round leaves, they take carbon from the atmosphere and store it, sinking it into their woody biomass and wet soil. The health of mangrove forests impacts the Everglades’ ability to act as a carbon sink; thus a warming ecosystem impacted by humans and climate change could become a carbon source.

Looked at together, this data will help us understand what’s happening to the carbon in this important ecosystem over longer time scales and over bigger geographic areas. To help with this, we capitalize on NASA’s efforts to develop technology that can be tested over large regions, using planes.
April 19 – 26, 2022 – Airborne flux team, flight deployment #1
High above the ground crews wading through mangrove forests, BlueFlux researchers took to the skies over southern Florida, using airborne measurements of vertical winds and two important greenhouse gases—carbon dioxide and methane—to measure how much of these gases are being released or absorbed across thousands of kilometers of wetlands. Flying at 300 feet to capture these turbulent signals, it was often a very bumpy ride! But by measuring the balance of carbon dioxide and methane carried within eddies — spirals of water — below, we could piece together the bigger picture of how carbon moves across this incredibly diverse landscape.
From the air, the landscape unfolded as a mosaic of distinct coastal ecosystems, each with its own role in carbon cycling. Dense mangrove forests formed dark green canopies along the coast and tidal channels, while lighter-toned marshes and sawgrass prairies stretched inland in patchwork patterns shaped by water flow. Open water, mudflats, and transitional zones added further texture, highlighting just how heterogeneous these environments are at the scales we sampled. Flying over this diversity made it clear that carbon fluxes aren’t uniform—even over short distances, differences in vegetation type, inundation, and productivity can drive major shifts in how these ecosystems exchange carbon with the atmosphere.
From the mangrove forests to the flooded marshes, we saw how vegetation type, ecosystem health, and changing water levels all shape whether these ecosystems act as carbon sinks or sources. More than 100 flight hours, spanning multiple seasons, provided a dynamic picture of how the ecosystems breathe, revealing that carbon uptake and emissions vary dramatically, depending on vegetation type, water levels, and time of year. Mangroves, in particular, stood out as strong carbon sinks, demonstrating the highest carbon dioxide uptake rates that we observed across all our observation flights.


Alongside the differences in carbon exchange across vegetation types, our measurements also let us see the stark imprint of past hurricanes — especially in patches of mangrove ghost forests, where 2017’s Hurricane Irma caused extensive dieback. Over these areas, we frequently observed elevated carbon dioxide and pronounced methane emissions, clear signals that hurricane damage shifted the landscape from a major carbon sink to a net carbon source.

October 12 – 20, 2022 – Airborne flux team, flight deployment #2

When we returned to our study area in October, the landscape had been transformed after a summer of heavy rains. Wetlands that had been only partially inundated were now broadly flooded, and the shift in hydrology was reflected in our measurements of carbon fluxes. Methane emissions were noticeably higher, especially over cypress swamp forests and freshwater marshes, where standing water creates ideal conditions for methane production. At the same time, the highly productive bald cypress hammocks, looking like elevated islands of dense trees rising above the surrounding marshes, had begun to brown and shed their needles for the season, sharply reducing their capacity to store carbon dioxide. These changes gave us our first clear picture of how strongly carbon exchange here shifts between wet and dry seasons — again, driven by rainfall, water levels, and the seasonal rhythms of the ecosystem.
Our flight crews also got their first taste of groundwork in October. We joined field teams for a day of tromping through mud to measure carbon dioxide and methane fluxes from within a mangrove forest site. It didn’t take long to gain a new appreciation for the effort behind those measurements—long hours, thick mud, and dense clouds of mosquitos. By the end of the day, there was a shared respect for the ground team’s work, along with an acknowledgement that flying might just be the more comfortable side of the operation — provided that you don’t get airsick!

October 22 – 27, 2022 – Chamber flux field team, field campaign #2
Returning to the Everglades National Park in October during the wet season proved to be just that — wet! This trip was to help the team from Yale School of the Environment (YSE), which would work to measure how carbon dioxide and methane fluxed over the day by attaching air-tight chambers directly to trees. Their work assesses the extent to which each gas is either stored or emitted by various types and parts of healthy and dead mangroves. While our feet got wet at our first stop in a recovering mangrove ghost forest, the team made sure the gas analyzer equipment stayed safe and dry while connected by tubes to each measurement chamber.

The next day, the team ventured into a healthy and much denser mangrove forest with the gas analyzers on our backs. If you’ve ever had the pleasure of making your way through a 3-D maze of interwoven mangrove knees and roots surrounded by water and sloppy mud, you may understand just how amazed I am that we made it in (and out) without any snags on the inflatables or any slips into the muddy water we were slogging through with expensive equipment on our backs. Once at the sampling site, it was another full day of measuring gases going in and out of trees. These novel measurements are what we need in order to understand just how variable carbon uptake and emissions can be from second to second, from tree root to trunk, and from resilient to damaged mangrove forests.

July 13 – 19, 2024 – Airborne flux team, flight deployment #5
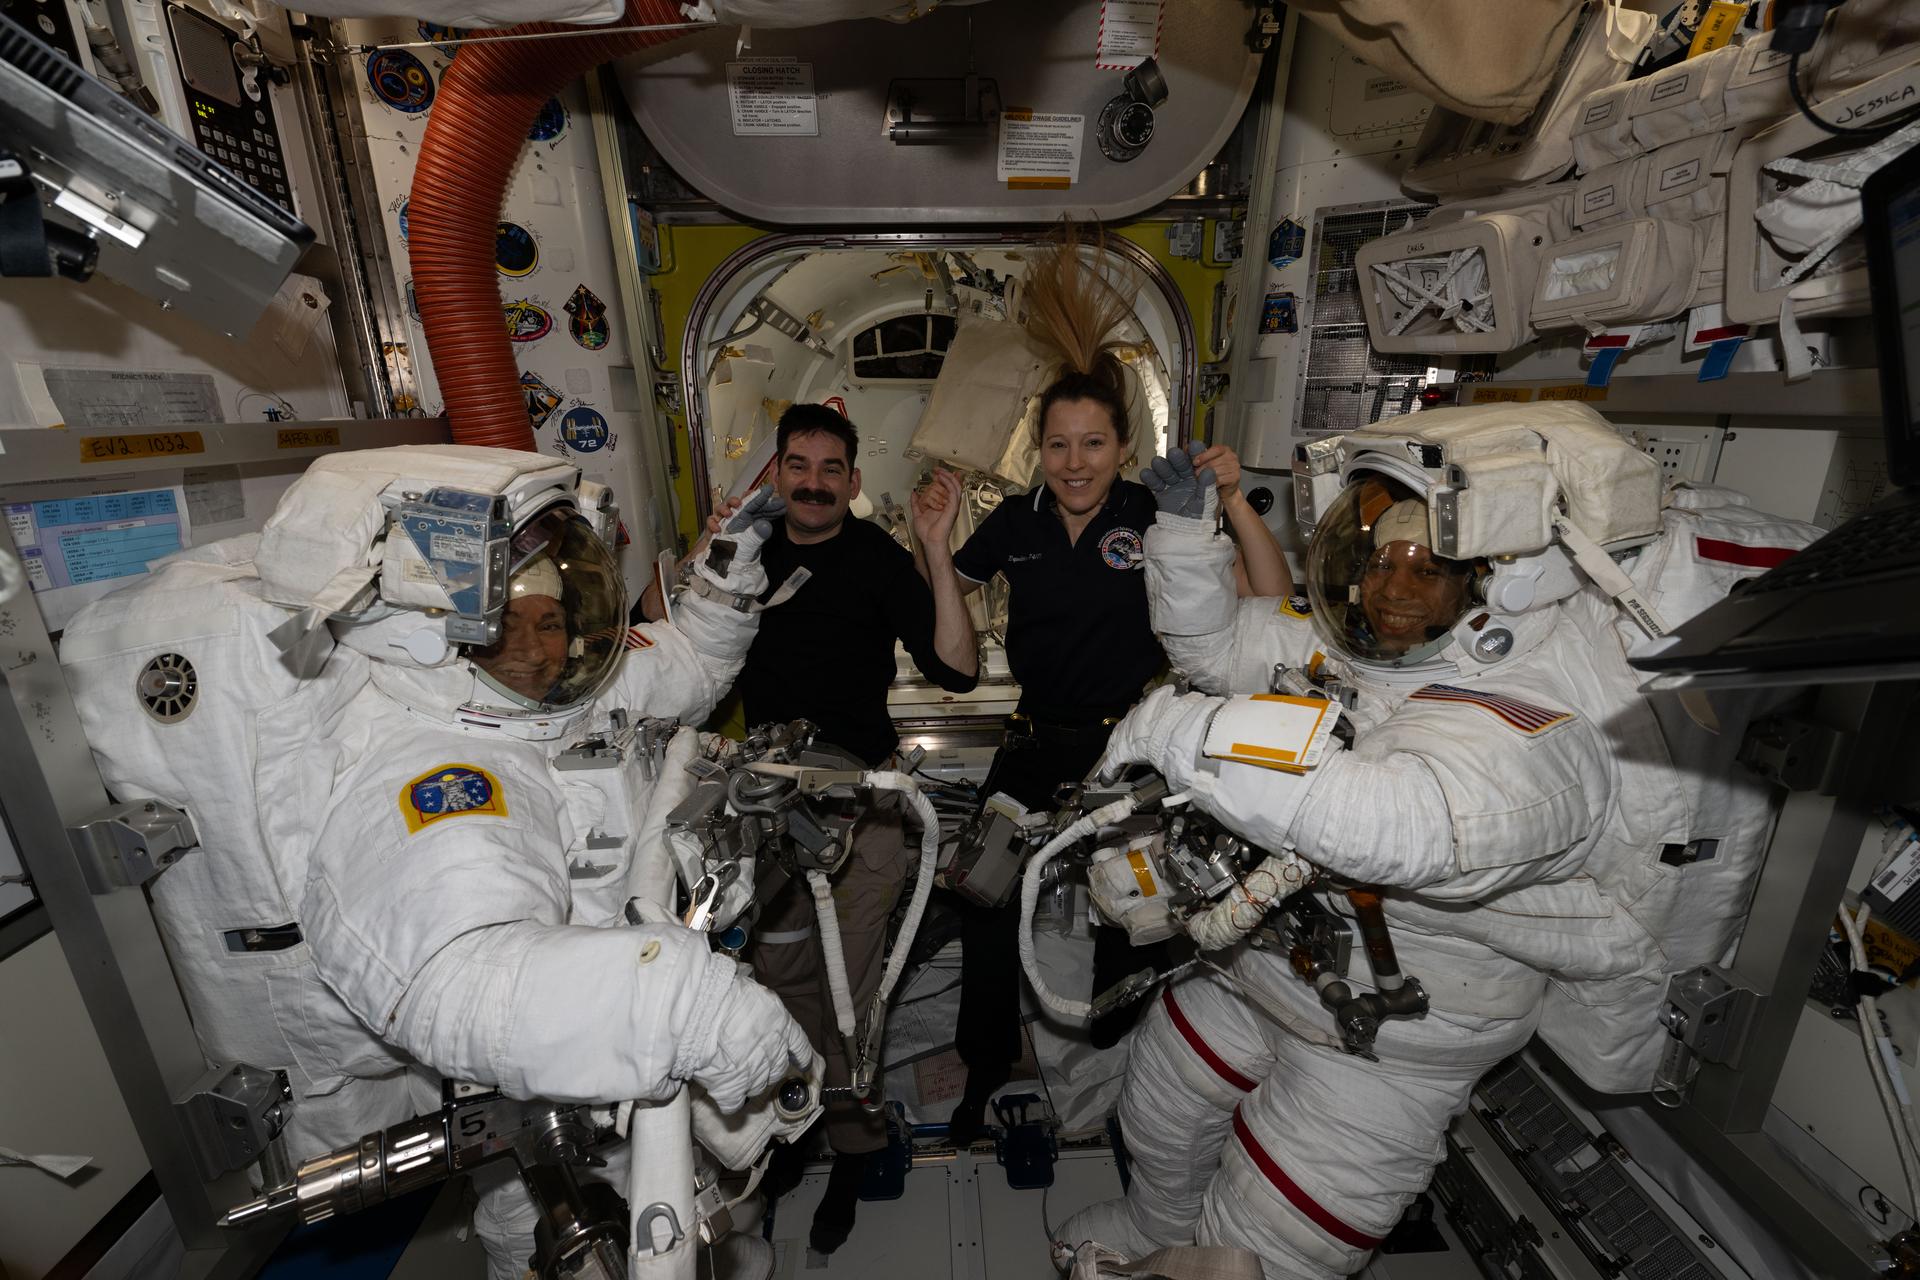
The flight team returned for one final set of measurements in July 2024, in the heart of the wet season, capturing a last snapshot of how carbon exchange shifts across seasons. During this time of year, South Florida sees near-daily thunderstorms that continually soak the landscape with fresh water. This final deployment also brought together flight scientists Piper Read and Erin Delaria with Dynamic Aviation pilots KT Kinne and Lilia Farr—forming a rare all-female NASA mission.

April 2023 – Community engagement team, outreach events
April is often synonymous with Earth Month in the outreach community, due to the volume of events focused on engaging the public on environmental causes. South Florida is no different, putting its own flair on Earth Month events, to which the BlueFlux team had the opportunity to contribute! One of the key aspects of BlueFlux and other Carbon Monitoring System-funded projects, is strong stakeholder partnerships. We were invited by the Seminole Tribe of Florida, one of our key community partners, to share about our BlueFlux project and introduce their community to NASA Earth Science at their Earth Day event. There, the team had the opportunity to speak with Seminole Tribal and local community members about the science we are doing, answer questions, and strengthen local relationships.

Later that same week, the team had planned an open house with the local Museum of Diving in Marathon, Florida. Our community partners Florida International University’s Florida Coastal Everglades Long Term Ecological Research (FCE-LTER) program and the conservation group Coastlove joined us to host a special Earth Day event in the Keys. In addition to opening the aircraft and instruments to the public, we also held a mangrove planting and clean-up to connect the science we are doing to on-the-ground restoration efforts. Attendees planted over 30 young mangroves and collected over 200 pounds of trash, enjoying a holistic Earth Day experience. From doing direct community outreach and engagement and working closely with local decision makers, the BlueFlux team has been deeply involved in ensuring our research is impactful locally. The team continues to engage in how to integrate the research into helpful decision making.
Because our BlueFlux science is funded by NASA, we owe it to the public to make our data available and accessible. We feel it is important to communicate our science at many levels to anyone who wants to learn more. If you’d like to read more about how the airborne fluxes change with the season over such an incredibly heterogeneous mosaic of wetland types, you can read our publication in the Journal of Geophysical Research: Biogeosciences. Or you can check out our publicly available dataset of airborne fluxes. You can also find out more about how the field and airborne data we collected were combined for a regional perspective of wetland greenhouse gas emissions over the entire Everglades for the last 23 years in our recently published PNAS study. For more hands-on exploration of the results of our study, please see our interactive web app on Google Earth Engine.