


Spectroscopy
Studying light in detail allows astronomers to uncover the very nature of the objects that emit, absorb, or reflect light.
Spectroscopy's Origins
When we turn on a light in a dark room, it illuminates our surroundings, allowing us to better understand our environment. Astronomers use light in a similar way, but light from astronomical objects not only illuminates the cosmos, it also helps us better understand the very nature of the objects we are looking at.
Spectroscopy, the study of light and its component parts, had its beginnings in the 17th century when Isaac Newton passed a beam of sunlight shining through a pinhole in a covered window through a prism. The prism separated the sunbeam into a continuous series of colors that Newton called a “spectrum.”
Rainbows are the best-known type of spectrum. They form when sunlight bends (refracts) and then bounces (reflects) inside a raindrop. Our Sun emits white light which holds all colors of the rainbow in roughly equal amounts. When sunlight encounters a raindrop, the raindrop acts like the prism in Newton’s experiment. It separates sunlight into its different wavelengths, producing the familiar arc of color we call a rainbow.
But spectroscopy produces more than a simple rainbow arc of color. It can reveal the molecules around stars or in the atmospheres of distant planets. It can tell us their temperatures, densities, and in the case of gas, their pressures. Spectroscopy can also reveal the distance to an object along with the direction and speed it is traveling.
Hubble Spectroscopy
All normal matter in the universe either emits, absorbs, reflects, or transmits light. That light, called electromagnetic radiation, includes the rainbow of visible light our eyes can see, the ultraviolet radiation that streams from the Sun, the infrared or heat radiation we feel when we open a hot oven’s door, X-rays, radio waves, and all of the wavelengths in between or beyond.
Because the range of wavelengths available for study is so broad and each one has different requirements to capture, no one telescope can study them all. That means telescopes specialize in a wavelength range, like the James Webb Space Telescope that studies infrared light, or series of ranges like Hubble.
Hubble’s design and instruments allow it to capture ultraviolet, visible, and a small part of the infrared spectrum called near-infrared. As light from a distant cosmic object enters Hubble, its mirrors reflect and focus that light onto Hubble’s instruments. Those instruments include dedicated spectrographs that separate light into its different wavelengths.
When light from a cosmic object enters one of Hubble’s spectrographs, it passes through a tiny slit in a metal plate that isolates it from the light of other objects. The light then bounces off a special metal grating, called a diffraction grating, that splits the light into its component wavelengths, focusing them onto a detector that records them as a spectrum.
Hubble’s current instruments include two main spectrographs — the Space Telescope Imaging Spectrograph (STIS) that captures wavelengths from ultraviolet through visible and into near-infrared, making it an “all purpose” instrument, and the Cosmic Origins Spectrograph (COS) which measures faint ultraviolet light from faraway sources like remote galaxies— and three cameras — Advanced Camera for Surveys (ACS), Wide Field Camera 3 (WFC3), and the Near Infrared Camera and Multi-Object Spectrometer (NICMOS). Each of these cameras also have spectrographic capability that allows astronomers to capture an image along with detailed data about the object’s light.
Types of Spectra
Astronomers study three basic types of spectra: continuous, absorption, and emission.
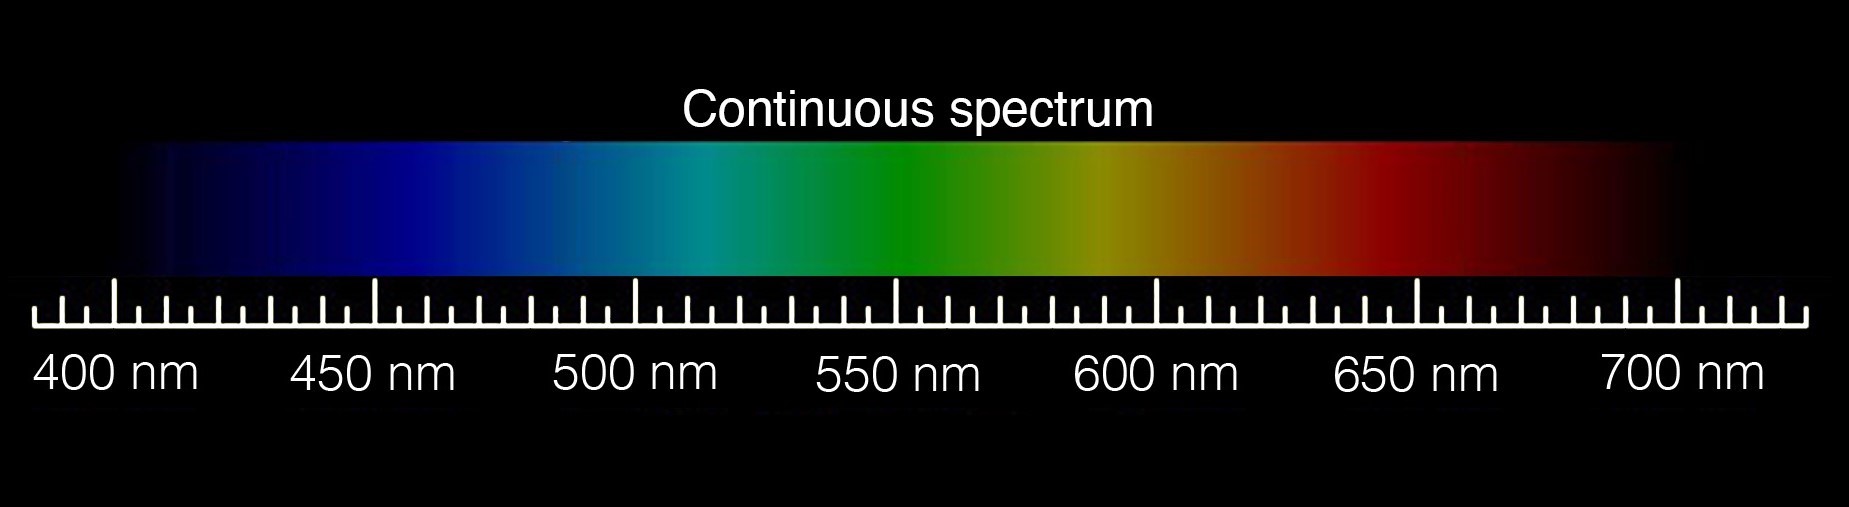
A continuous spectrum holds all wavelengths of light across a certain wavelength range. As its name implies, it is uninterrupted with no gaps or intensely bright bands. The hot, compact point of light emitted by stars is nearly a continuous spectrum.
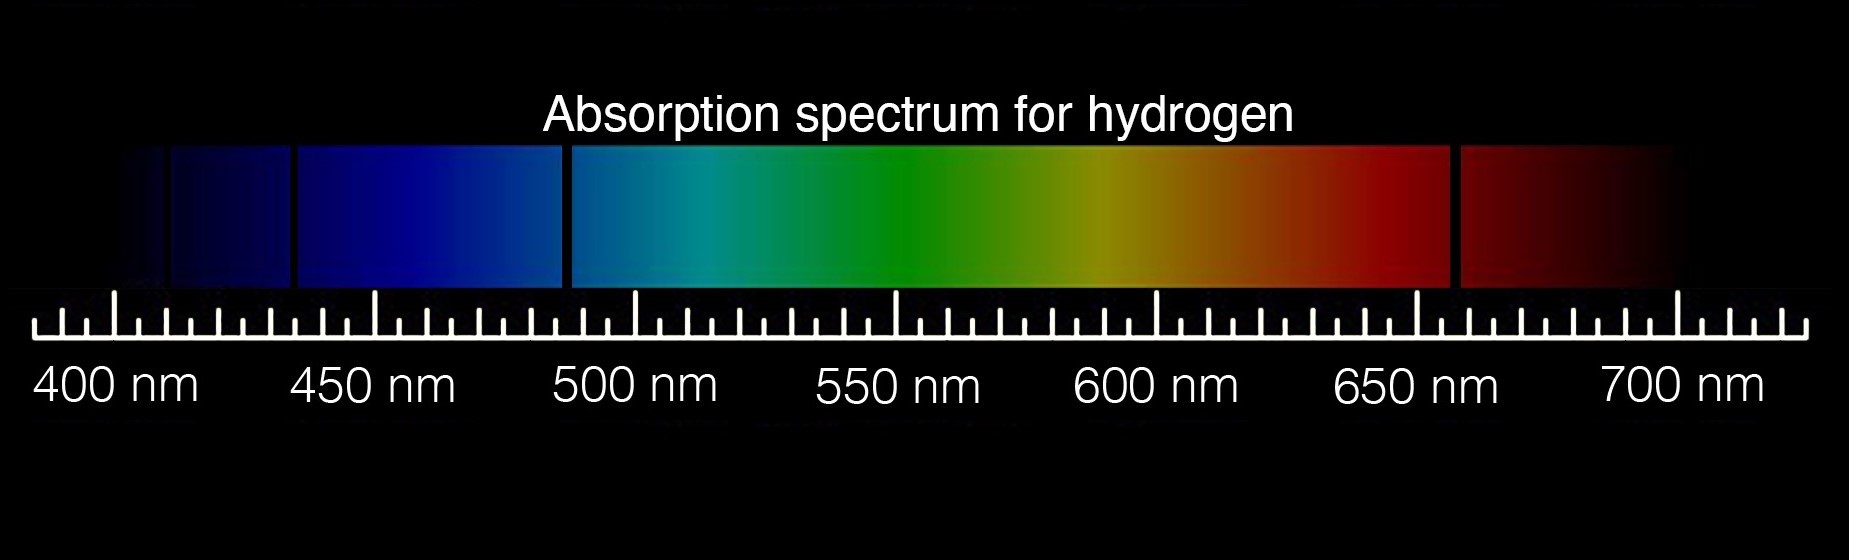
We see an absorption spectrum when light from an object like a star passes through another medium, like an interstellar cloud or nebula. As the light interacts the nebula, the nebula may absorb certain wavelengths of light while others pass through. The absorbed wavelengths depend on the elements and compounds that make up the nebula. An absorption spectrum holds dark lines or breaks that correspond to the absorbed wavelengths of light.
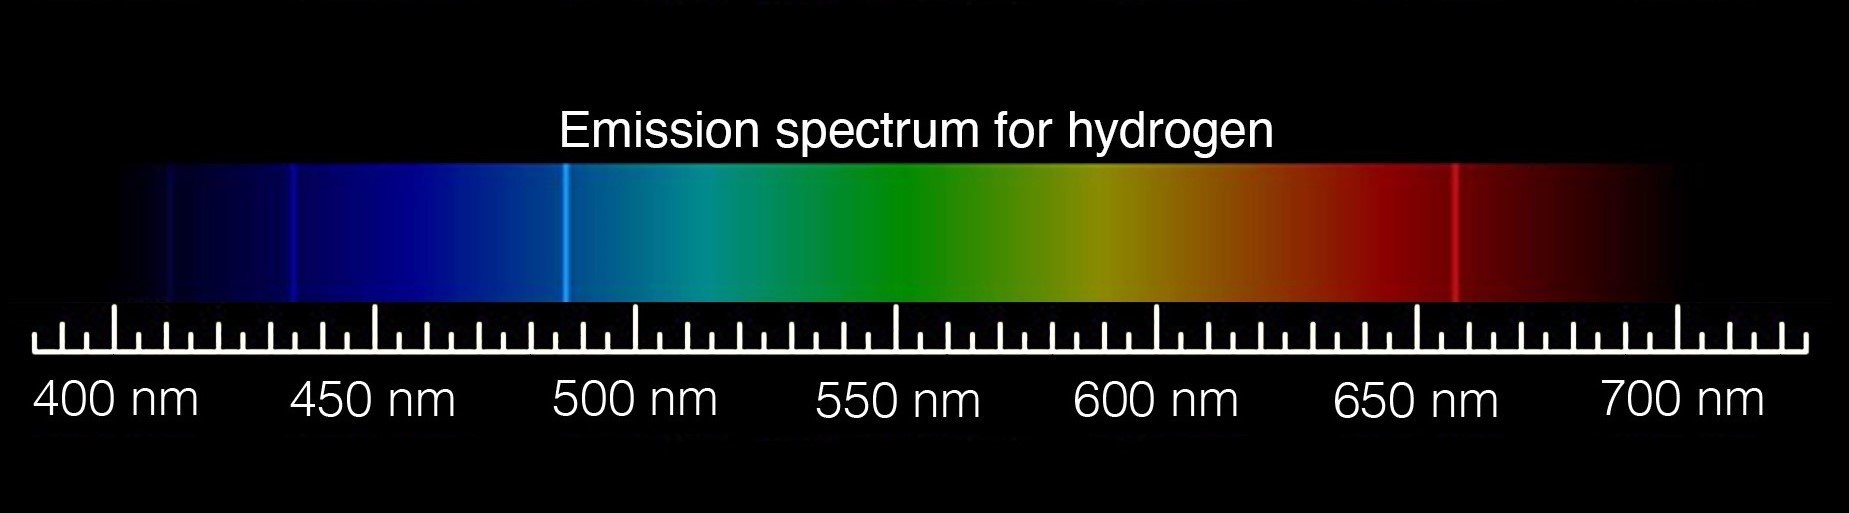
An emission spectrum is the result of excited atoms and molecules that emit light. As starlight passes through a nebula, it can heat up the cloud, exciting gas molecules and elements causing them to glow. The resulting emission spectrum holds a series of bright colored lines that correspond to wavelengths of light emitted by the excited atoms and molecules.
Astronomers look at spectra in the form of a graph that generally holds wavelengths along the x-axis and light intensity (luminous flux) along the y-axis. A spectrum's curve, called a continuum, represents the continuous emission of electromagnetic radiation at all wavelengths. A bright line (emission) or dark line (absorption) in the spectra correlates to peaks and valleys on the curve. They reveal the wavelengths where specific atoms emit or absorb light.
Spectra allow astronomers to easily see the intensity of light at precise wavelengths; providing them with important details about the object’s chemical makeup, temperature, density, motion, or physical environment. They offer a detailed way to compare the spectra of any given object over time, allowing astronomers to track the evolution of an object and its environment. Such detail also allows astronomers to compare objects so they can better determine differences in environment, age, motion, and physical characteristics, making each spectrum a fingerprint of the object it represents.
Information Hubble Captures with Spectroscopy
-
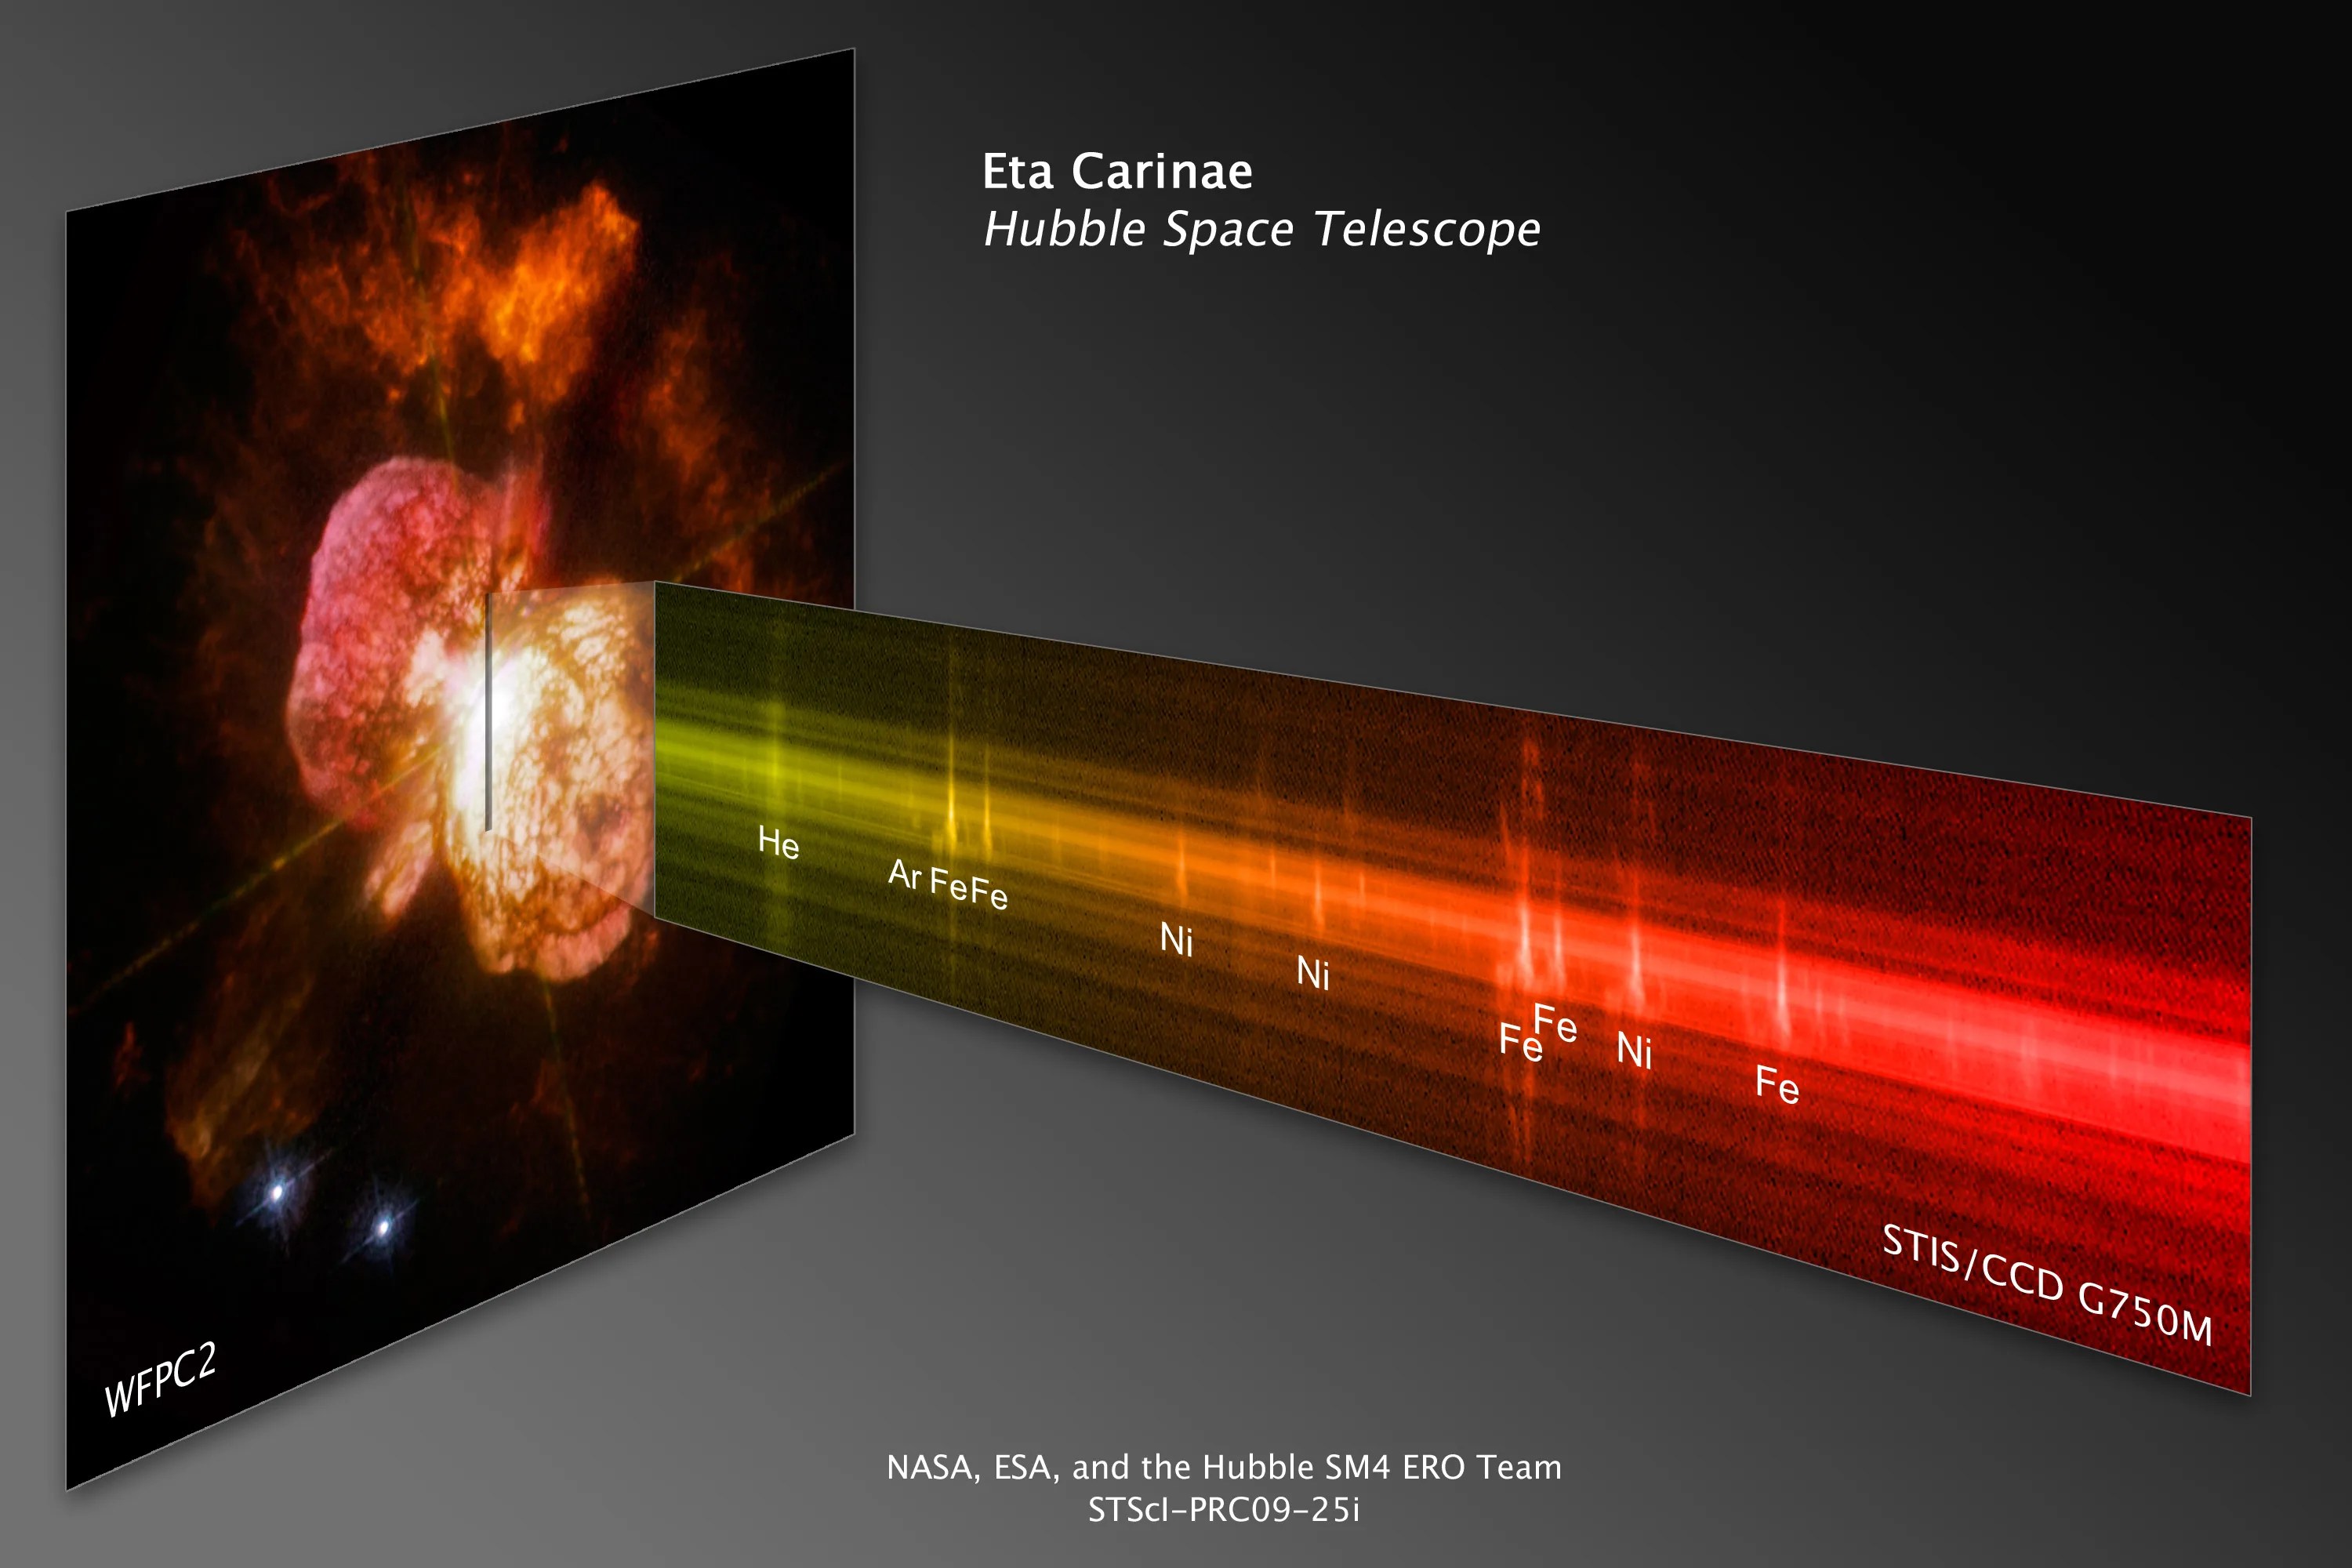
Composition
A spectrum's peaks and valleys reveal the elements contained in the objects Hubble observes. Each element has a characteristic signature. Here a spectrum taken by Hubble's Cosmic Origins Spectrograph (COS) of a supernova remnant, the explosive death of a star, reveals sharp peaks that indicate the elements oxygen and carbon.
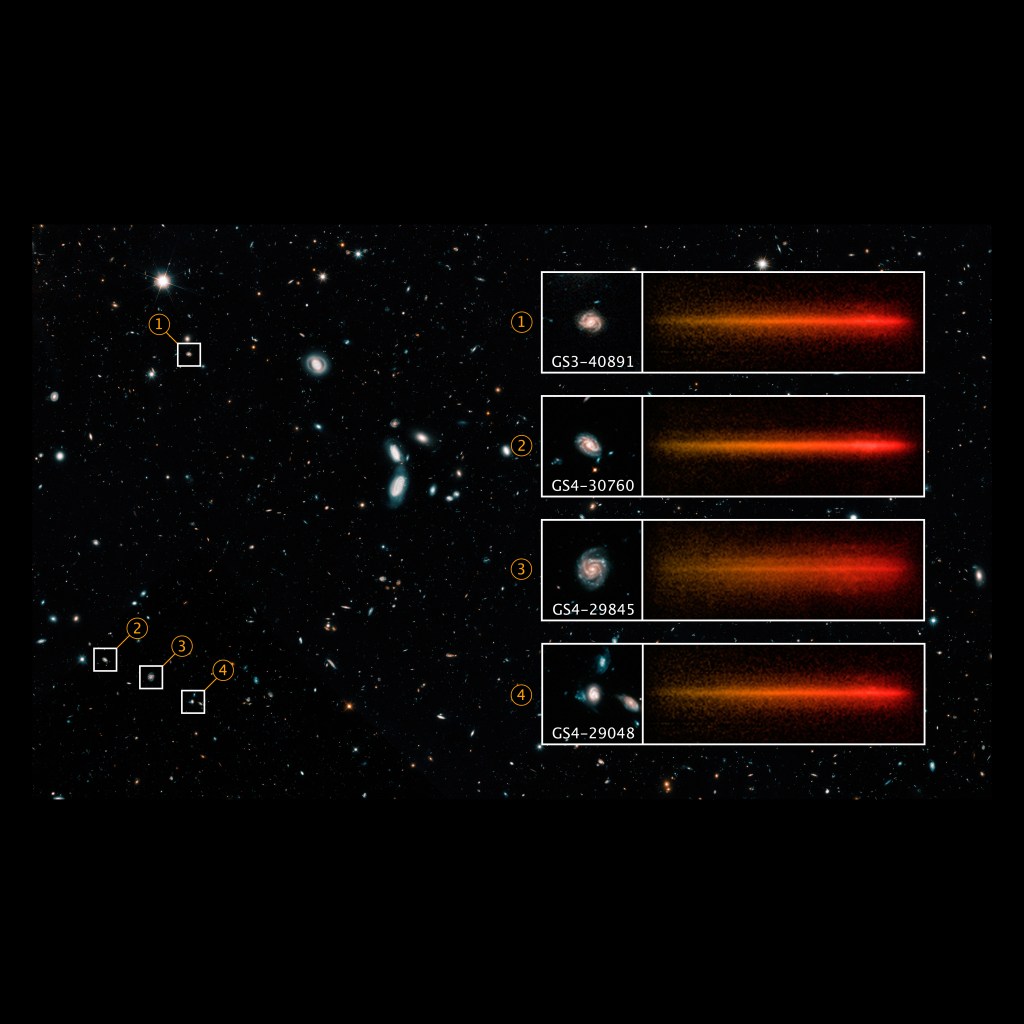
Hubble was the first telescope to detect and analyze an atmosphere around a planet outside of our solar system. Today, Hubble's wealth of spectroscopic data has helped astronomers better understand the various classes of exoplanets and their environments.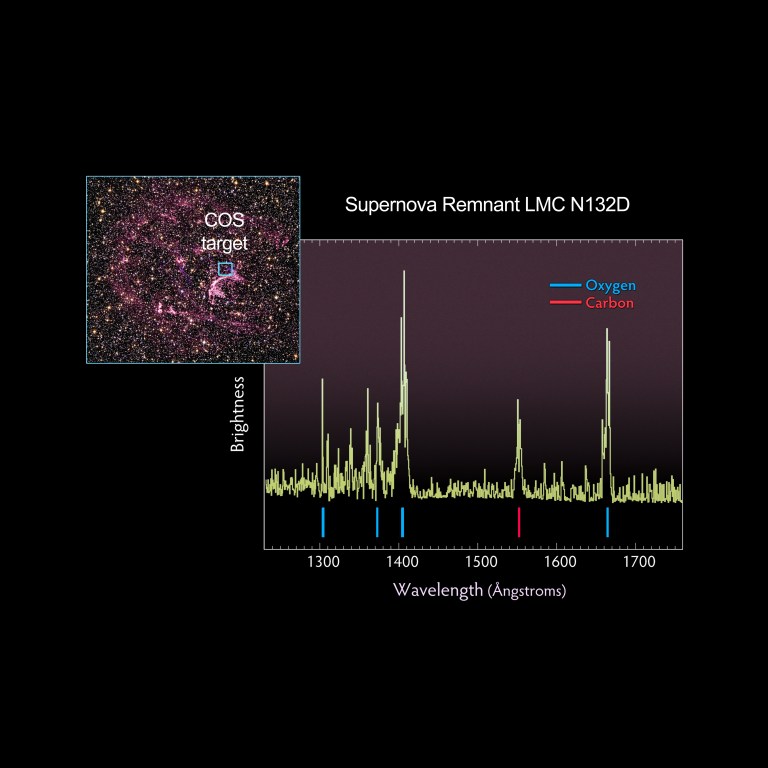 The wispy, glowing, magenta structures in this Hubble image are the remains of a star 10 to 15 times the mass of the Sun, which went supernova 3000 years ago. The remnant's fast-moving gas is ploughing into the surrounding gas of the galaxy, creating a supersonic shock wave in the surrounding medium and making the material glow. The Hubble visible-light image reveals, deep within the remnant, a crescent-shaped cloud of pink emission from hydrogen gas and soft purple wisps that correspond to regions of glowing oxygen. A dense background of colorful stars is also visible.NASA, ESA and the Hubble SM4 ERO
 -
Temperature
Atoms have different energy levels that electrons can occupy. When an atom heats up it absorbs energy and an electron jumps to a higher energy level, becoming "excited". When that electron returns to its normal energy state, it releases a particle of light called a photon. Astronomers use this basic property of matter to determine an object's temperature.
Hubble's Space Telescope Imaging Spectrograph (STIS) long-slit spectrograph viewed the entire ring system of supernova 1987a, dissecting its light and producing a detailed image of the ring in each of its component colors. Each color represents light emitted by specific elements in the ring's gasses, including oxygen (single green ring), nitrogen and hydrogen (triple orange rings), and sulfur (double red rings). Each ring represents an emission line of interest in the element's spectrum.
The ratio of the ring's brightness in different colors, emanating from the same elements, gives a measure of the concentration of the gasses. The light from different elements also identifies gasses at different temperatures.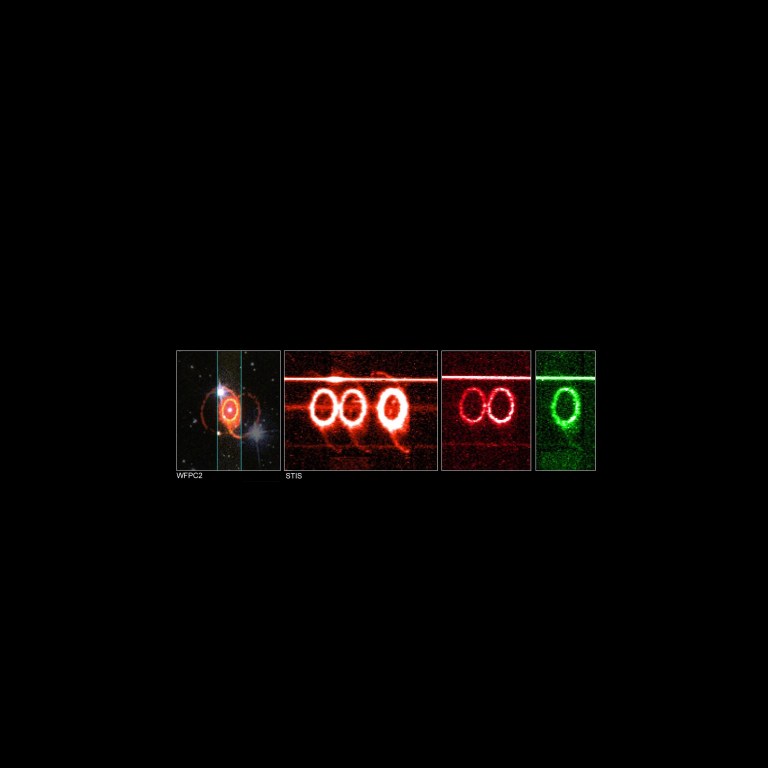 The STIS long-slit spectrograph of Supernova 1987A dissects its light, producing a detailed image of the ring in each of its component colors. Each color represents light from specific elements in the ring’s gasses, nitrogen and hydrogen (triple orange rings), sulfur (double red rings), and oxygen (single green ring).NASA
 -
Density
Pressure and density are directly related. As pressure increases, so does density. Here we see the absorption spectra of three different star types. If you compare the spectrum of an extremely dense white dwarf star to a that of the Sun or a puffy blue giant star, you’ll notice that the spectral lines in the white dwarf are much wider and fuzzier than those in the spectra of the blue giant or Sun.
White dwarfs have roughly the mass of the Sun compressed to the volume of Earth. At the atomic level, pressure in the white dwarf is so high that it disrupts the atoms' energy levels, causing its spectral lines to spread out, allowing astronomers to determine its density.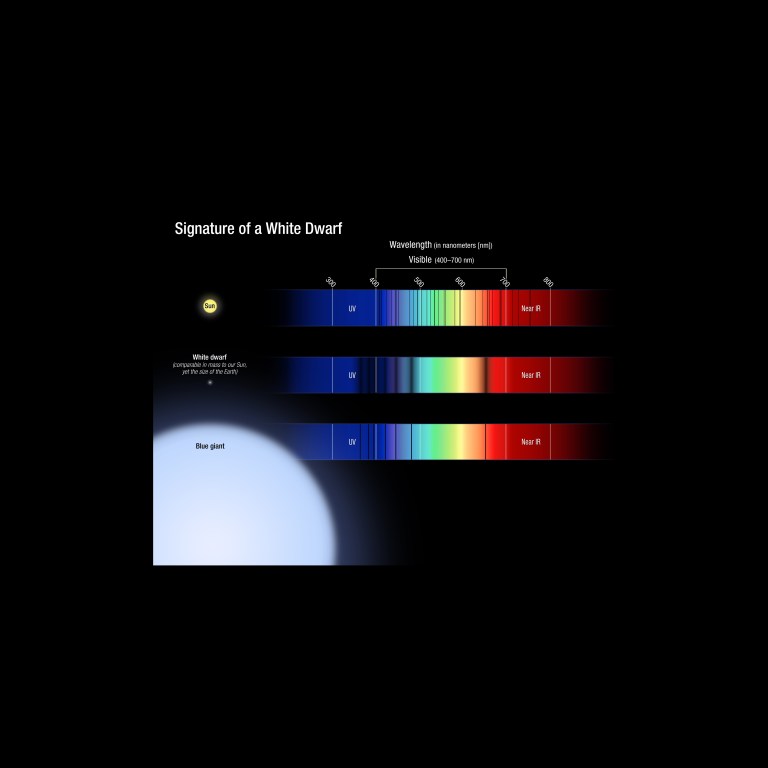 White dwarf stars have remarkable properties, yet they are very simple. These stripped cores of normal hydrogen-burning stars are about 1 million times denser than matter on Earth. This means that a tablespoon of material from a white dwarf's surface would weigh as much as a school bus on Earth. White dwarfs also have no fuel to generate energy, and most of their atmospheres contain a single atom, hydrogen. The figure illustrates the spectral features of a white dwarf, in comparison to the Sun and a blue giant. The white dwarf spectrum is simple, containing only absorption lines from the hydrogen atom. But, unlike the same lines in the blue giant spectrum (a bloated star with a low density), the features in the white dwarf are broadened due to the intense pressure on the surface of the star (essentially, the energy levels of the atom are being perturbed). This broadening of the lines, as well as their depth, is directly related to the mass and temperature of the star. Unlike for most stars, astronomers can therefore reliably establish fundamental properties for white dwarfs from their spectra.NASA, ESA, and A. Feild and J. Kalirai (STScI)
 -
Motion
As an object moves toward an observer, its light waves "bunch up" in the direction of its motion. The observer sees each wave at an increased frequency, which makes them appear bluer. When an object travels away from an observer, its light waves arrive "spread out." To the observer, the light waves appear to have a longer frequency, making the object look redder. This change in frequency related to motion is called the Doppler Effect.
The unique capabilities of Hubble's Space Telescope Imaging Spectrograph (STIS) allowed astronomers to discover a black hole in the center of galaxy Messier 84. In a single exposure, STIS was able to capture the motions of gas whirling around and into the black hole. The left, blue point in the zig-zag indicates gas moving toward us while the right, red point indicates gas moving away from us.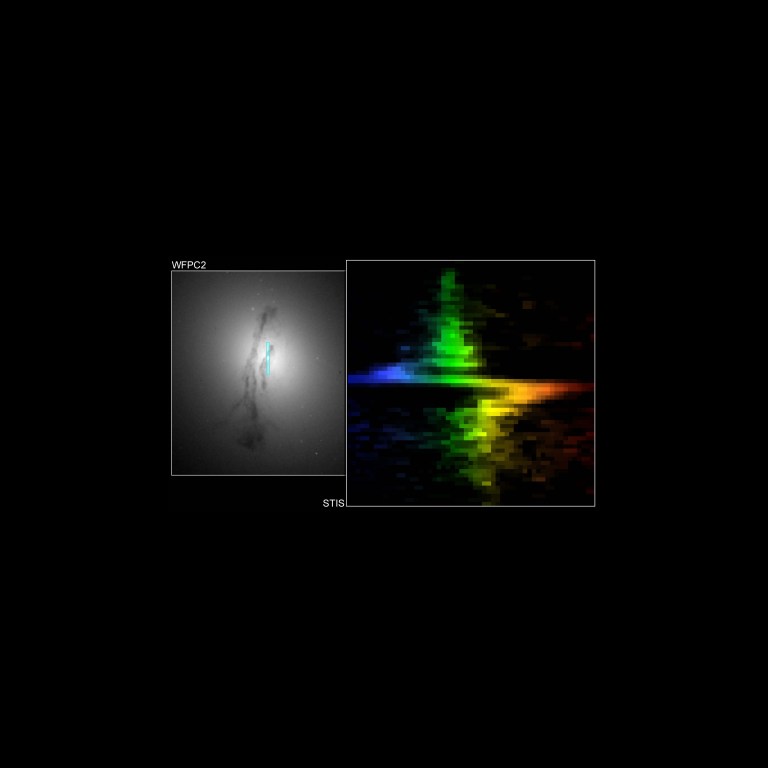 The Hubble image on the left shows the bright core of M84 surrounded by a dark band of gas and dust. The plot on the right was generated by passing light from the core of the galaxy (bordered by the blue rectangle in the left image) through a Hubble spectrograph. Stars and glowing gases near the core of M84 are circling the galaxy’s central black hole at 880,000 miles per hour, so they appear to be moving rapidly toward Earth on the left half of the spectrum (colored blue) and receding on the right half (colored red).Gary Bower, Richard Green (NOAO), the STIS Instrument Definition Team, and NASA
 -
Distance
This image illustrates how the dark lines of an absorption spectrum are shifted toward the right or red end of the spectrum. This shift is the result of the expanding universe. As light travels from great distances to Hubble's mirrors, it is stretched to longer and longer red wavelengths, or cosmologically redshifted, as the universe expands. Astronomers can look for known features in an object's spectrum, like these absorption lines, to see if they are shifted from their normal position on the spectrum. The difference between their normal position and their new position is called their cosmological redshift.
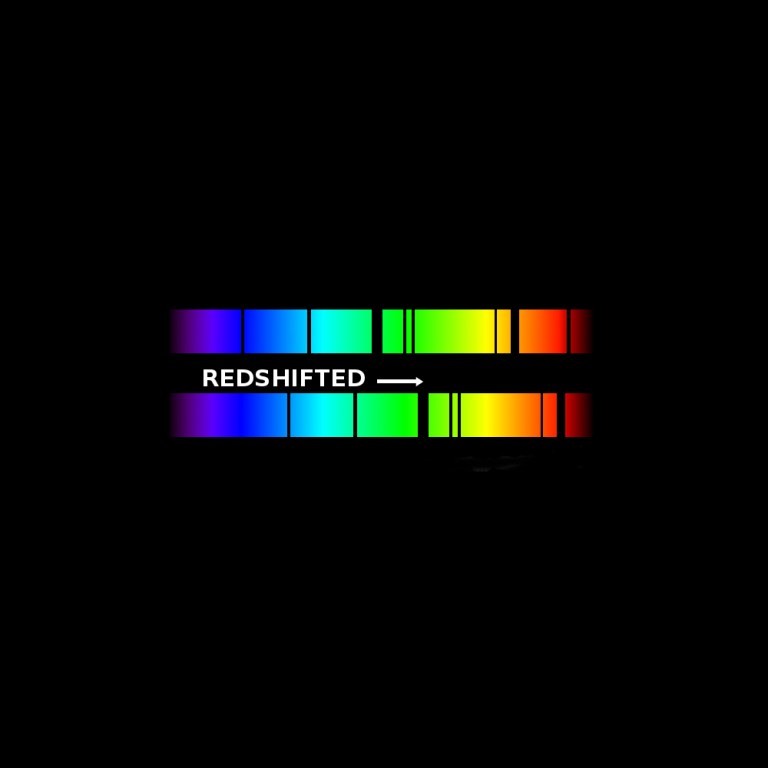 NASA
NASA
Hubble's Discoveries
Hubble's high resolution and instrumentation allow it to capture the data necessary to make its unprecedented discoveries. Although spectroscopy had its beginnings in the 1600s with Isaac Newton, it didn't become a part of the astronomer's toolkit until the early 1800s. It wasn't until the late 1960s that astronomers began taking spectroscopic observations from space with the launch of NASA's Orbiting Astronomical Observatory (OAO) program in 1966. When Hubble launched in 1990, it built upon the work of those earlier missions.
Before space-based spectroscopy, ground-based telescopes consistently returned blurred spectra distorted by our atmospheric turbulence. With its orbit above Earth’s atmosphere, Hubble’s instruments not only capture spectacular images, but also spectra with crisp peaks and valleys that have forever changed our understanding of the universe.