


1 min read
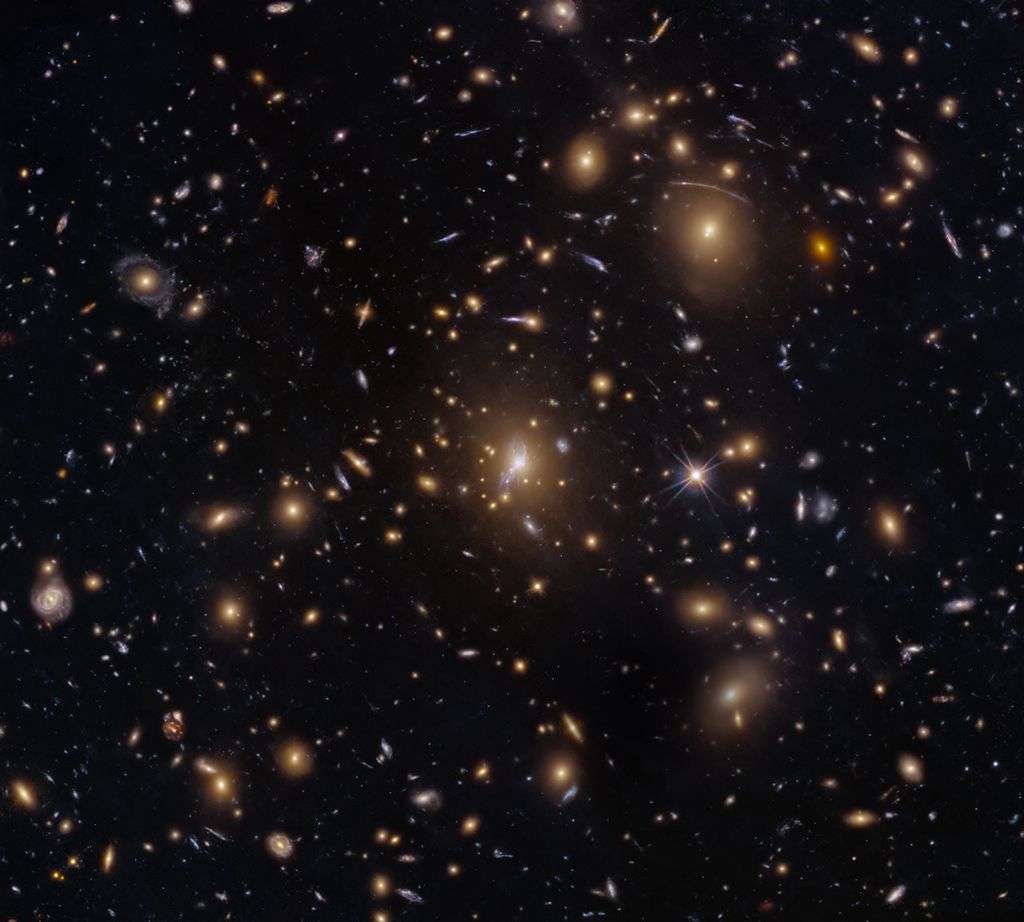
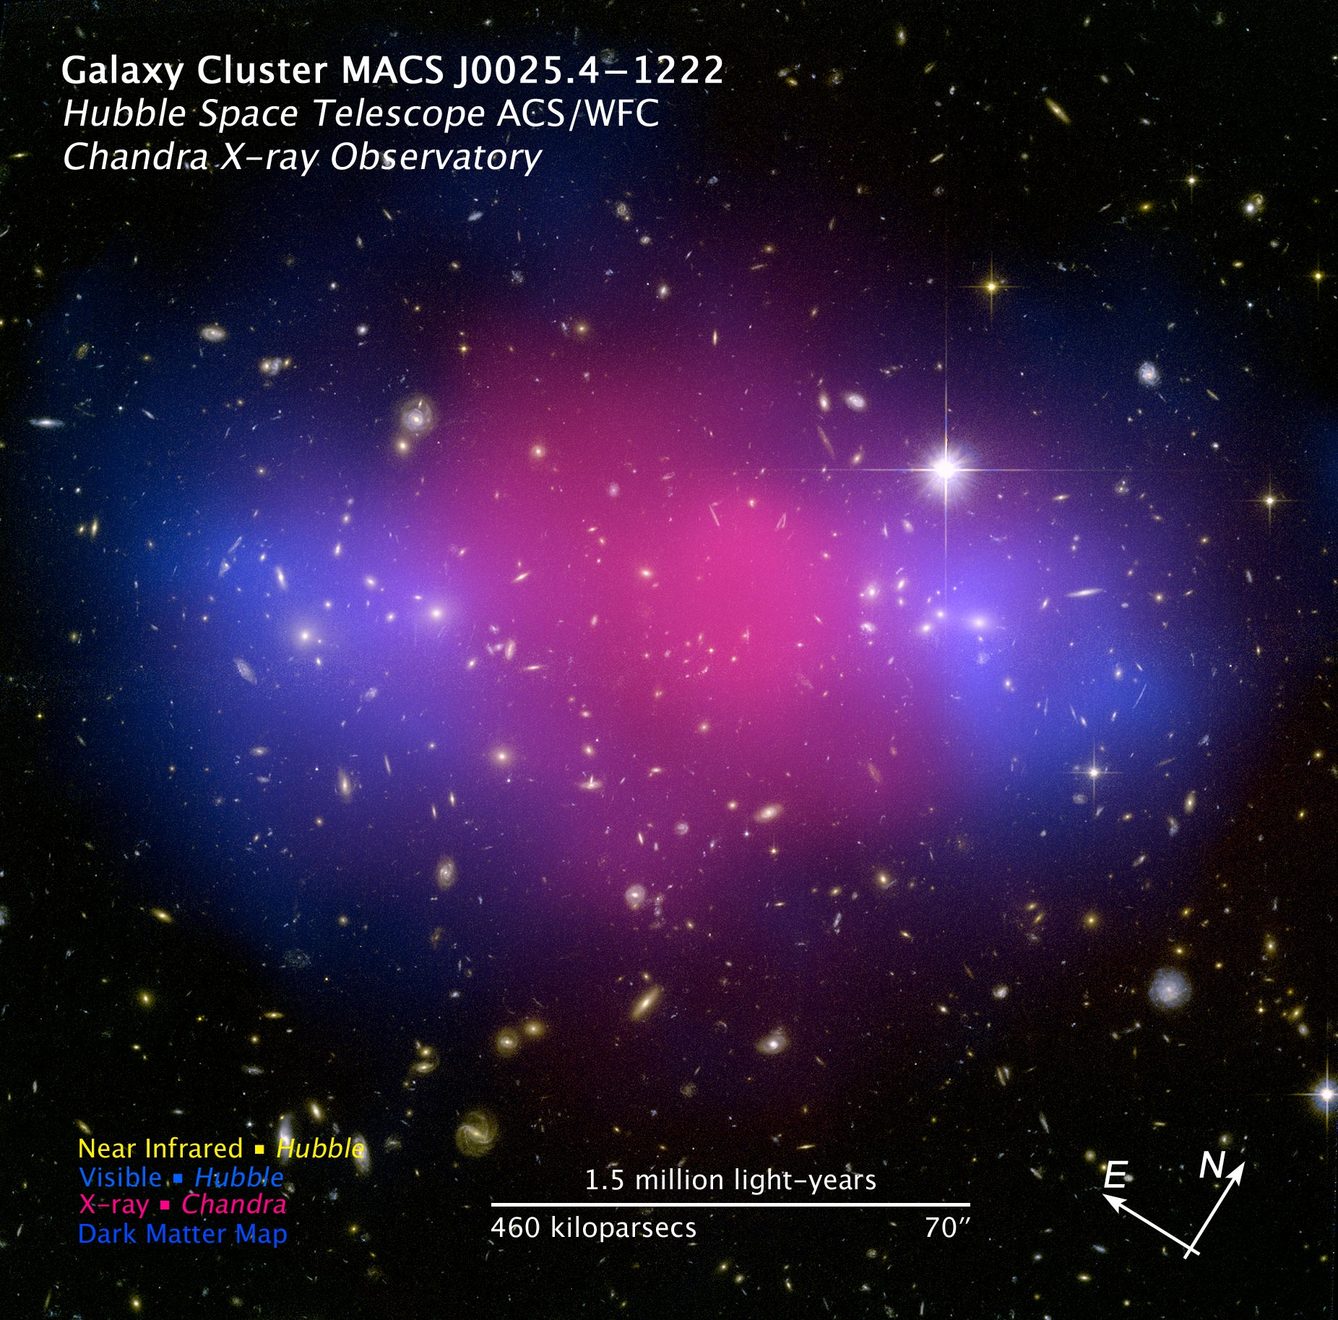
Hubble and Chandra Composite of the Galaxy Cluster MACS J0025.4-1222
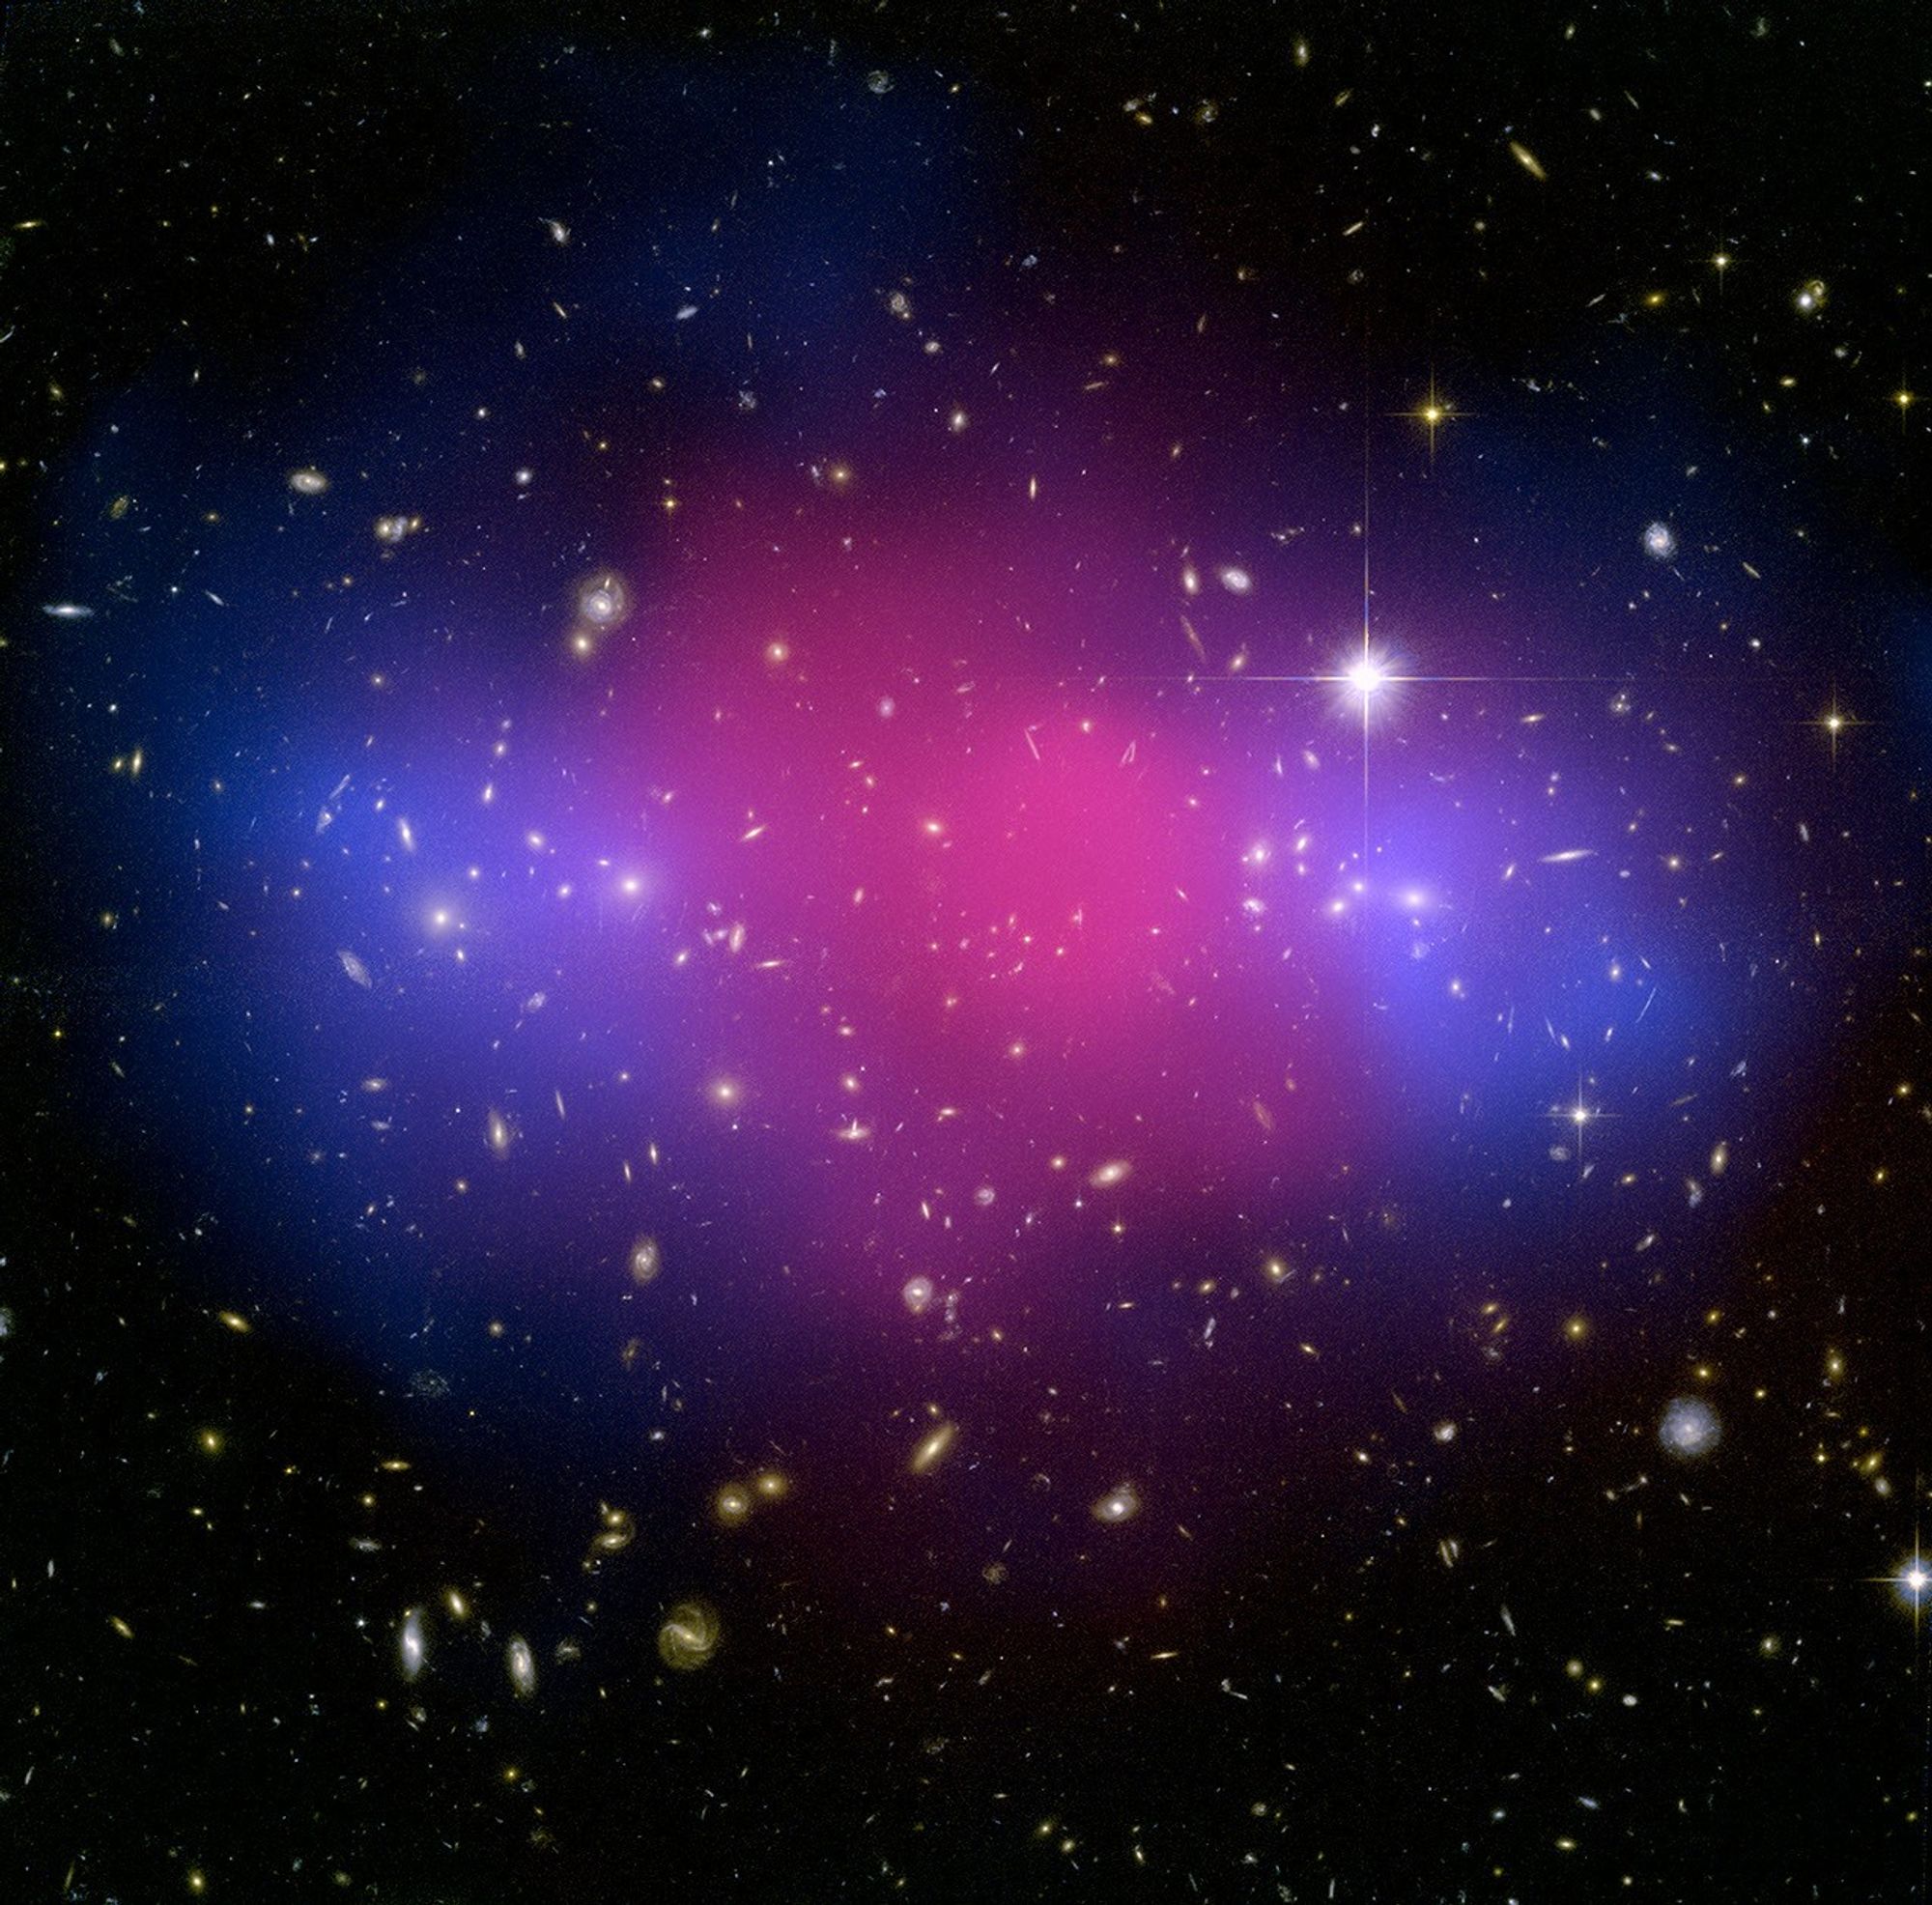
A powerful collision of galaxy clusters has been captured by NASA's Hubble Space Telescope and Chandra X-ray Observatory. This clash of clusters provides striking evidence for dark matter and insight into its properties.
The observations of the cluster known as MACS J0025.4-1222 indicate that a titanic collision has separated the dark from ordinary matter and provide an independent confirmation of a similar effect detected previously in a target dubbed the Bullet Cluster. These new results show that the Bullet Cluster is not an anomalous case.
MACS J0025 formed after an enormously energetic collision between two large clusters. Using visible-light images from Hubble, the team was able to infer the distribution of the total mass – dark and ordinary matter. Hubble was used to map the dark matter (colored in blue) using a technique known as gravitational lensing. The Chandra data enabled the astronomers to accurately map the position of the ordinary matter, mostly in the form of hot gas, which glows brightly in X-rays (pink).
As the two clusters that formed MACS J0025 (each almost a whopping quadrillion times the mass of the Sun) merged at speeds of millions of miles per hour, the hot gas in the two clusters collided and slowed down, but the dark matter passed right through the smashup. The separation between the material shown in pink and blue therefore provides observational evidence for dark matter and supports the view that dark-matter particles interact with each other only very weakly or not at all, apart from the pull of gravity.
The international team of astronomers in this study was led by Marusa Bradac of the University of California, Santa Barbara, and Steve Allen of the Kavli Institute for Particle Astrophysics and Cosmology at Stanford University and the Stanford Linear Accelerator Center (SLAC). Their results will appear in an upcoming issue of The Astrophysical Journal.
About the Object
- R.A. PositionR.A. PositionRight ascension – analogous to longitude – is one component of an object's position.00h 25m 29.79s
- Dec. PositionDec. PositionDeclination – analogous to latitude – is one component of an object's position.-12° 22' 46.98"
- ConstellationConstellationOne of 88 recognized regions of the celestial sphere in which the object appears.Cetus
- DistanceDistanceThe physical distance from Earth to the astronomical object. Distances within our solar system are usually measured in Astronomical Units (AU). Distances between stars are usually measured in light-years. Interstellar distances can also be measured in parsecs.This object has a redshift of z = 0.586. It is on the order of billions of light-years away.
- DimensionsDimensionsThe physical size of the object or the apparent angle it subtends on the sky.This image is 3.2 arcminutes (4.2 million light-years or 1.3 million parsecs) wide.
About the Data
- Data DescriptionData DescriptionProposal: A description of the observations, their scientific justification, and the links to the data available in the science archive.
Science Team: The astronomers who planned the observations and analyzed the data. "PI" refers to the Principal Investigator.HST Proposal: 10703 PI H. Ebeling, University of Hawaii) and 11100 : PI M. Bradac (University of California, Santa Barbara). The image was was composited with X-ray data from the Chandra X-ray Observatory's Advanced CCD Imaging Spectrograph, from proposals: 3251 and 5010: PI S. Allen (Stanford University). The science team includes: M. Bradac (University of California, Santa Barbara), S. Allen (Stanford University), T. Treu (University of California, Santa Barbara), H. Ebeling (University of Hawaii), R. Massey (Royal Observatory, Edinburgh), and G. Morris, A. von der Linden, and D. Applegate (Stanford University). - InstrumentInstrumentThe science instrument used to produce the data.HST>ACS/WFC, HST>WFPC2 , and CXO>ACIS
- Exposure DatesExposure DatesThe date(s) that the telescope made its observations and the total exposure time.November 5, 2006 and June 6, 2007
- FiltersFiltersThe camera filters that were used in the science observations.HST: F450W (B) HST: (V), and F814W (I) ACIS: X-ray
- Object NameObject NameA name or catalog number that astronomers use to identify an astronomical object.MACS J0025.4-1222
- Object DescriptionObject DescriptionThe type of astronomical object.Galaxy Cluster
- Release DateAugust 27, 2008
- Science ReleaseA Clash of Clusters Provides New Clue to Dark Matter
- Credit
The image is a composite of separate exposures made by Hubble Space Telescope ACS and WFPC2 detectors and the Chandra ACIS detector. The color results from assigning different hues (colors) to each monochromatic image. In this case, the assigned colors are: Pink (ordinary matter/hot gas): X-ray Blue (dark matter map): F450W (B) Yellow/cyan: F555W (V), + F814W (I)

Share
Details
Claire Andreoli
NASA’s Goddard Space Flight Center
Greenbelt, Maryland
claire.andreoli@nasa.gov