


1 min read
Using Hubble to Chart the Future Motions of Stars Within a Cluster
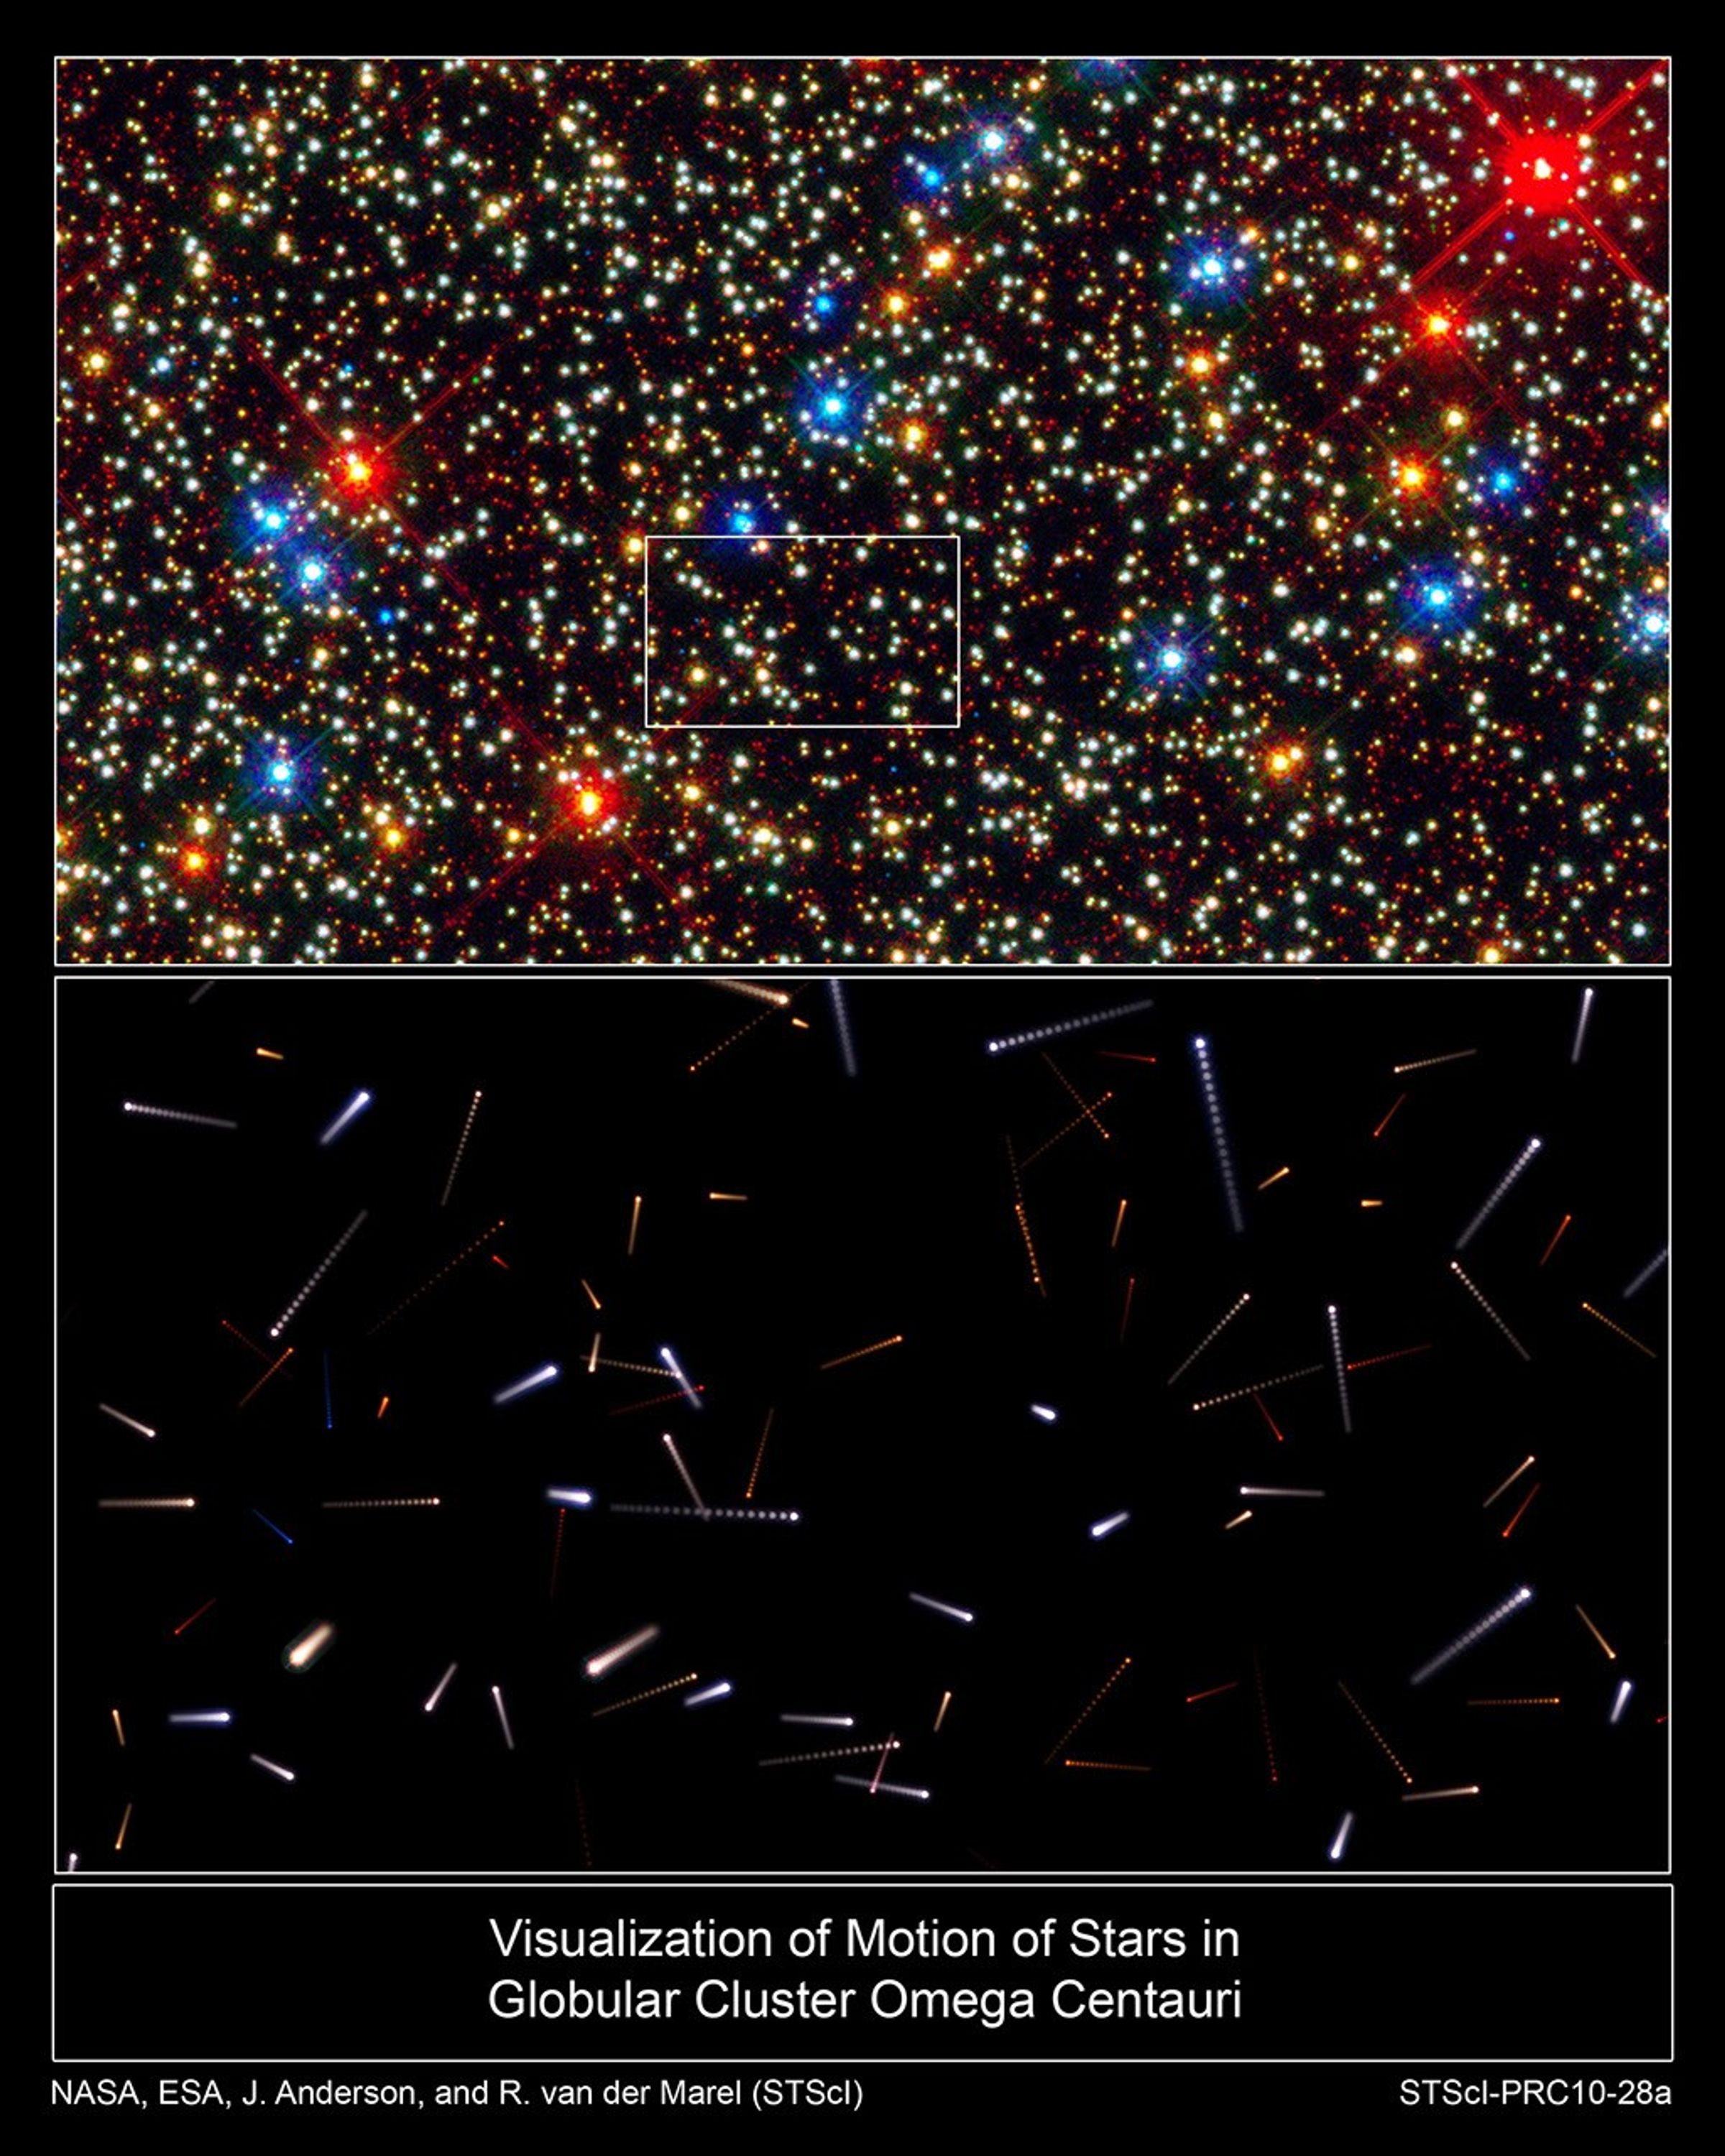
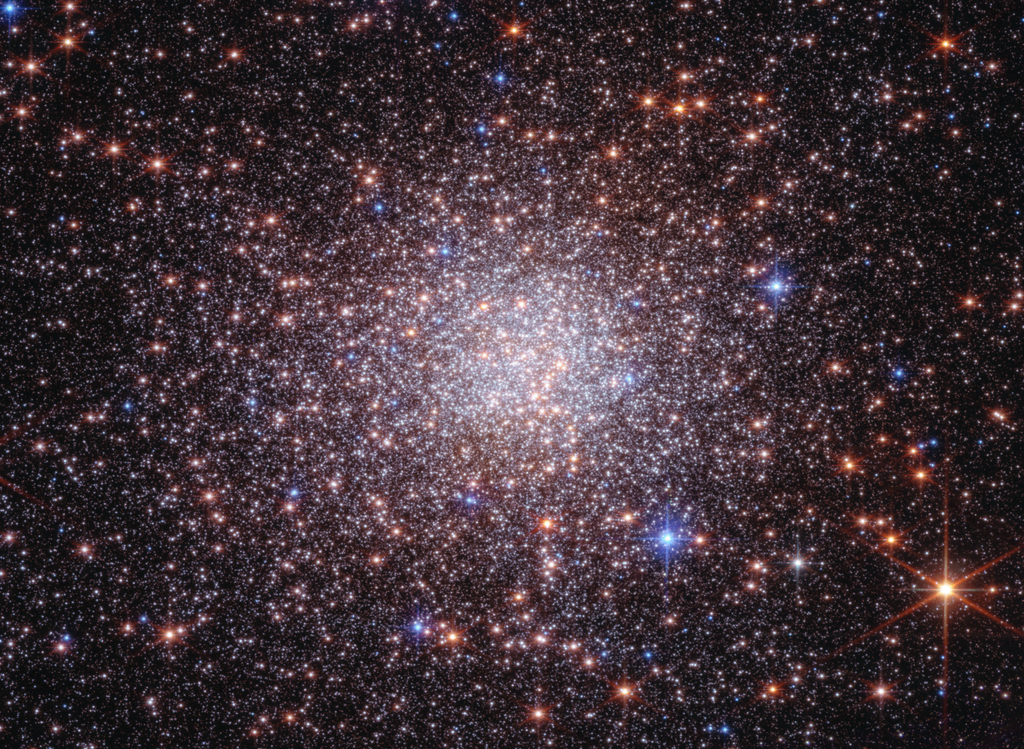
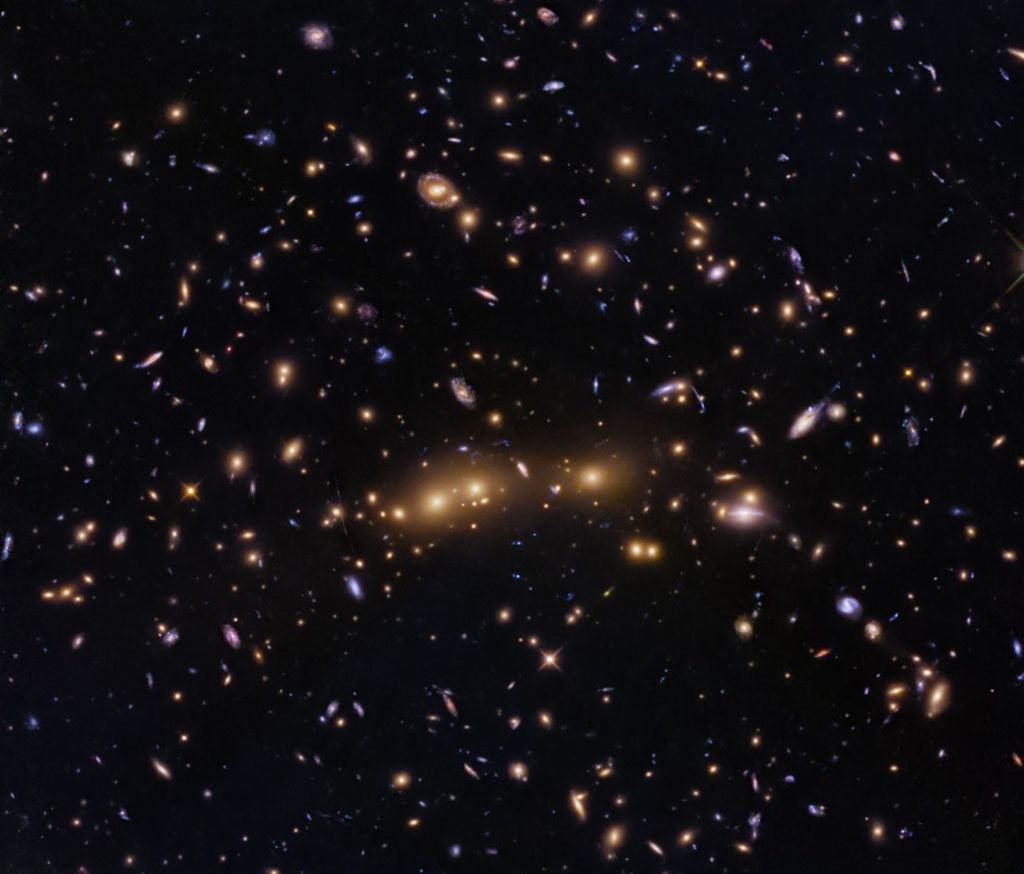
The multicolor snapshot, at top, taken with Wide Field Camera 3 aboard NASA's Hubble Space Telescope, captures the central region of the giant globular cluster Omega Centauri. All the stars in the image are moving in random directions, like a swarm of bees. Astronomers used Hubble's exquisite resolving power to measure positions for stars in 2002 and 2006.
From these measurements, they can predict the stars' future movement. The bottom illustration charts the future positions of the stars highlighted by the white box in the top image. Each streak represents the motion of the star over the next 600 years. The motion between dots corresponds to 30 years.
About the Object
- R.A. PositionR.A. PositionRight ascension – analogous to longitude – is one component of an object's position.13h 26m 47.2s
- Dec. PositionDec. PositionDeclination – analogous to latitude – is one component of an object's position.-47° 28' 46.44"
- ConstellationConstellationOne of 88 recognized regions of the celestial sphere in which the object appears.Centaurus
- DistanceDistanceThe physical distance from Earth to the astronomical object. Distances within our solar system are usually measured in Astronomical Units (AU). Distances between stars are usually measured in light-years. Interstellar distances can also be measured in parsecs.16,000 light-years or 4,800 parsecs
About the Data
- Data DescriptionData DescriptionProposal: A description of the observations, their scientific justification, and the links to the data available in the science archive.
Science Team: The astronomers who planned the observations and analyzed the data. "PI" refers to the Principal Investigator.The Hubble images were created from data from the calibration proposal 11452: E. Sabbi, J. Kim Quijano, and L. Dressel (STScI). The proper motions of stars in the cluster were obtained from the following ACS proposals: 9442 A. Cool (San Francisco State Univ.), J. Anderson (STScI), C. Bailyn (Yale Univ.), J. Carlin (San Francisco Univ.), P. Edmonds (Eureka Scientific), J. Grindlay (Harvard Univ.), and D. Haggard (Univ. of Washington); 10252: J. Anderson (STScI) and I. King (Univ. of Washington); and 10775: A. Sarajedini (Univ. of Florida), J. Anderson (STScI), A. Aparicio (Inst. de Astrofisica de Canarias), L. Bedin (STScI), B. Chaboyer (Dartmouth College), I. King (Univ. of Washington), S. Majewski (Univ. of Virginia), G. Piotto (Univ. of Padua), N. Reid (STScI), A. Rosenberg (Inst. de Astrofisica de Canarias), and M. Siegel (Univ. of Texas, Austin) - InstrumentInstrumentThe science instrument used to produce the data.HST>ACS/WFC and HST>WFC3/UVIS
- Exposure DatesExposure DatesThe date(s) that the telescope made its observations and the total exposure time.ACS: June 27-30, 2002, December 11, 2004, and June 22, 2006 WFC3/UVIS: July 15, 2009, Exposure Time: 2.7 hours
- FiltersFiltersThe camera filters that were used in the science observations.F225W (U), F275W (U), F336W (U), F438W (B), F606W (V), and F814W (I)
- Object NameObject NameA name or catalog number that astronomers use to identify an astronomical object.Omega Centauri, NGC 5139, Omega Cen
- Object DescriptionObject DescriptionThe type of astronomical object.Globular Star Cluster
- Release DateOctober 26, 2010
- Science ReleaseHubble Data Used to Look 10,000 Years into the Future
- Credit
The image is a composite of separate exposures made by the WFC3 instrument on the Hubble Space Telescope. Three filters were used to sample broad wavelength ranges. The color results from assigning different hues (colors) to each monochromatic image. In this case, the assigned colors are: Blue: F225W (U) Green: F336W (U) Red: F814W (I)

Related Images & Videos


Omega Centauri: Delving into an Archeological Fossil of the Universe
Space Telescope Science Institute astronomers Jay Anderson and Roeland van der Marel discuss their in-depth study of the giant cluster Omega Centauri. The team used Hubble's exquisite resolving power to measure the positions for stars in 2002 and 2006. From these measurements,...
Omega Centauri Observation Zoom Sequence and Future Star Motions
This movie sequence begins with a ground-based image of the giant globular star cluster Omega Centauri and zooms very tightly in to a Hubble Space Telescope image of the central region of the cluster. In a simulation based on Hubble data, the stars appear to be moving in random...
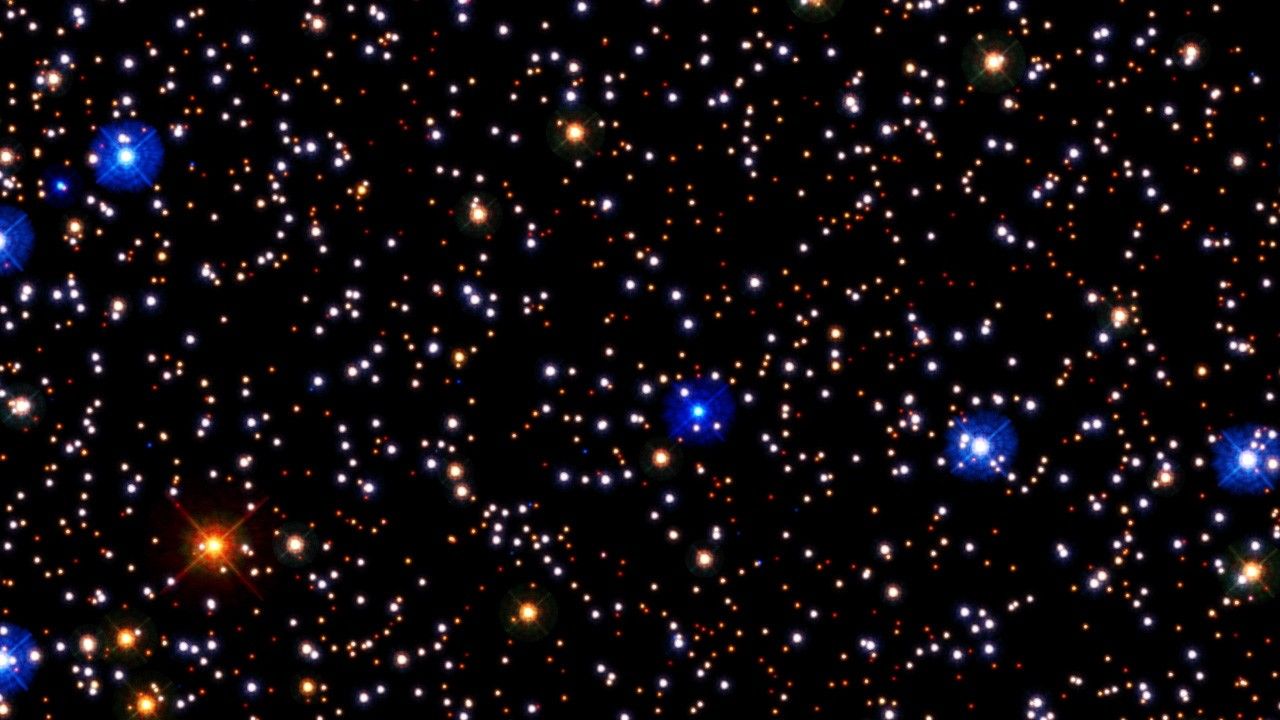
Omega Centauri Model Zoom Sequence and Future Star Motions
This is a zoom into a simulated model of the globular star cluster Omega Centauri. All the stars appear to be moving in random directions, like a swarm of bees. Astronomers used Hubble's exquisite resolving power to measure positions for stars in 2002 and 2006. From these...
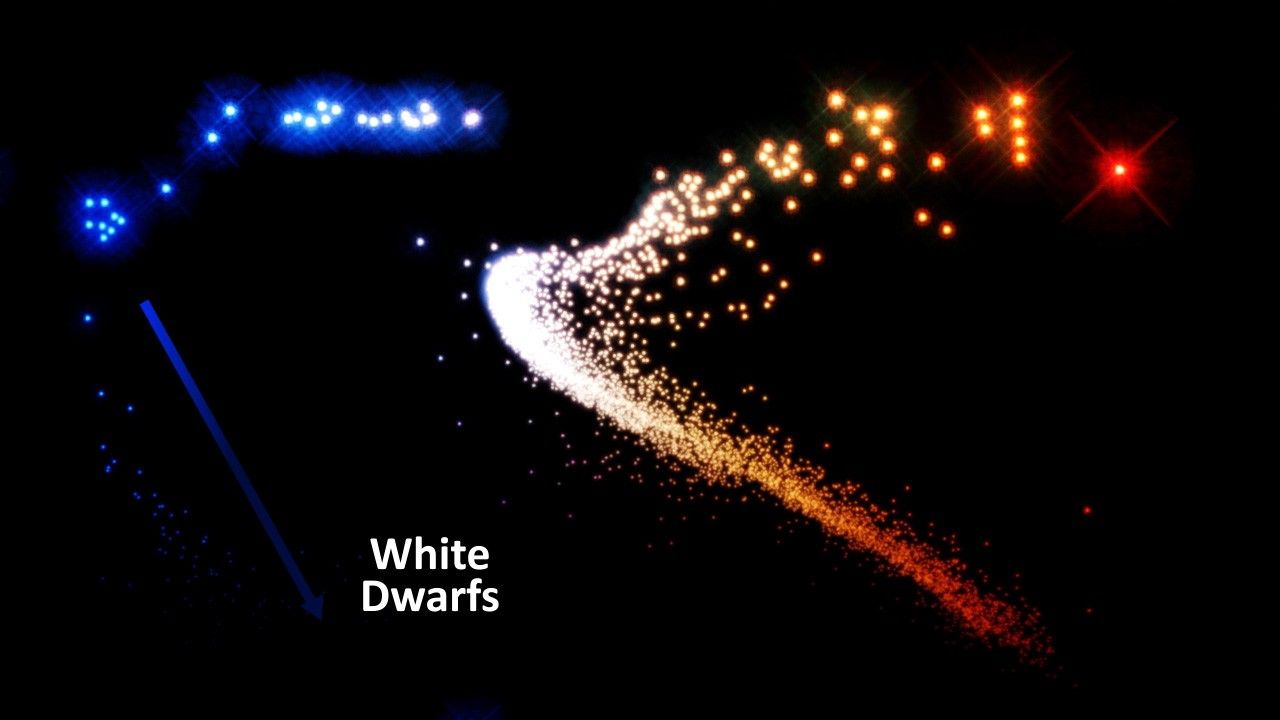
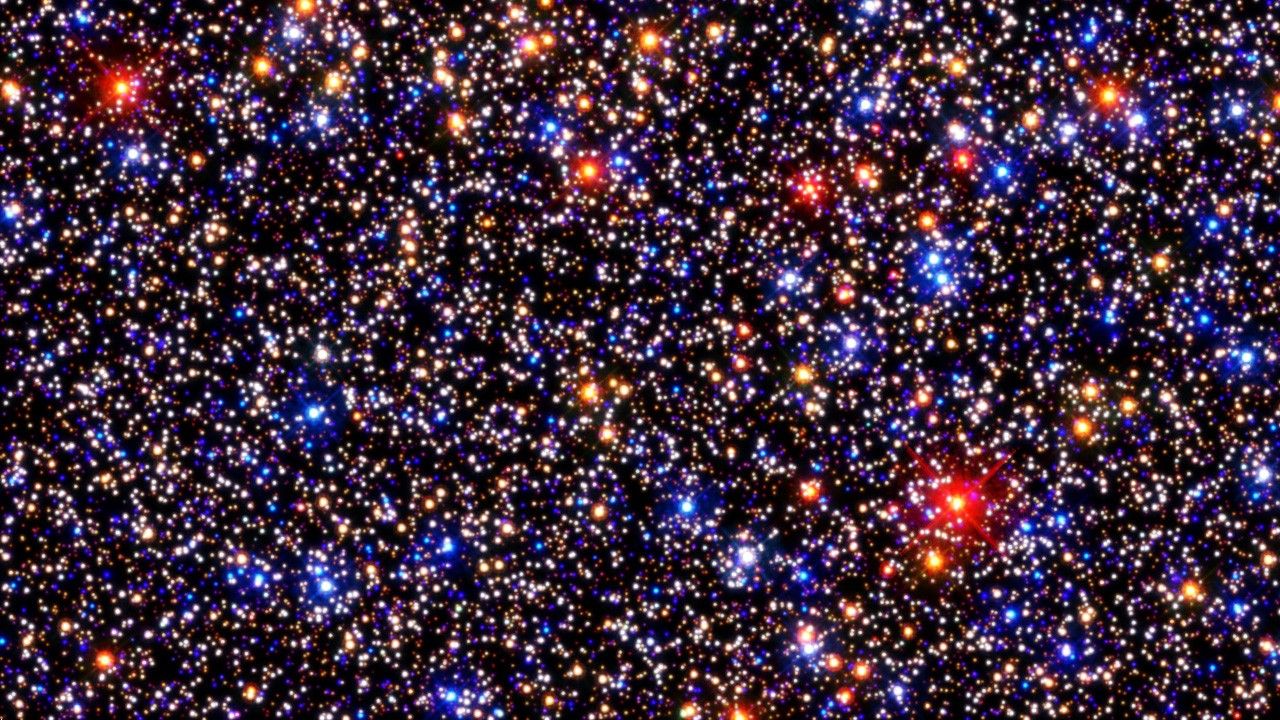
Constructing the Hertzsprung-Russell Diagram for Globular Star Cluster
A Hubble Space Telescope color image of the core of the globular star cluster Omega Centauri is used to construct a Hertzsprung-Russell diagram of the stellar populations in the cluster. When stars are sorted by brightness and color they can be used to create a graph that...
Share
Details
Claire Andreoli
NASA’s Goddard Space Flight Center
Greenbelt, Maryland
claire.andreoli@nasa.gov