


1 min read
Phoenix Cluster Individual Wavelengths
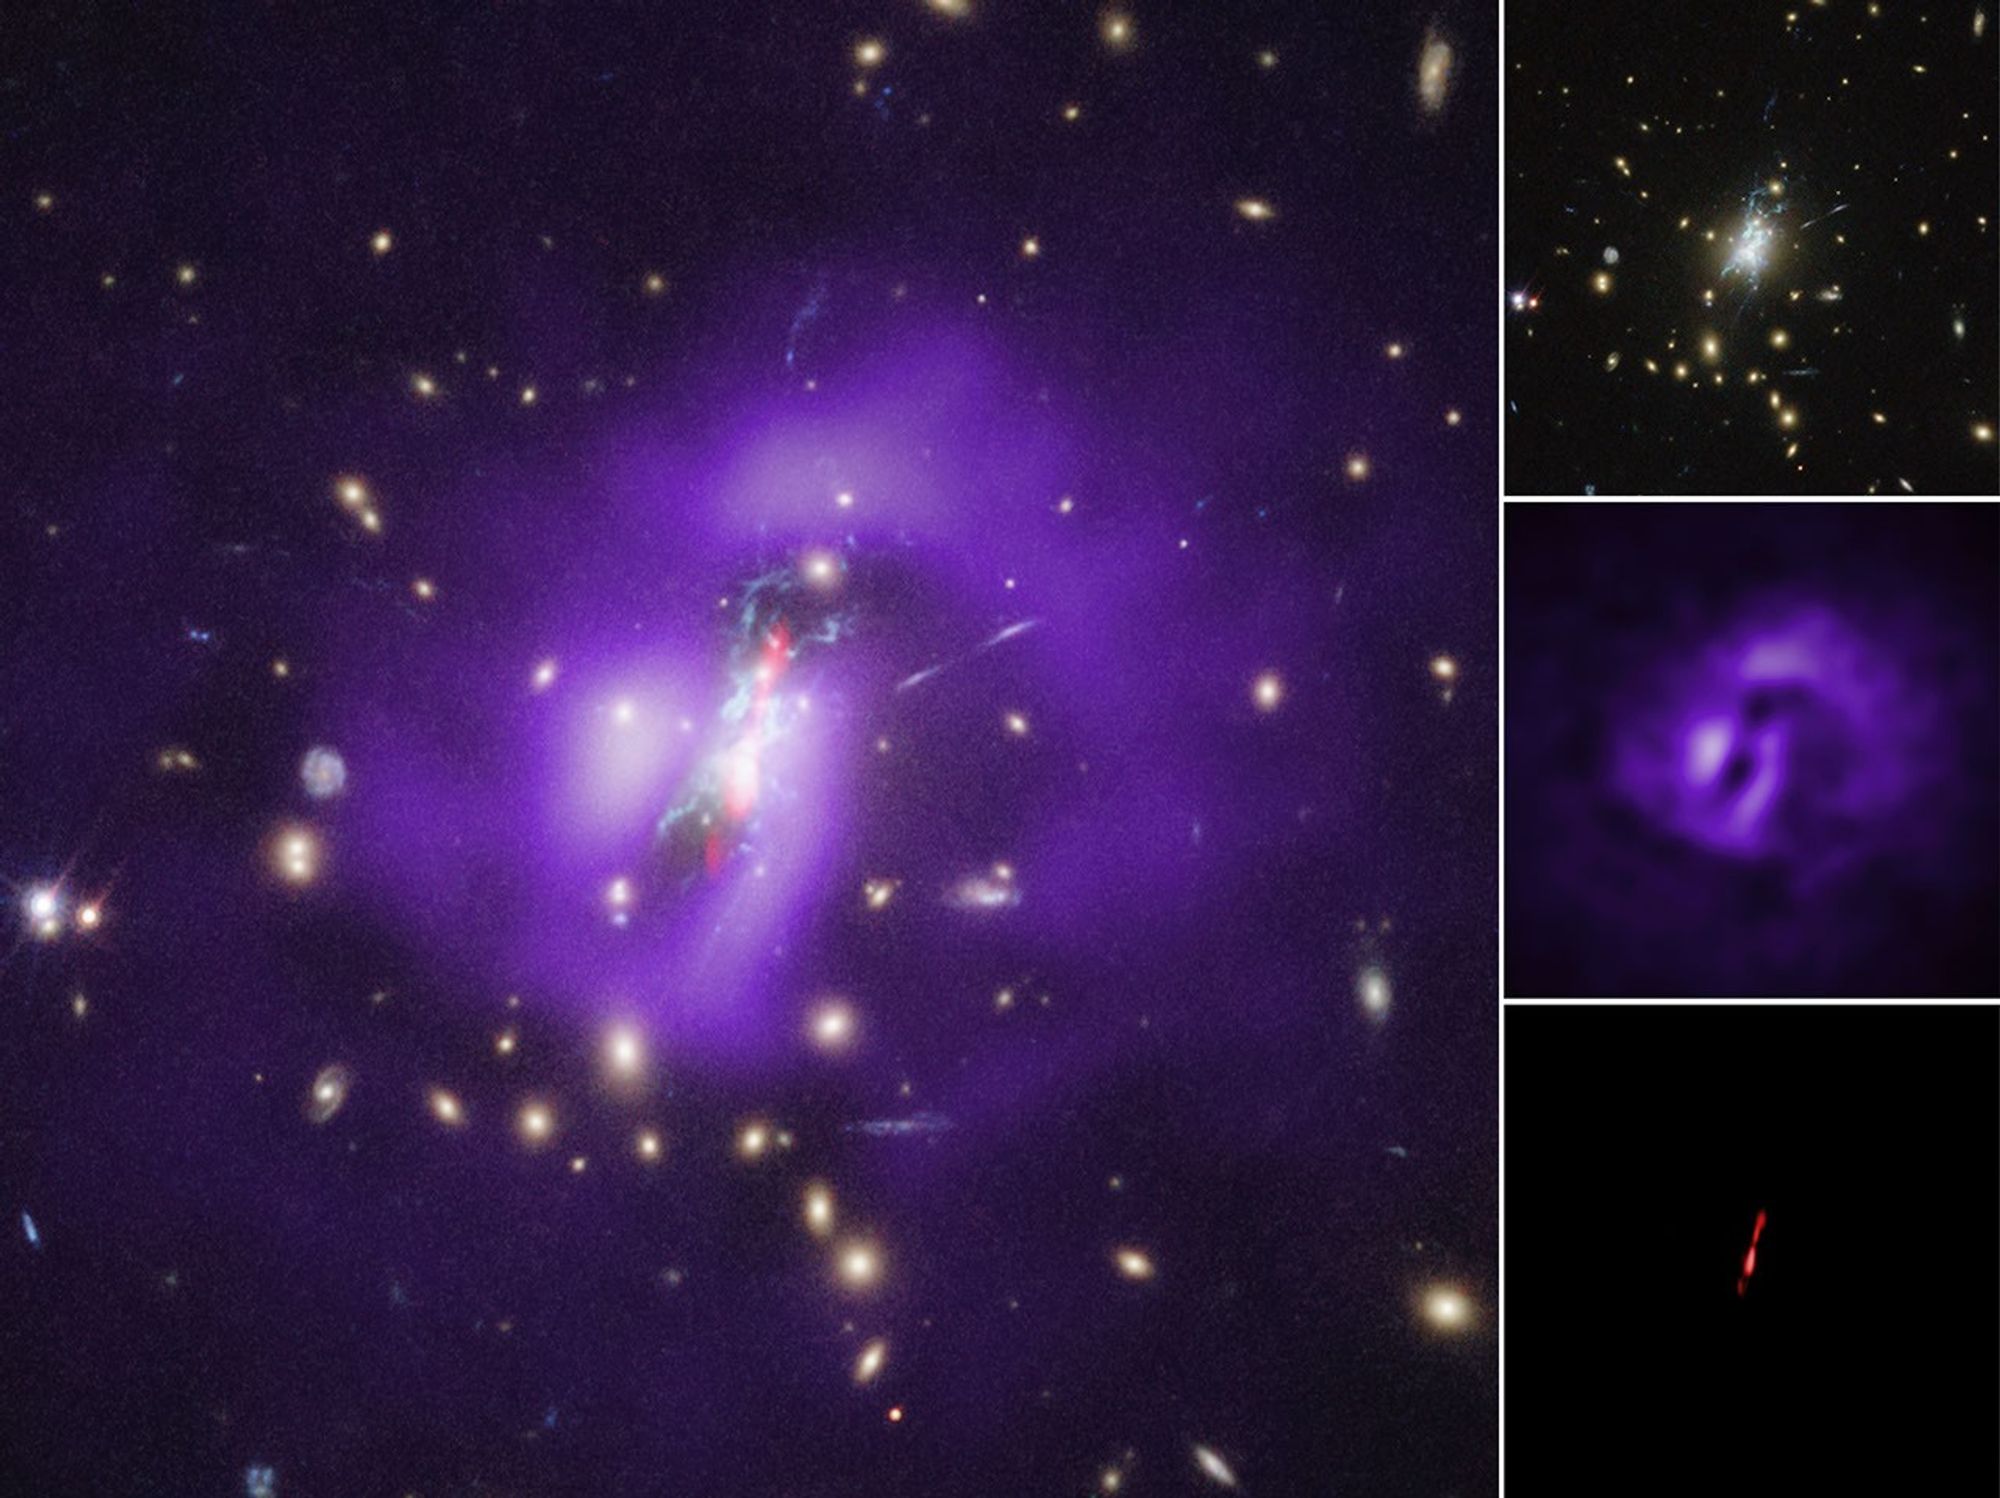
The Phoenix galaxy cluster contains the first confirmed supermassive black hole that is unable to prevent large numbers of stars from forming in the core of the galaxy cluster where it resides.
The Phoenix Cluster system has several distinct elements that help tell the story of its unusually high star formation. Data from NASA's Chandra X-ray Observatory show that the coolest gas it can detect is located near the center of the cluster. In the absence of significant sources of heat, astronomers expect cooling to occur at the highest rates in a cluster’s center, where the densest gas is located.
Optical observations with the Hubble Space Telescope provide evidence for further cooling of gas near the center of the Phoenix Cluster. Ten billion solar masses of cooler gas are located along filaments to the north and south of the black hole, which likely originate from outbursts by the supermassive black hole located in the center of the image. The outbursts generated jets seen in radio waves by the Very Large Array (VLA) radio telescope. As the jets push outward, they inflated cavities, or bubbles, in the hot gas that pervades the cluster. Chandra’s sharp X-ray vision detected these cavities.
This image was made by combining data from Chandra, Hubble and the VLA. X-rays from Chandra depict hot gas in purple and radio emission from the VLA features jets in red. Optical light data from Hubble show galaxies (in yellow), and filaments of cooler gas where stars are forming (in light blue).
About the Object
- R.A. PositionR.A. PositionRight ascension – analogous to longitude – is one component of an object's position.23:44:40.9
- Dec. PositionDec. PositionDeclination – analogous to latitude – is one component of an object's position.-42:41:54
- ConstellationConstellationOne of 88 recognized regions of the celestial sphere in which the object appears.Phoenix
- DistanceDistanceThe physical distance from Earth to the astronomical object. Distances within our solar system are usually measured in Astronomical Units (AU). Distances between stars are usually measured in light-years. Interstellar distances can also be measured in parsecs.5.73 billion light-years (z=0.597)
- DimensionsDimensionsThe physical size of the object or the apparent angle it subtends on the sky.Image is 44 arcsec across (about 1.2 million light-years)
About the Data
- Data DescriptionData DescriptionProposal: A description of the observations, their scientific justification, and the links to the data available in the science archive.
Science Team: The astronomers who planned the observations and analyzed the data. "PI" refers to the Principal Investigator.The HST observations include those from programs 15315 (M. McDonald) - InstrumentInstrumentThe science instrument used to produce the data.ACS/WFC
- Exposure DatesExposure DatesThe date(s) that the telescope made its observations and the total exposure time.May-July 2018
- FiltersFiltersThe camera filters that were used in the science observations.F475W, F775W, F850LP
- Object NameObject NameA name or catalog number that astronomers use to identify an astronomical object.Phoenix Cluster
- Object DescriptionObject DescriptionThe type of astronomical object.Cluster of galaxies
- Release DateNovember 18, 2019
- Science ReleaseA Weakened Black Hole Allows Its Galaxy To Awaken
- Credit
These images are a composite of separate exposures acquired by the ACS instrument on the Hubble Space Telescope. Several filters were used to sample narrow wavelength ranges. The color results from assigning different hues (colors) to each monochromatic (grayscale) image associated with an individual filter. In this case, the assigned colors are: Blue: F475W Green: F775W Red: F850LP
Related Images & Videos
Share
Details
Claire Andreoli
NASA’s Goddard Space Flight Center
Greenbelt, Maryland
claire.andreoli@nasa.gov