


1 min read
ULLYSES: Hubble’s Ultraviolet Survey of Young Stars
NASA’s Hubble Space Telescope surveyed actively forming and recently formed stars in ultraviolet light over three years. The result is ULLYSES, the Ultraviolet Legacy Library of Young Stars as Essential Standards, an unmatched set of information known as spectra that will help researchers pin down how young stars form and shape their nearby environments.
How many stars did Hubble observe? And what might the data tell us? Explore this graphic to learn how Hubble’s ultraviolet data may shape what researchers learn about young stars.
Learn more about the ULLYSES program.
Extended Description and Image Alt Text
Extended Description
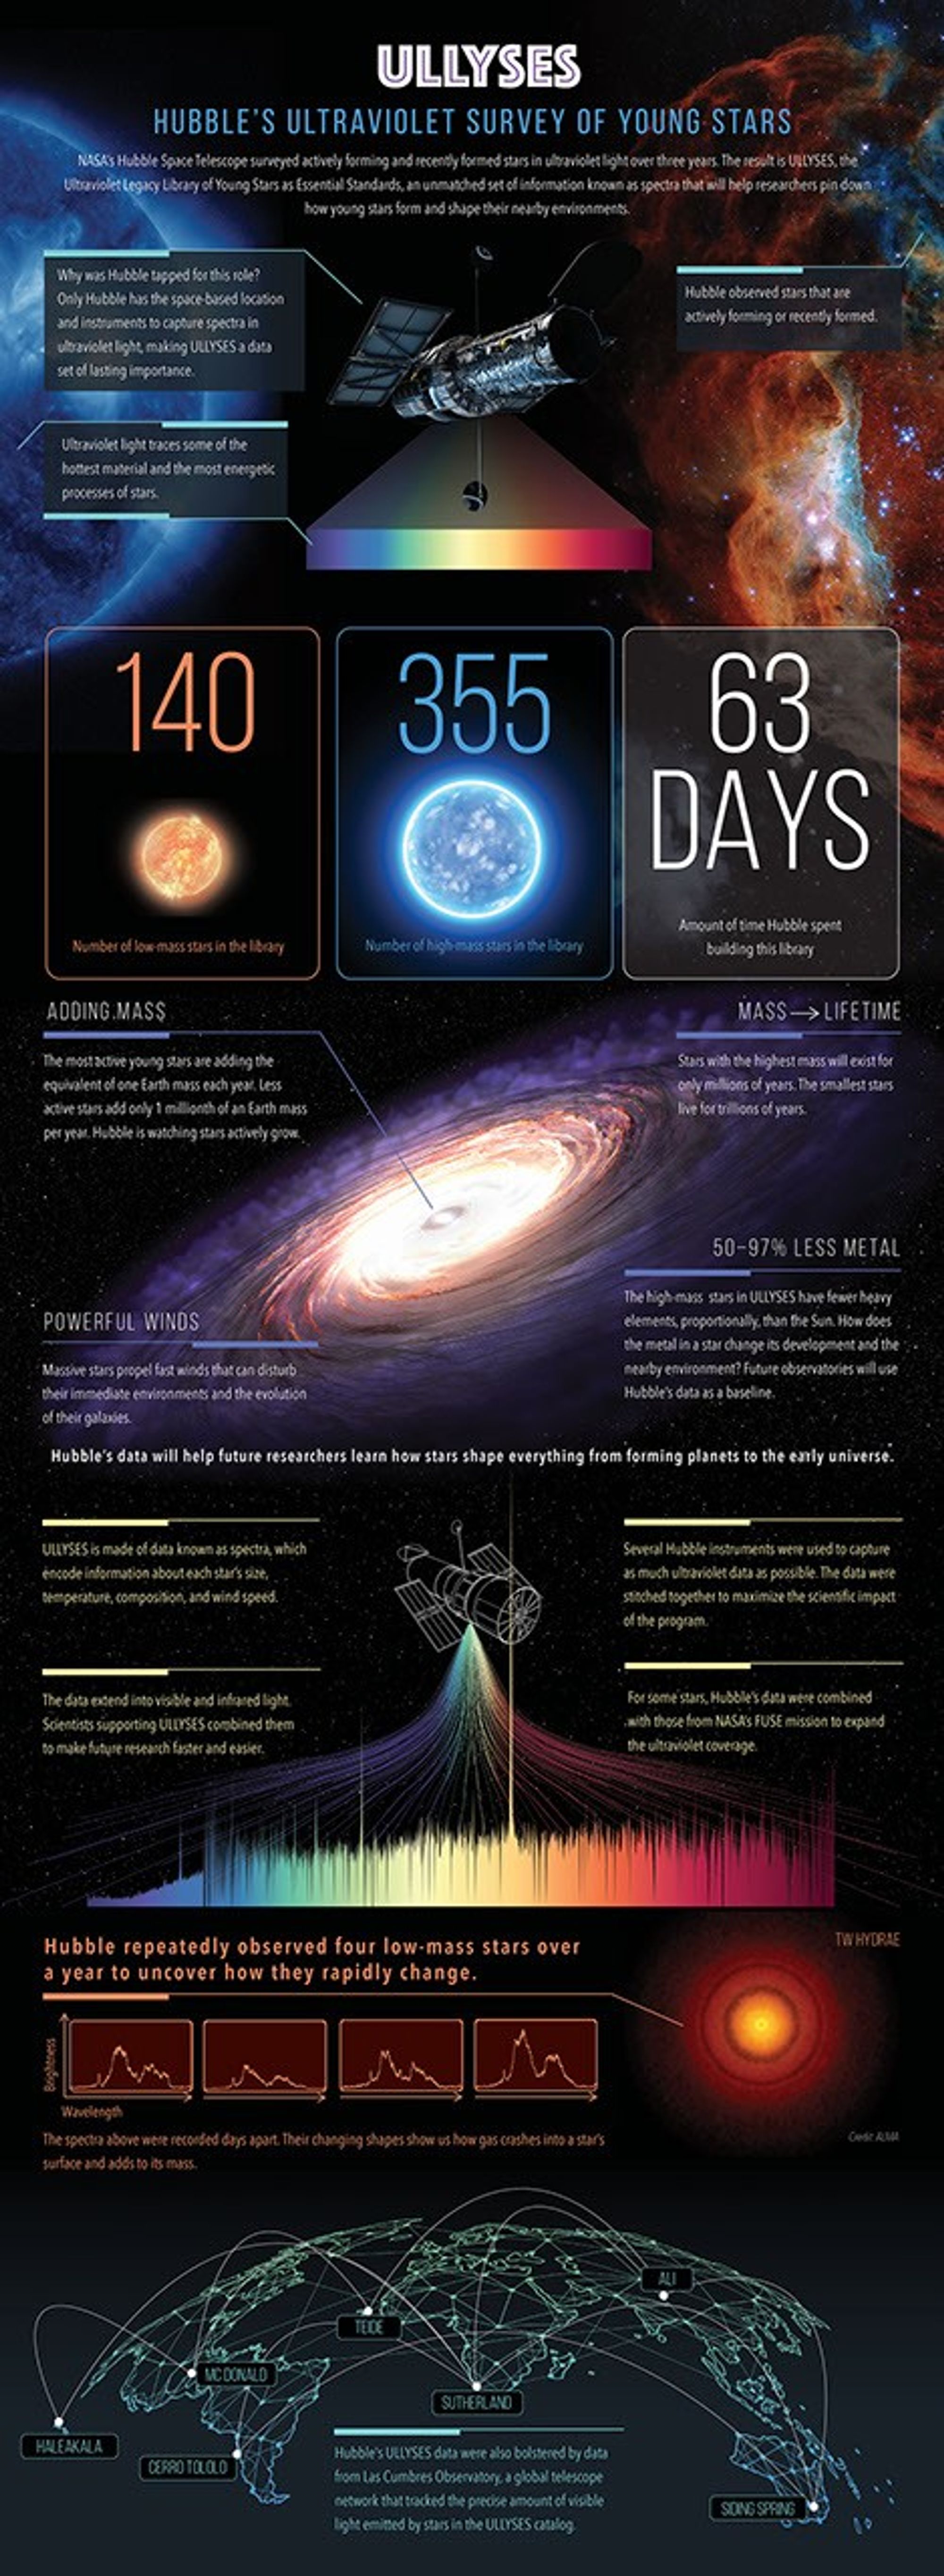
Infographic titled “ULLYSES: Hubble’s Ultraviolet Survey of Young Stars” is split into six sections, each with supporting graphics. All are set against a black background.
Introduction text: NASA’s Hubble Space Telescope surveyed the actively forming and recently formed stars in ultraviolet light over three years. The result is ULLYSES, the Ultraviolet Legacy Library of Young Stars as Essential Standards, an unmatched set of information known as spectra that will help researchers pin down how young stars form and shape their nearby environments.
First section
The topmost portion of the graphic shows the Hubble Space Telescope at the center. The telescope is pointing toward a target slightly to the right. The mirror cover, mirror opening, base of the cylindrical body, and surfaces of the solar panels to the left of the body are visible. Beneath the telescope is a thin rainbow that takes the shape of a rectangle, beginning with purple and ending in red. The rainbow extends upward to meet the base of the Hubble Space Telescope body.
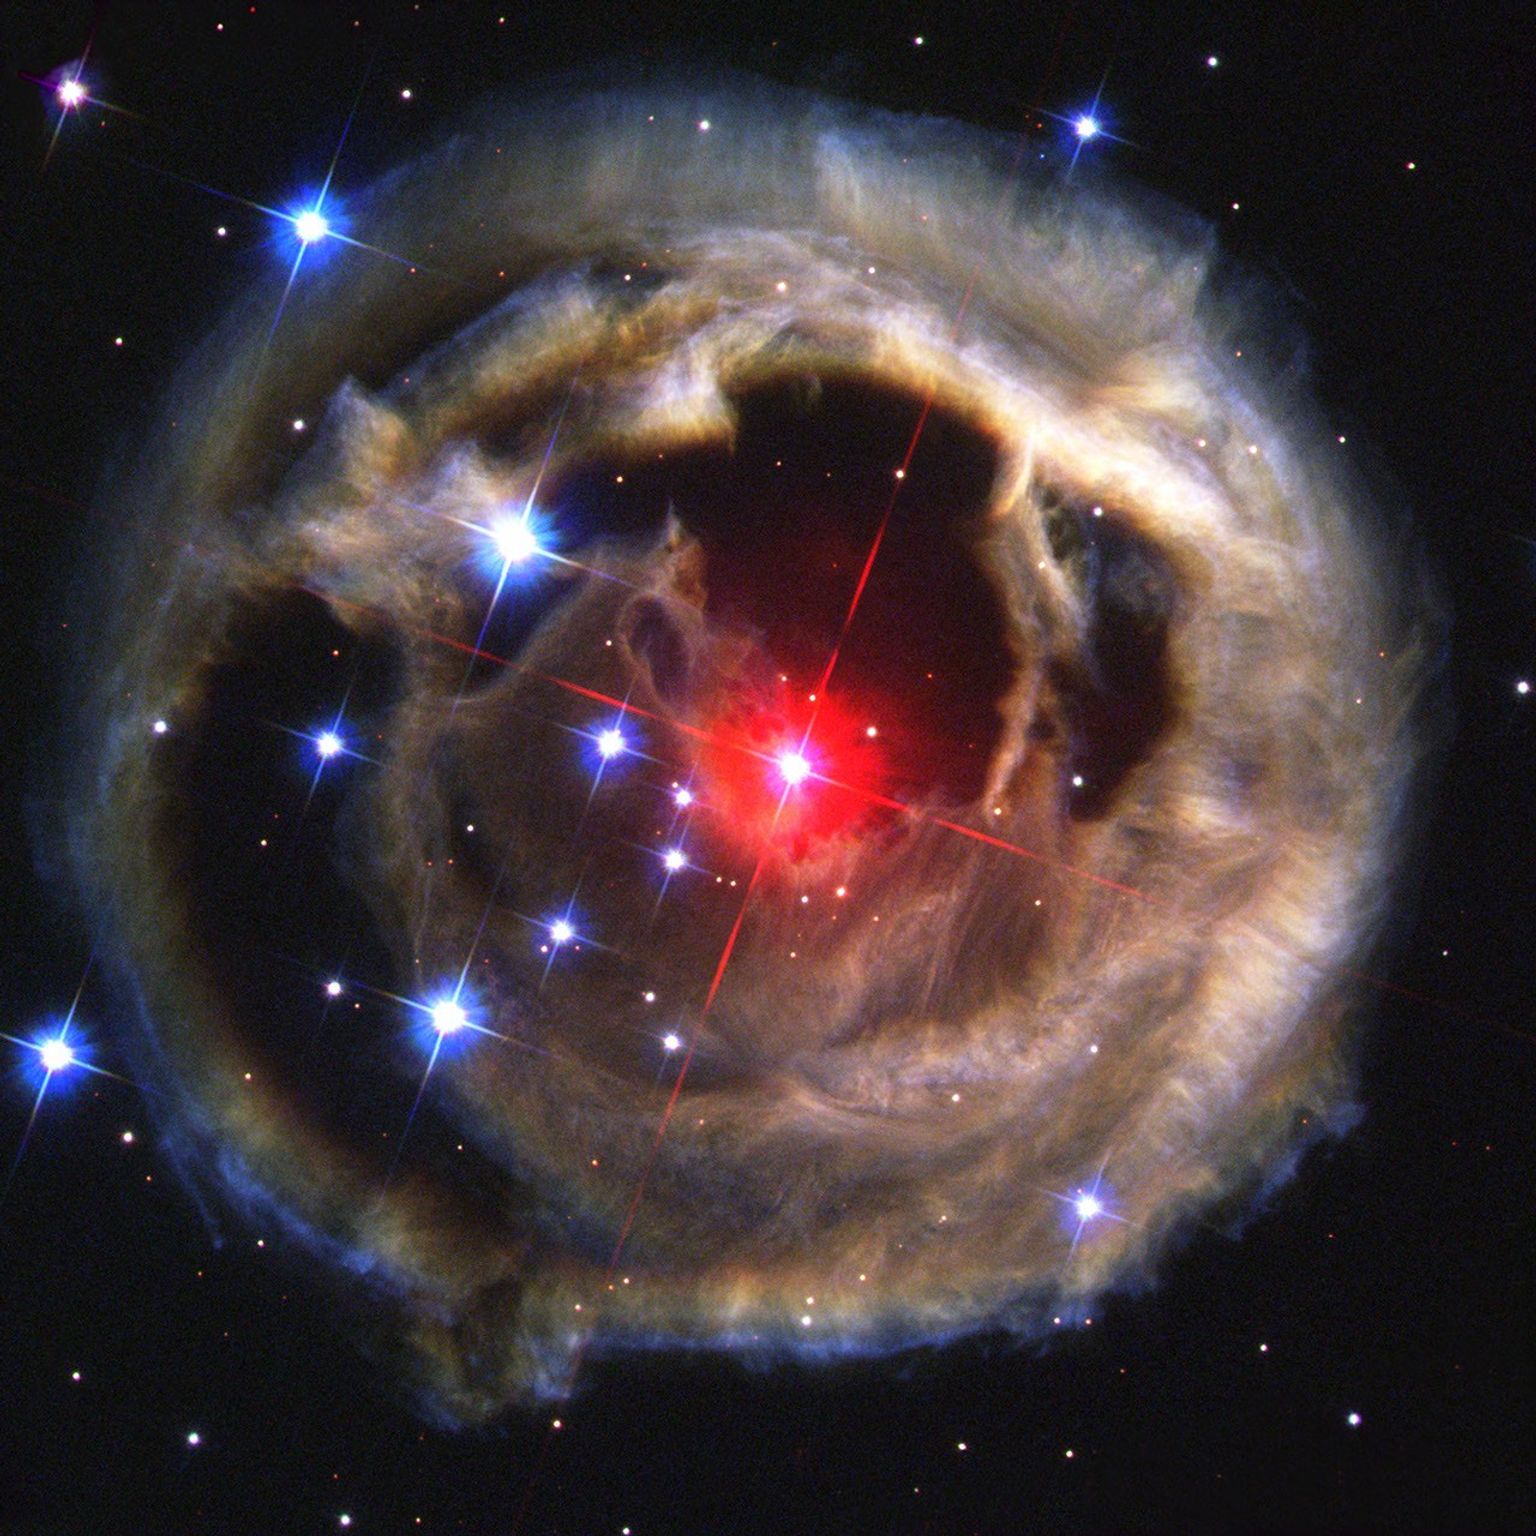
In the background to the left is half of a large blue star with active areas appearing brighter, and a haze of blue extending toward Hubble. To the right is a portion of the Cosmic Reef, a Hubble image. A giant red nebula, filled with transparent and opaque gas and dust appears as a semi-circle that is open to the right. A few bright blue stars are at the center, along with brilliant blue regions at center and toward the top.
Three text areas appear near Hubble, the first appearing at top left and pointing to the telescope. Text: Why was Hubble tapped for this role? Only Hubble has the space-based location and instruments to capture spectra in ultraviolet light, making ULLYSES a data set of lasting importance.
On the box below this, a line at the top points to the blue star. A line at the bottom of the box points to the rainbow at the center. The text reads: Ultraviolet light traces some of the hottest material and the most energetic processes of stars.
The third box, pointing to a blue portion in the Cosmic Reef, at right reads: Hubble observed stars that are actively forming or recently formed.
Second section
Three boxes fill the width. Within them, from left to right:
- 140, number of low-mass stars in the library. This box includes an orange star, which takes up about one sixth of the box.
- 355 number of high-mass stars in the library. This box includes a blue star, which is roughly twice the size of the star to the left.
- 63 days, amount of time Hubble spent building this library
Third section
At the center is an illustration, which takes up the majority of this section, shows a small bright yellow star that is actively gathering mass from the material surrounding it. Material appears to be circling the star counter-clockwise, and is very bright and more yellow toward the inner third. The material becomes redder with more defined circles in the middle, and is purple and fluffy at the outer edges.
Four text boxes are associated with this section, from top left to bottom right:
Adding Mass
The most active young stars are adding the equivalent of one Earth mass each year. Less active stars add only 1 millionth of an Earth mass per year. Hubble is watching stars actively grow.
This section points toward the star at the center of the illustration, which is surrounded by gas and dust. The remaining three text blocks do not point to specific regions in the illustration.
Mass → Lifetime
Stars with the highest mass will exist for only millions of years. The smallest stars live for trillions of years.
Powerful Winds
Massive stars propel fast winds that can disturb their immediate environments and the evolution of their galaxies.
50–97% Less Metal
The high-mass stars in ULLYSES have fewer heavy elements, proportionally, than the Sun. How does the metal in a star change its development and the nearby environment? Future observatories will use Hubble’s data as a baseline.
Below this runs slightly larger text:
Hubble’s data will help future researchers learn how stars shape everything from forming planets to the early universe.
Fourth section
At the center is a white outline of the Hubble Space Telescope, a rainbow flows from a portion at the lower center, slowly widening to take up the full width of this section. The rainbow, which also begins in purple and ends in red, has both tall and short peaks throughout, representing a one-dimensional spectrum.
Four text boxes, from top left to bottom right, accompany this section:
ULLYSES is made up of data known as spectra, which encode information about each star’s size, temperature, composition, and wind speed.
Several Hubble instruments were used to capture as much ultraviolet data as possible. The data were stitched together to maximize the scientific impact of the program.
The data extend into visible and infrared light. Scientists supporting ULLYSES combined them to make future research faster and easier.
For some stars, Hubble’s data were combined with those from NASA’s FUSE mission to expand the ultraviolet coverage.
Fifth section
Larger text: Hubble repeatedly observed four low-mass stars over a year to uncover how they rapidly change.
Underneath the text is a line that runs almost to the right, pointing at an orange star with a disk of gas and dust surrounding it, seen face-on. It is labeled TW Hydrae, credit: ALMA.
Also beneath the line, at left, are four charts, each known as a spectrum, showing brightness on the y-axis and wavelength on the x-axis. All four show wiggly lines with several peaks, some rising half way to the top. All four charts plot unique points.
Below the charts, text: The spectra above were recorded days apart. Their changing shapes show us how gas crashes into a star’s surface and adds to its mass.
Sixth section
A world map is spread left to right, taking a semi-circular shape. Each continent has several points on it, but only some are labeled. Those that are labeled have white arcs that connect them. From left to right, labels read: Haleakala, Cerro Tololo, McDonald, Teide, Sutherland, Ali, Siding Spring.
Text reads: Hubble’s ULLYSES data were also bolstered by data from Las Cumbres Observatory, a global telescope network that tracked the precise amount of visible light emitted by stars in the ULLYSES catalog.
Image Alt Text
Graphic titled “ULLYSES: Hubble’s Ultraviolet Survey of Young Stars” shows the Hubble Space Telescope at the center. Beneath the telescope is a thin rainbow that takes the shape of a rectangle, beginning with purple and ending in red. Three text areas appear near Hubble. Beneath them are three boxes with large numbers.
Share
Details
Claire Andreoli
NASA’s Goddard Space Flight Center
Greenbelt, Maryland
claire.andreoli@nasa.gov
NASA, ESA, Elizabeth Wheatley (STScI)