


1 min read
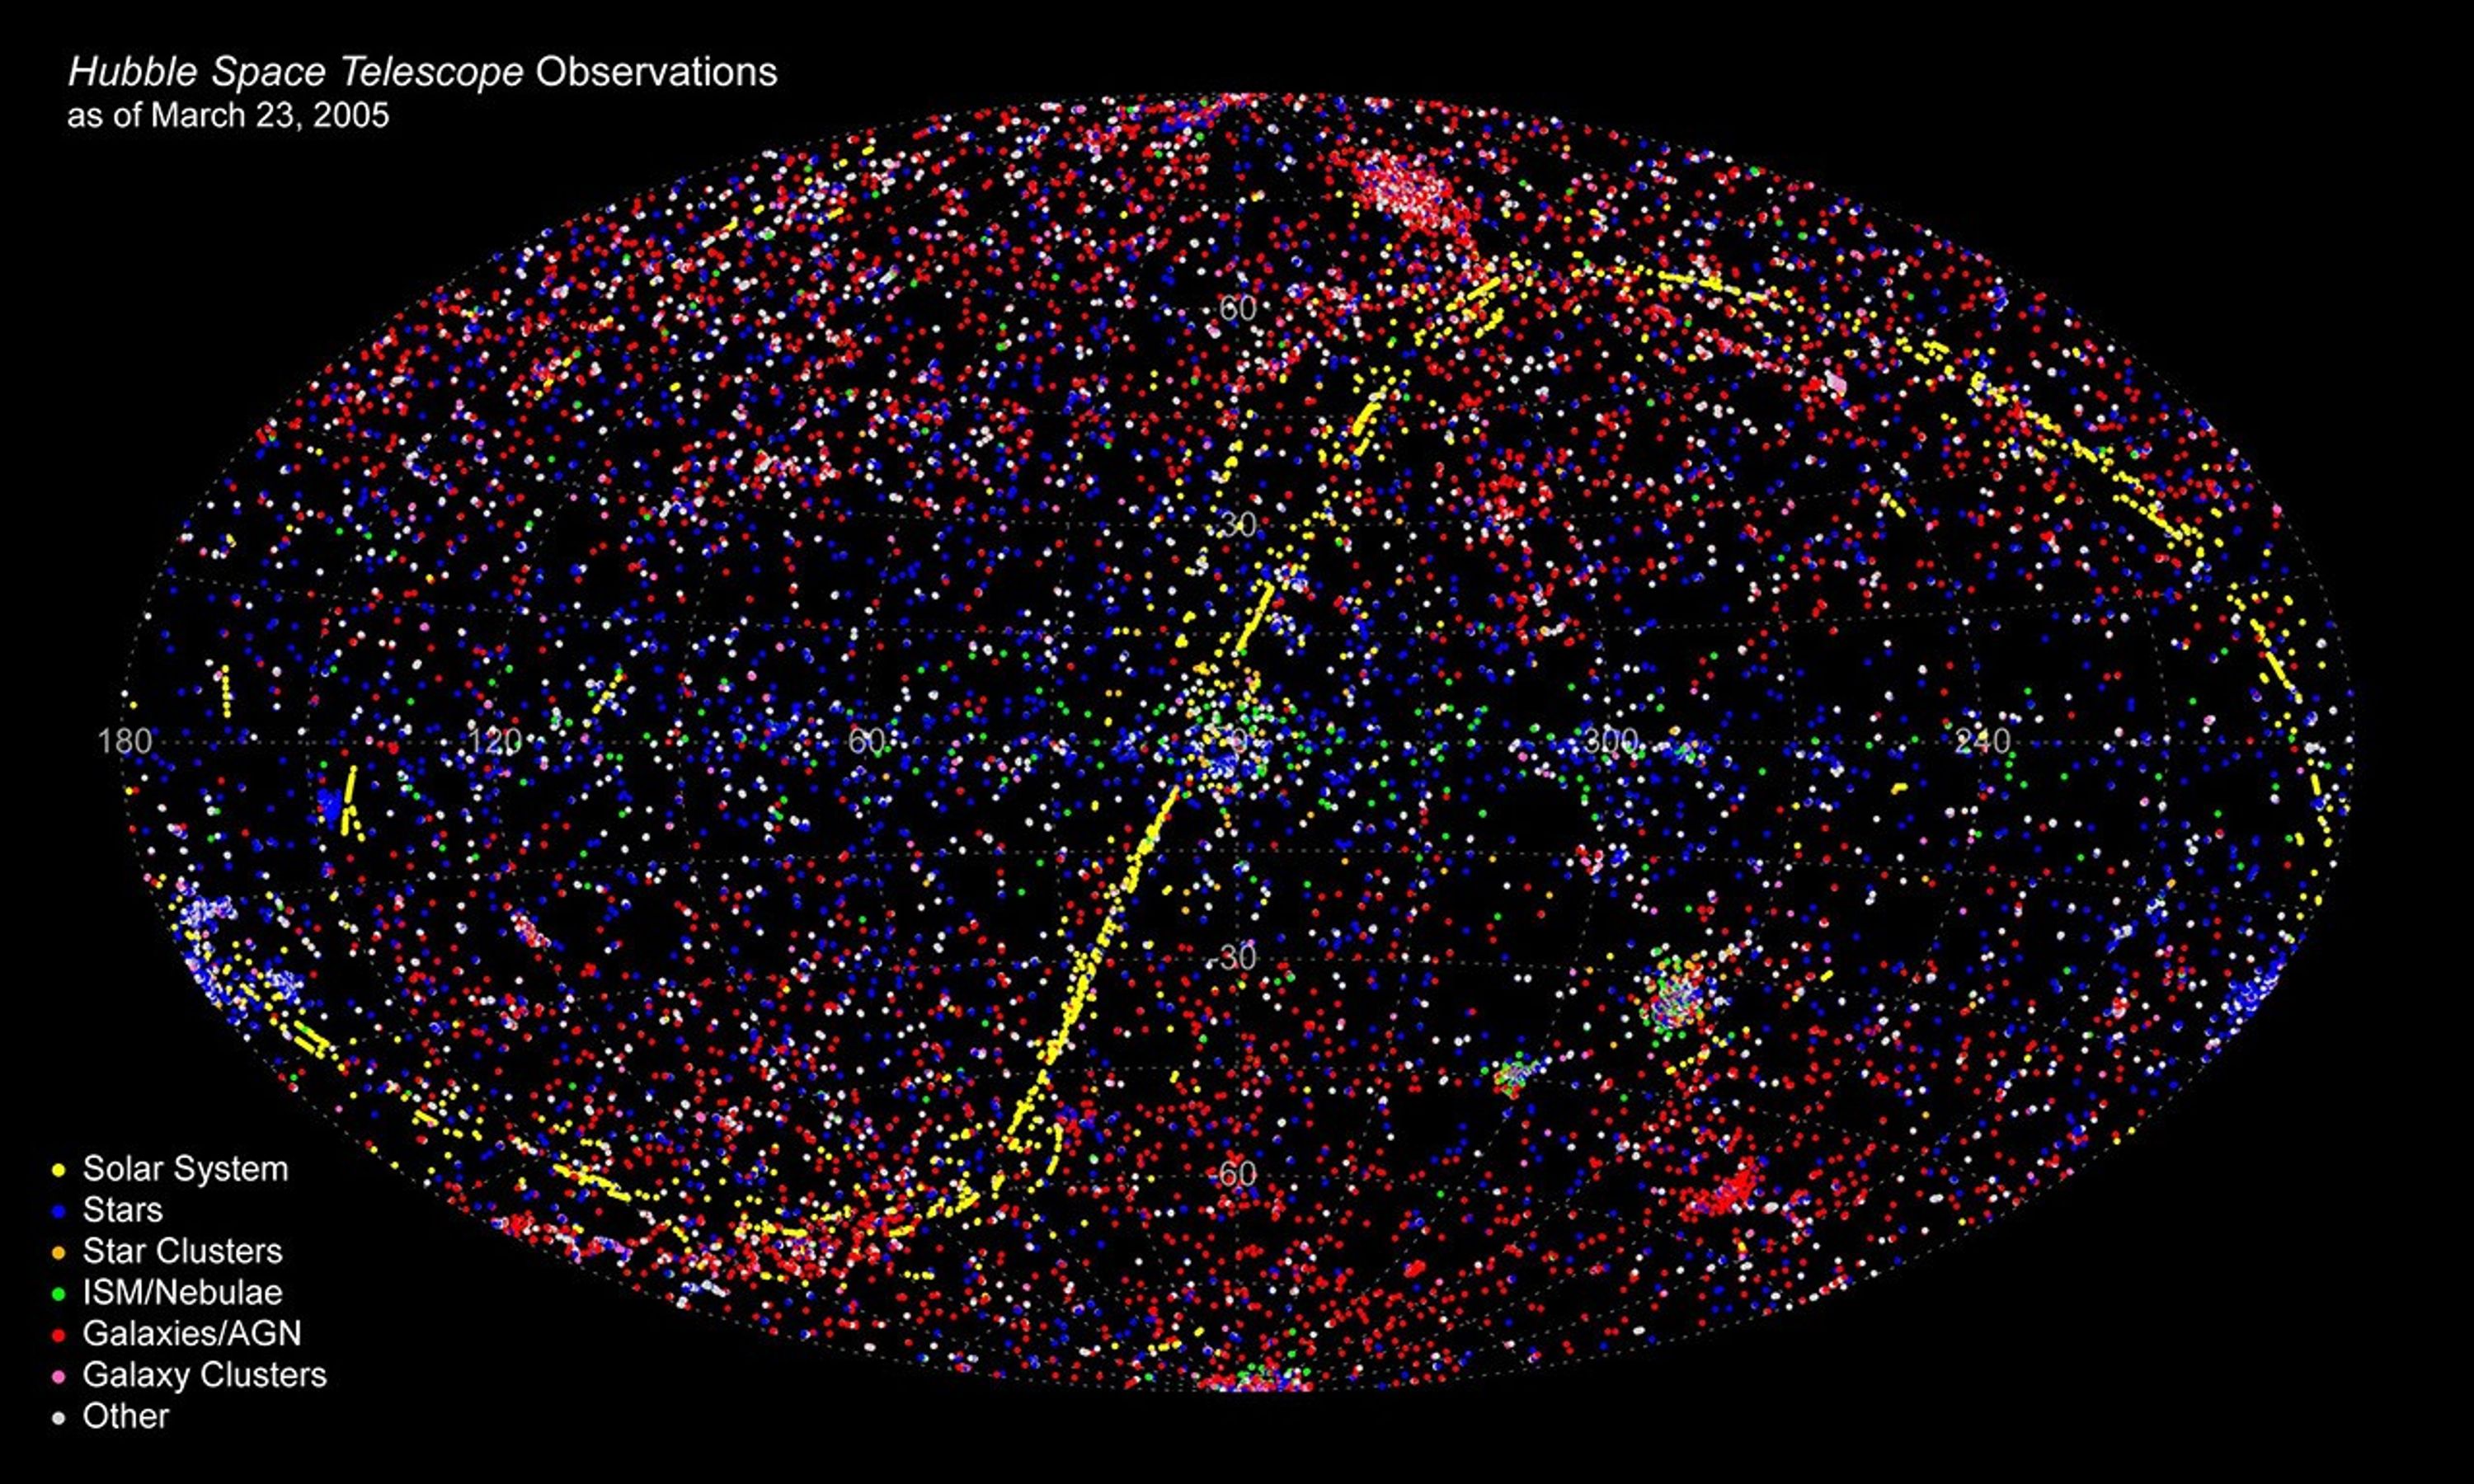
All-Sky Plot of All HST Observations as of Mar. 23, 2005
- Release DateApril 25, 2005
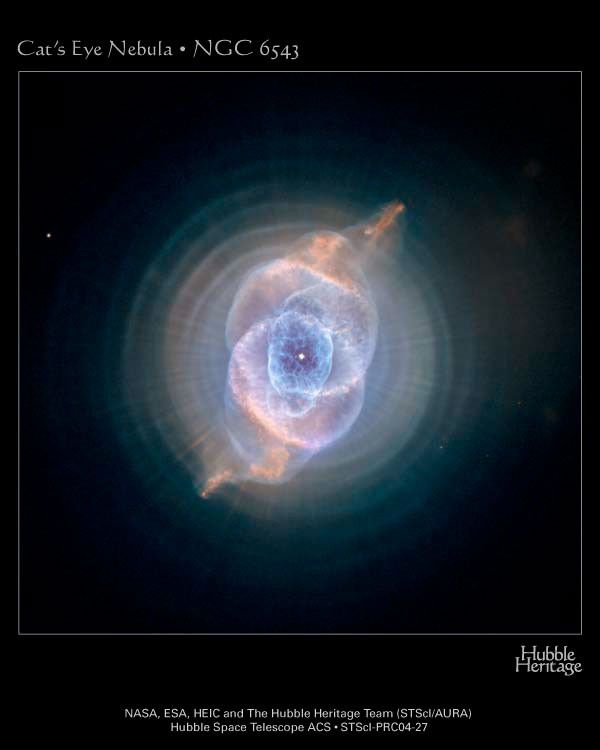
- Science ReleaseHubble Celebrates 15th Anniversary with Spectacular New Images
- Credit
Related Images & Videos

Out of This Whirl: the Whirlpool Galaxy (M51) and Companion Galaxy
The graceful, winding arms of the majestic spiral galaxy M51 (NGC 5194) appear like a grand spiral staircase sweeping through space. They are actually long lanes of stars and gas laced with dust. This sharpest-ever image of the Whirlpool Galaxy, taken in January 2005 with the...

The Eagle Has Risen: Stellar Spire in the Eagle Nebula
Appearing like a winged fairy-tale creature poised on a pedestal, this object is actually a billowing tower of cold gas and dust rising from a stellar nursery called the Eagle Nebula. The soaring tower is 9.5 light-years or about 57 trillion miles high, about twice the distance...


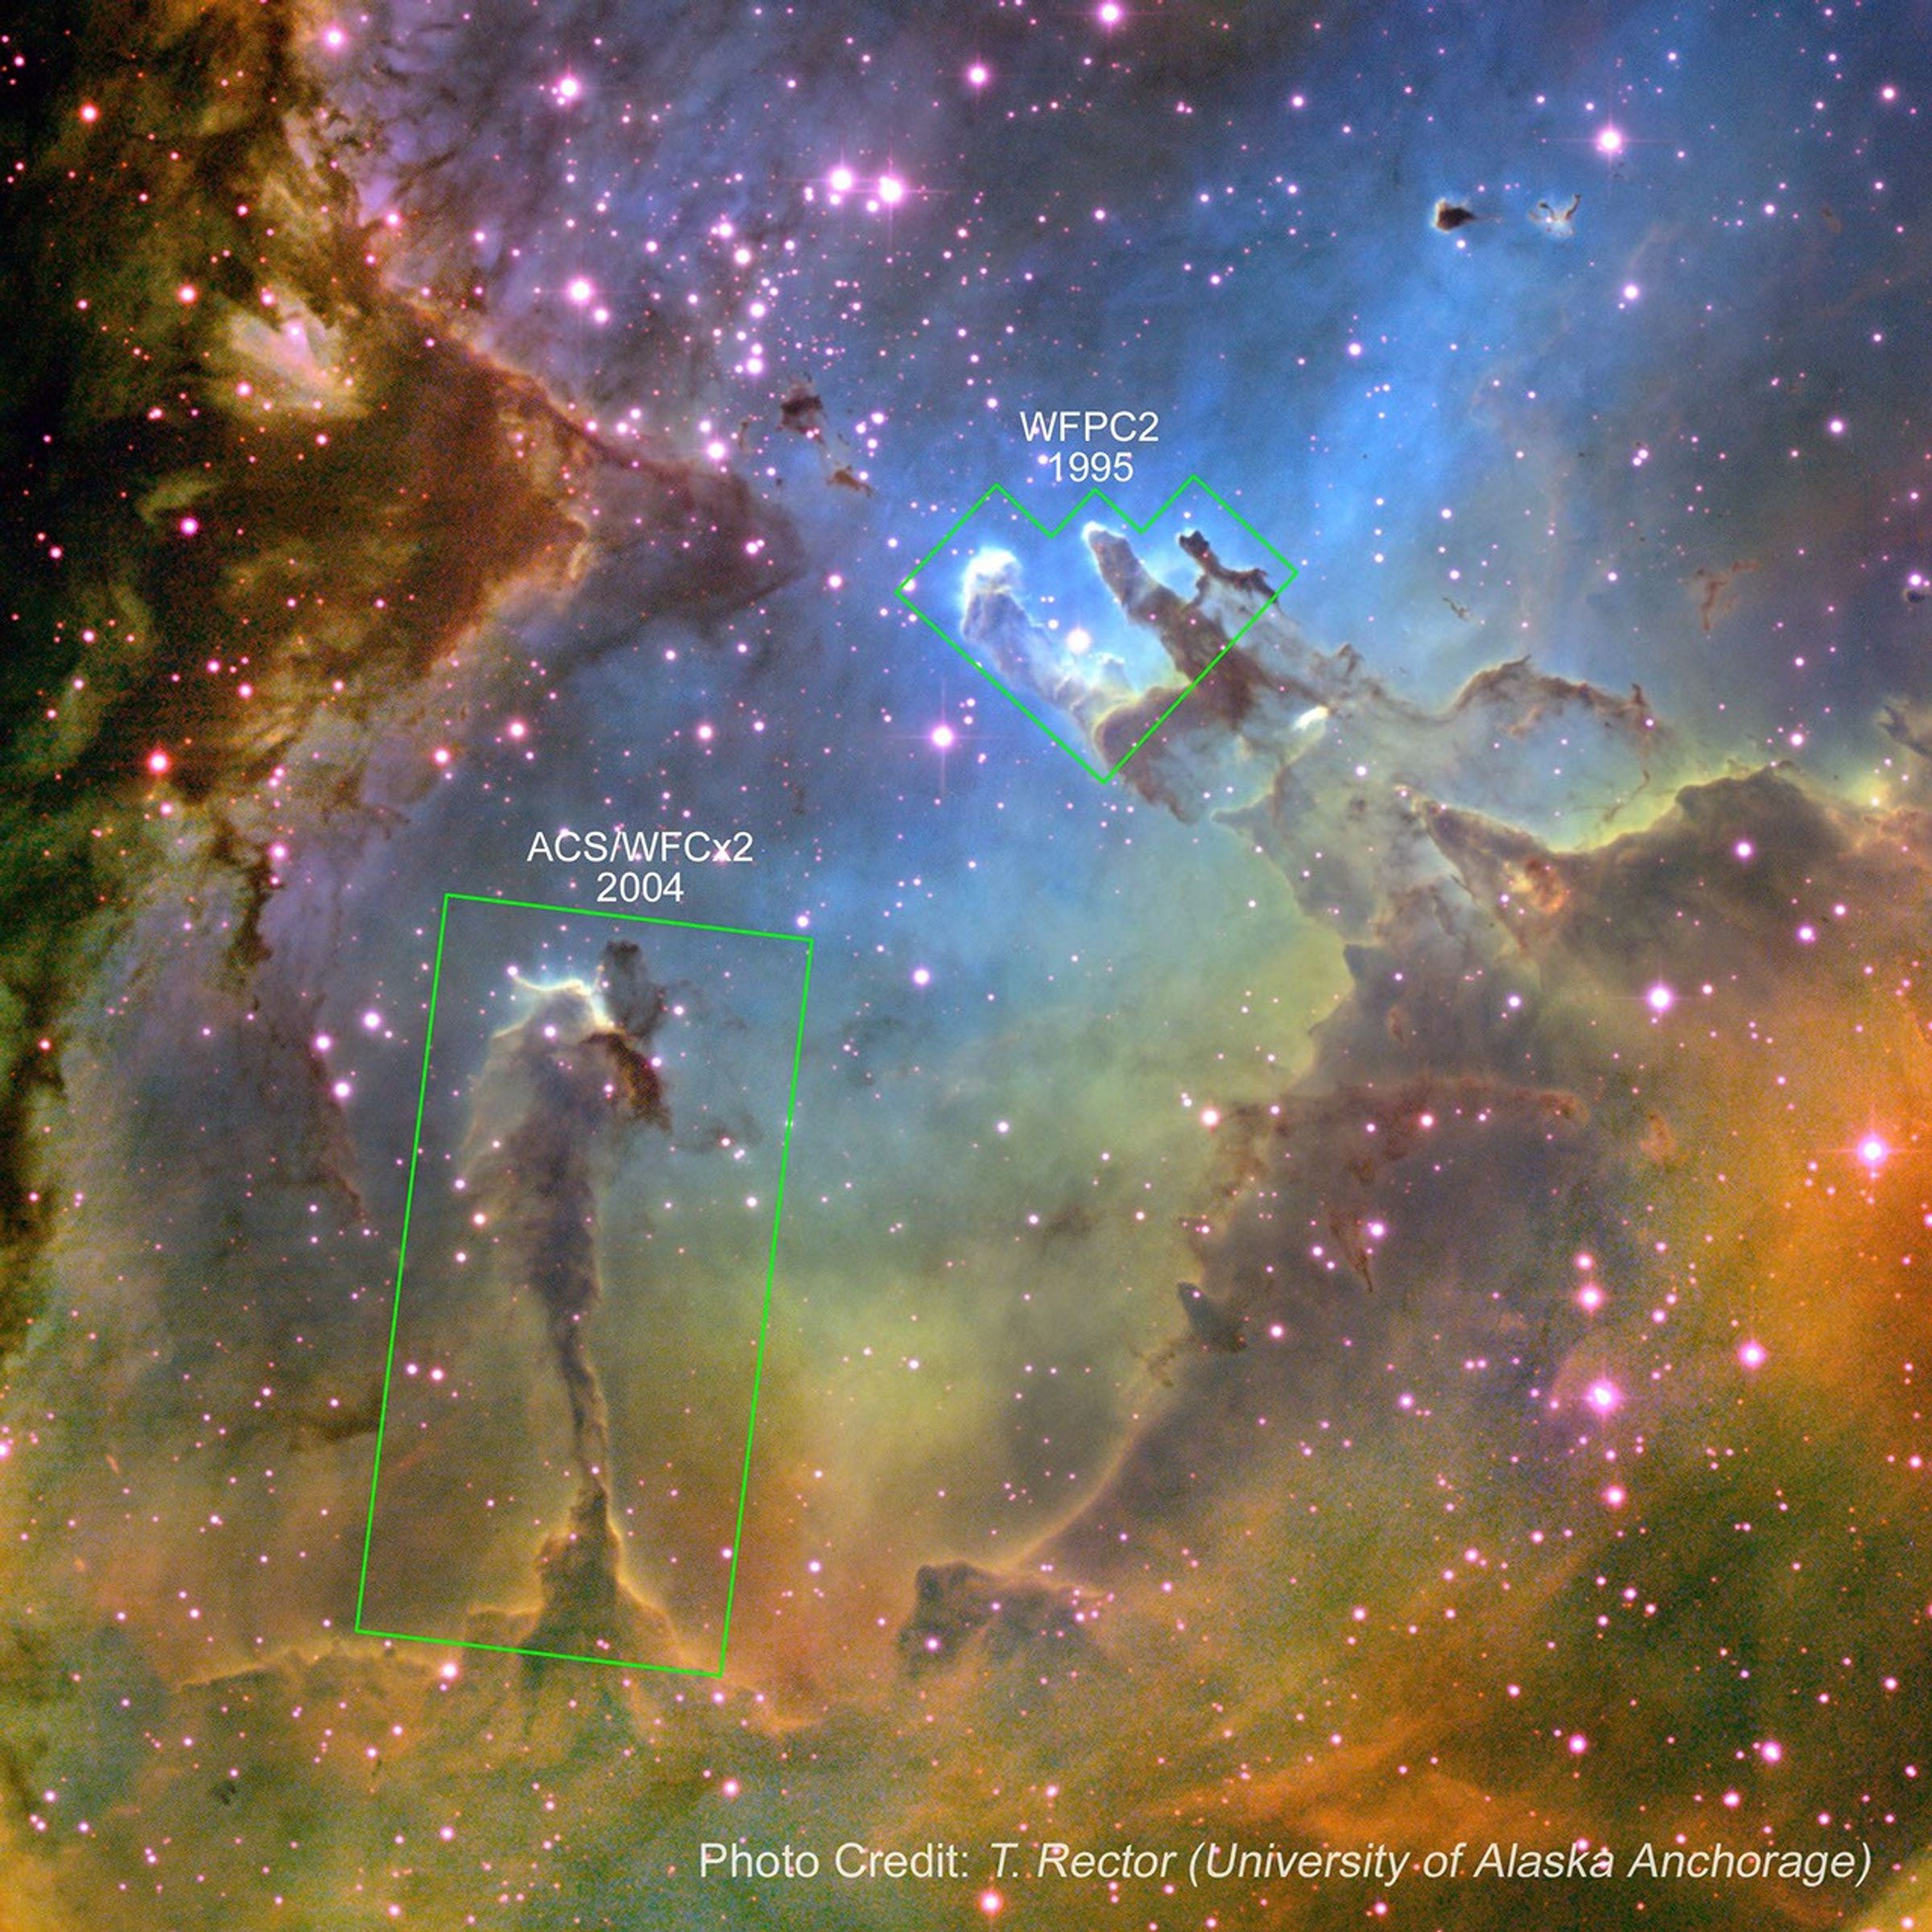
Location of HST images in the Eagle Nebula
This wide-field image of the Eagle Nebula was taken at the National Science Foundation's 0.9-meter telescope on Kitt Peak with the NOAO Mosaic CCD camera. It shows the areas seen in greater detail with Hubble's Wide-Field Planetary Camera 2 (WFPC2) in 1995 and Advanced Camera...


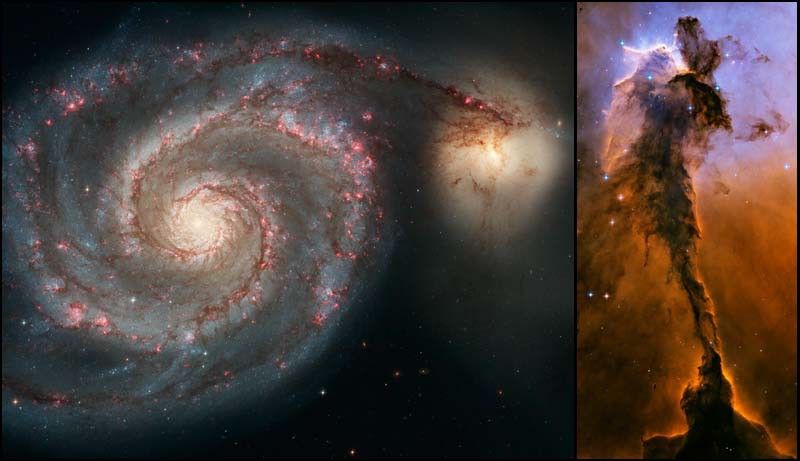
Hubble's 15th Anniversary Images of the Whirlpool Galaxy (M51) and Eagle Nebula
During the 15 years NASA's Hubble Space Telescope has orbited the Earth, it has taken more than 700,000 photos of the cosmos; images that have awed, astounded and even confounded astronomers and the public. NASA released new views today of two of the most well-known objects...


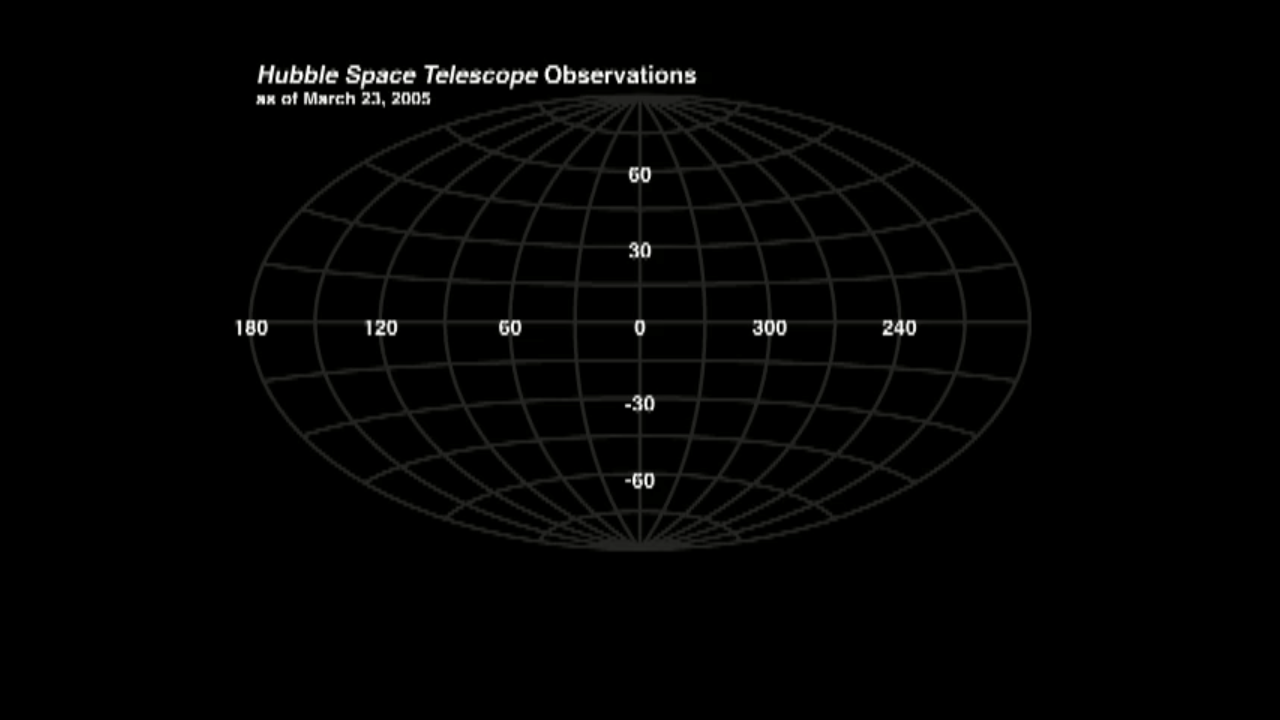
Hubble Observations Sky Map Animation
In its 15 years of viewing the sky, NASA's Hubble Space Telescope has taken more than 700,000 exposures and probed more than 22,000 celestial targets as represented by the different colored dots in this map of the sky. All data from April 1990 through March 2005 are represented...
HubbleMinute: 15 Years of Science from Hubble Space Telescope
15th anniversary Hubble Minute on the top science discoveries of the Hubble Space Telescope. Images cover planets, comets, stars, galaxies and almost back to the beginning of time. The story leads up to Hubble's largest images ever revealed.
HubbleMinute: Amazing Space "Galileo to the Great Observatories: Telescopes from the Ground Up"
Amazing Space has launched a revolutionary new online program that covers the history, people and technology of telescopes from Galileo to the Great Observatories. The program is unique in its application of on-line tools to build skills for a knowledge base to understand the...
Share
Details
Claire Andreoli
NASA’s Goddard Space Flight Center
Greenbelt, Maryland
claire.andreoli@nasa.gov