


1 min read
Full Disk of Jupiter (8-Panel)
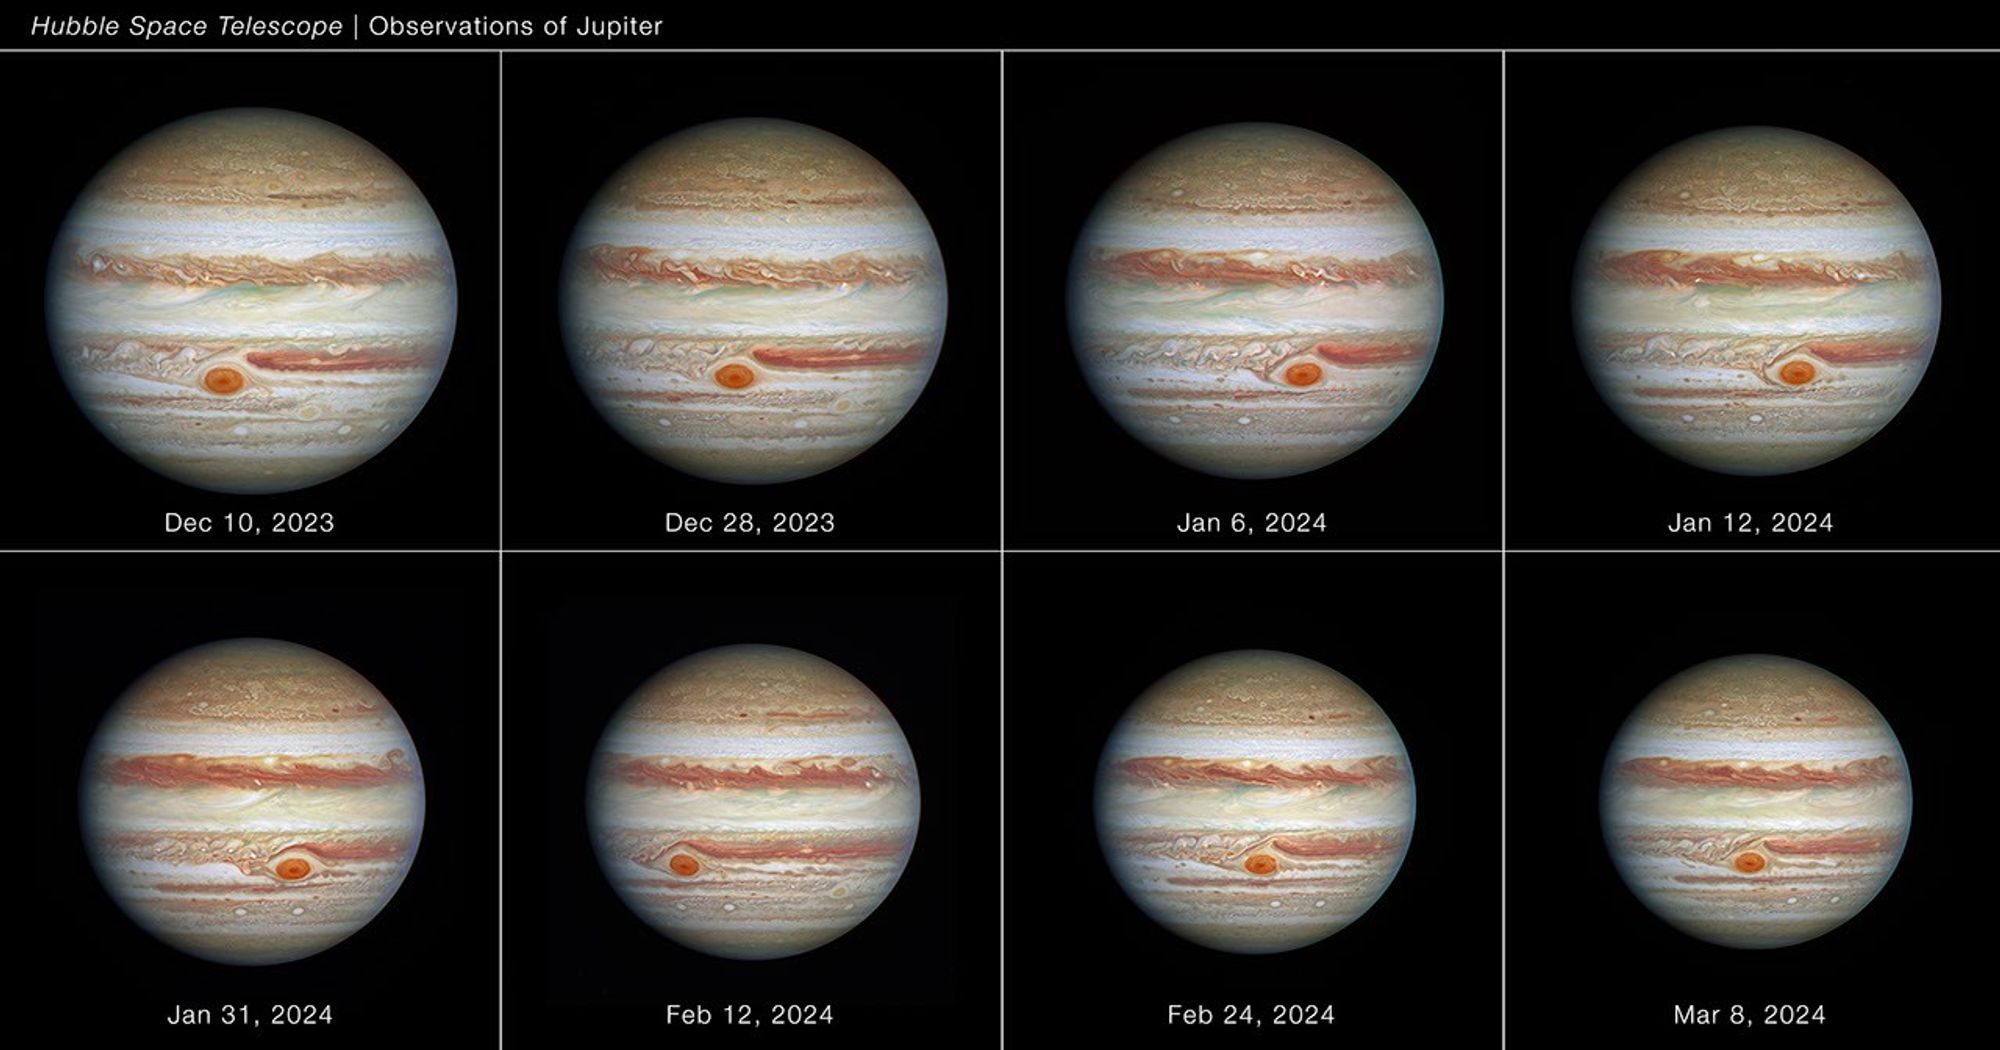
Using Hubble Space Telescope data spanning approximately 90 days (between December 2023 and March 2024) when the giant planet Jupiter ranged from 391 million to 512 million miles from Earth, astronomers measured the Great Red Spot's size, shape, brightness, color, and vorticity over a full oscillation cycle. The data reveal that the Great Red Spot is not as stable as it might look. It was observed going through an oscillation in its elliptical shape, jiggling like a bowl of gelatin. The cause of the 90-day oscillation is unknown. The observation is part of the observing programs led by Amy Simon of NASA's Goddard Space Flight Center in Greenbelt, Maryland.
Extended Description and Image Alt Text
Extended Description
Eight images of the giant planet Jupiter spanning approximately 90 days between December 2023 and March 2024. The planet appears striped, with brown and white horizontal bands of clouds. These stripes are called belts (sinking air) and bands (rising air). The polar regions appear more mottled. Astronomers measured the Great Red Spot (GRS) – a cherry red anticyclonic storm that appears at different longitudes in the southern hemisphere between exposures (because of Jupiter's rotation). Hubble was used to measure the size, shape, brightness, and twisting of the GRS. The observation is part of the observing programs led by Amy Simon of NASA's Goddard Space Flight Center.
Image Alt Text
Eight images of the giant planet Jupiter spanning approximately 90 days between December 2023 and March 2024. The planet appears striped, with brown and white horizontal bands of clouds. These stripes are called belts (sinking air) and bands (rising air). The polar regions appear more mottled. Astronomers measured the Great Red Spot (GRS) – a cherry red anticyclonic storm that appears at different longitudes in the southern hemisphere between exposures (because of Jupiter's rotation). Hubble was used to measure the size, shape, brightness, and twisting of the GRS. The observation is part of the observing programs led by Amy Simon of NASA's Goddard Space Flight Center.
About the Object
- DistanceDistanceThe physical distance from Earth to the astronomical object. Distances within our solar system are usually measured in Astronomical Units (AU). Distances between stars are usually measured in light-years. Interstellar distances can also be measured in parsecs.On December 10th 2023 Jupiter was 4.21 AU from Earth (about 391 million miles or 630 million km); On March 8th 2024 Jupiter was 5.52 AU from Earth (about 512 million miles or 825 million km).
About the Data
- Data DescriptionData DescriptionProposal: A description of the observations, their scientific justification, and the links to the data available in the science archive.
Science Team: The astronomers who planned the observations and analyzed the data. "PI" refers to the Principal Investigator. - InstrumentInstrumentThe science instrument used to produce the data.WFC3/UVIS
- Exposure DatesExposure DatesThe date(s) that the telescope made its observations and the total exposure time.December 10 and 28, 2023; January 6, 12, 31, February 12, 24, and March 8, 2024
- FiltersFiltersThe camera filters that were used in the science observations.F395N, F502N, F631N
- Object NameObject NameA name or catalog number that astronomers use to identify an astronomical object.Jupiter
- Object DescriptionObject DescriptionThe type of astronomical object.Planet
- Release DateOctober 9, 2024
- Science ReleaseNASA’s Hubble Watches Jupiter’s Great Red Spot Behave Like a Stress Ball
- CreditNASA, ESA, STScI, Amy Simon (NASA-GSFC); Image Processing: Joseph DePasquale (STScI)
These images are a composite of separate exposures acquired by the WFC3 instrument on the Hubble Space Telescope. Several filters were used to sample medium wavelength ranges. The color results from assigning different hues (colors) to each monochromatic (grayscale) image associated with an individual filter. In this case, the assigned colors are: Blue: F395N, Green: F502N, Red: F631N
Related Images & Videos
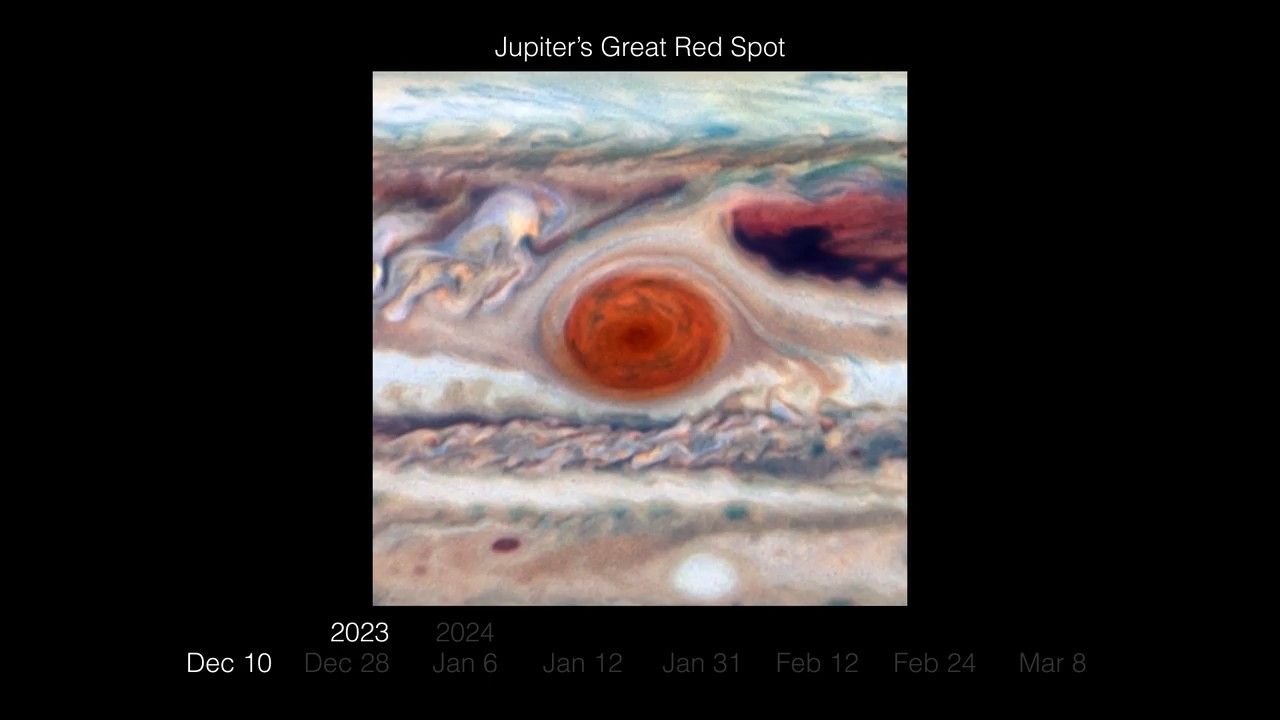
Close-up of Jupiter's Great Red Spot (8-Panel)
Using Hubble Space Telescope data spanning approximately 90 days (between December 2023 and March 2024) when the giant planet Jupiter ranged from 391 million to 512 million miles from Earth, astronomers measured the Great Red Spot's size, shape, brightness, color, and vorticity...
Jupiter Great Red Spot Movie
This time-lapse movie is assembled from Hubble Space Telescope observations spanning approximately 90 days (between December 2023 and March 2024) when the giant planet Jupiter ranged from 391 million to 512 million miles from Earth. Astronomers measured the Great Red Spot's...
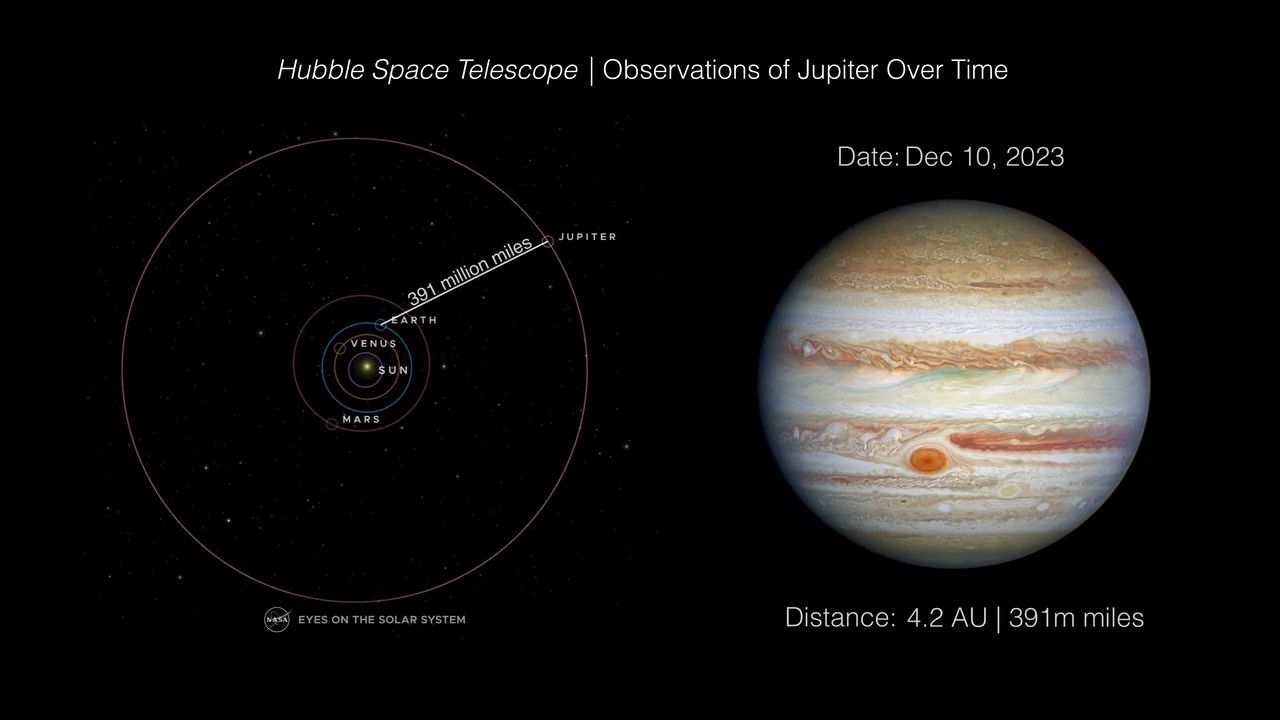
Observations of Jupiter Over Time
This animated diagram shows the position of Earth relative to Jupiter during a period spanning approximately 90 days (between December 2023 and March 2024) when the giant planet Jupiter ranged from 391 million to 512 million miles from Earth. During this period the Hubble Space...
Share
Details
Claire Andreoli
NASA’s Goddard Space Flight Center
Greenbelt, Maryland
claire.andreoli@nasa.gov
NASA, ESA, STScI, Amy Simon (NASA-GSFC)
Joseph DePasquale (STScI)