


1 min read
Hubble Census Tracks a Stellar “Baby Boom”
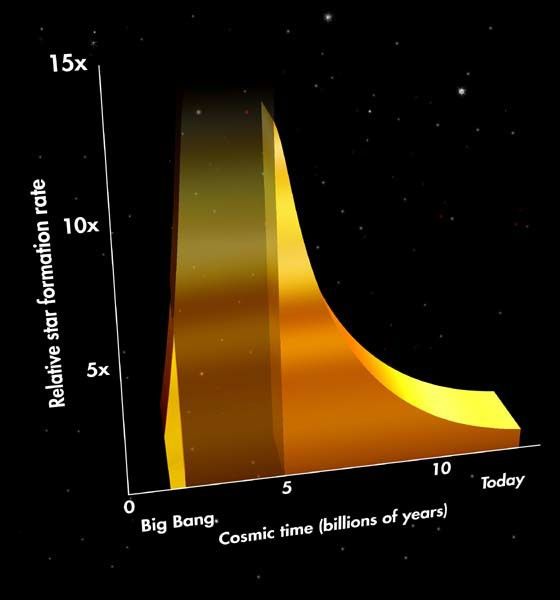
This graph traces the history of the rate of star formation over the past 12 billion years from shortly after the birth of the universe to the present.
The graph is based on observations of distant galaxies made by Hubble Space Telescope and ground-based observatories. Hubble shows a steep rise in star formation rate that happened shortly after the big bang. The ground-based data show the precipitous decline in star formation rate started from about 9 billion years ago to present. No observations exist yet to fill in the gap between these two data sets, where the slopes would joint to form a peak of starbirth activity. This will be an area of researche by Hubble in the future.
The vertical axis gives values for the mean rate of star formation as multiples of today's rate (unit value 1). Data suggest this rate may have been as high as 15 times today's value. The horizontal axis shows time in billions of years, from the big bang to present.
- Release DateDecember 17, 1996
- Science ReleaseHubble Census Tracks a Stellar “Baby Boom”
- Credit
Related Images & Videos
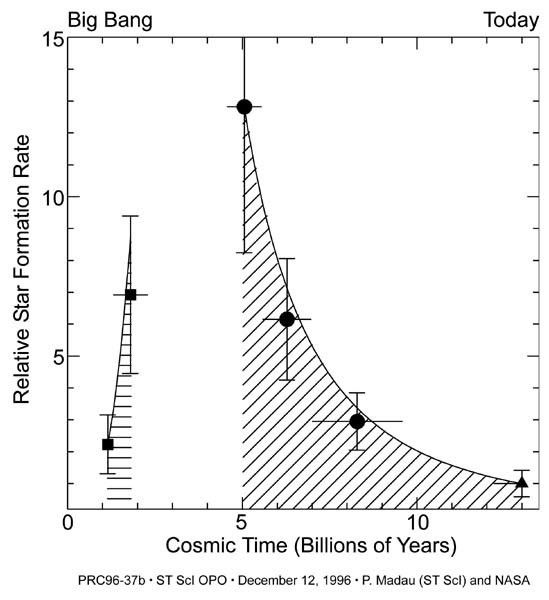
Second Graph Tracing the History of the Rate of Star Formation
This graph traces the history of the rate of star formation over the past 12 billion years from shortly after the birth of the universe to the present. The graph is based on observations of distant galaxies made by Hubble Space Telescope and ground-based observatories. Hubble...
Share
Details
Claire Andreoli
NASA’s Goddard Space Flight Center
Greenbelt, Maryland
claire.andreoli@nasa.gov