1 min read
Hubble Diagram for Cepheids
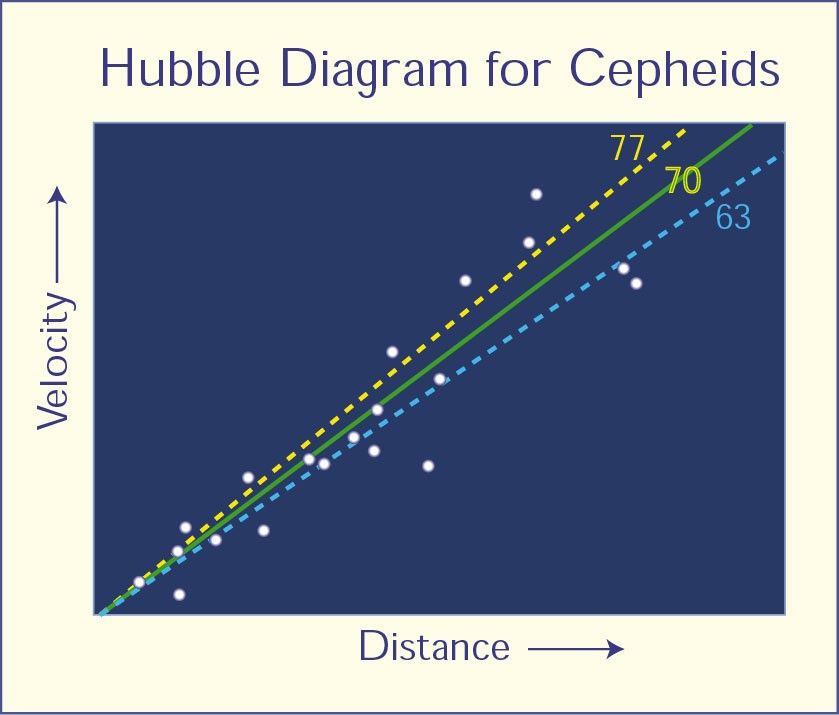
Hubble Diagram for Cepheids This is a plot of galaxy distance versus the velocity that the galaxy appears to be receding from Earth. It is based on data collected by the Hubble Space Telescope Key Project team. The distances have been measured using Cepheid variables. The slope in the plot measures the expansion rate of the universe, a quantity called the Hubble constant. The best fit to the data yields a Hubble constant of 70 kilometers/second/megaparsec. The dashed lines indicate Hubble constant values of 77 and 63 and do not fit the data as well. This plot is analogous to that obtained by Carnegie astronomer Edwin Hubble that led to his discovery of the expansion of the universe. With the Hubble Space Telescope, it is now possible to measure Cepheid distances over 30 times farther away than Hubble was able to do.
- Release DateMay 25, 1999
- Science ReleaseHubble Completes Eight-Year Effort to Measure Expanding Universe
- Credit
Related Images & Videos

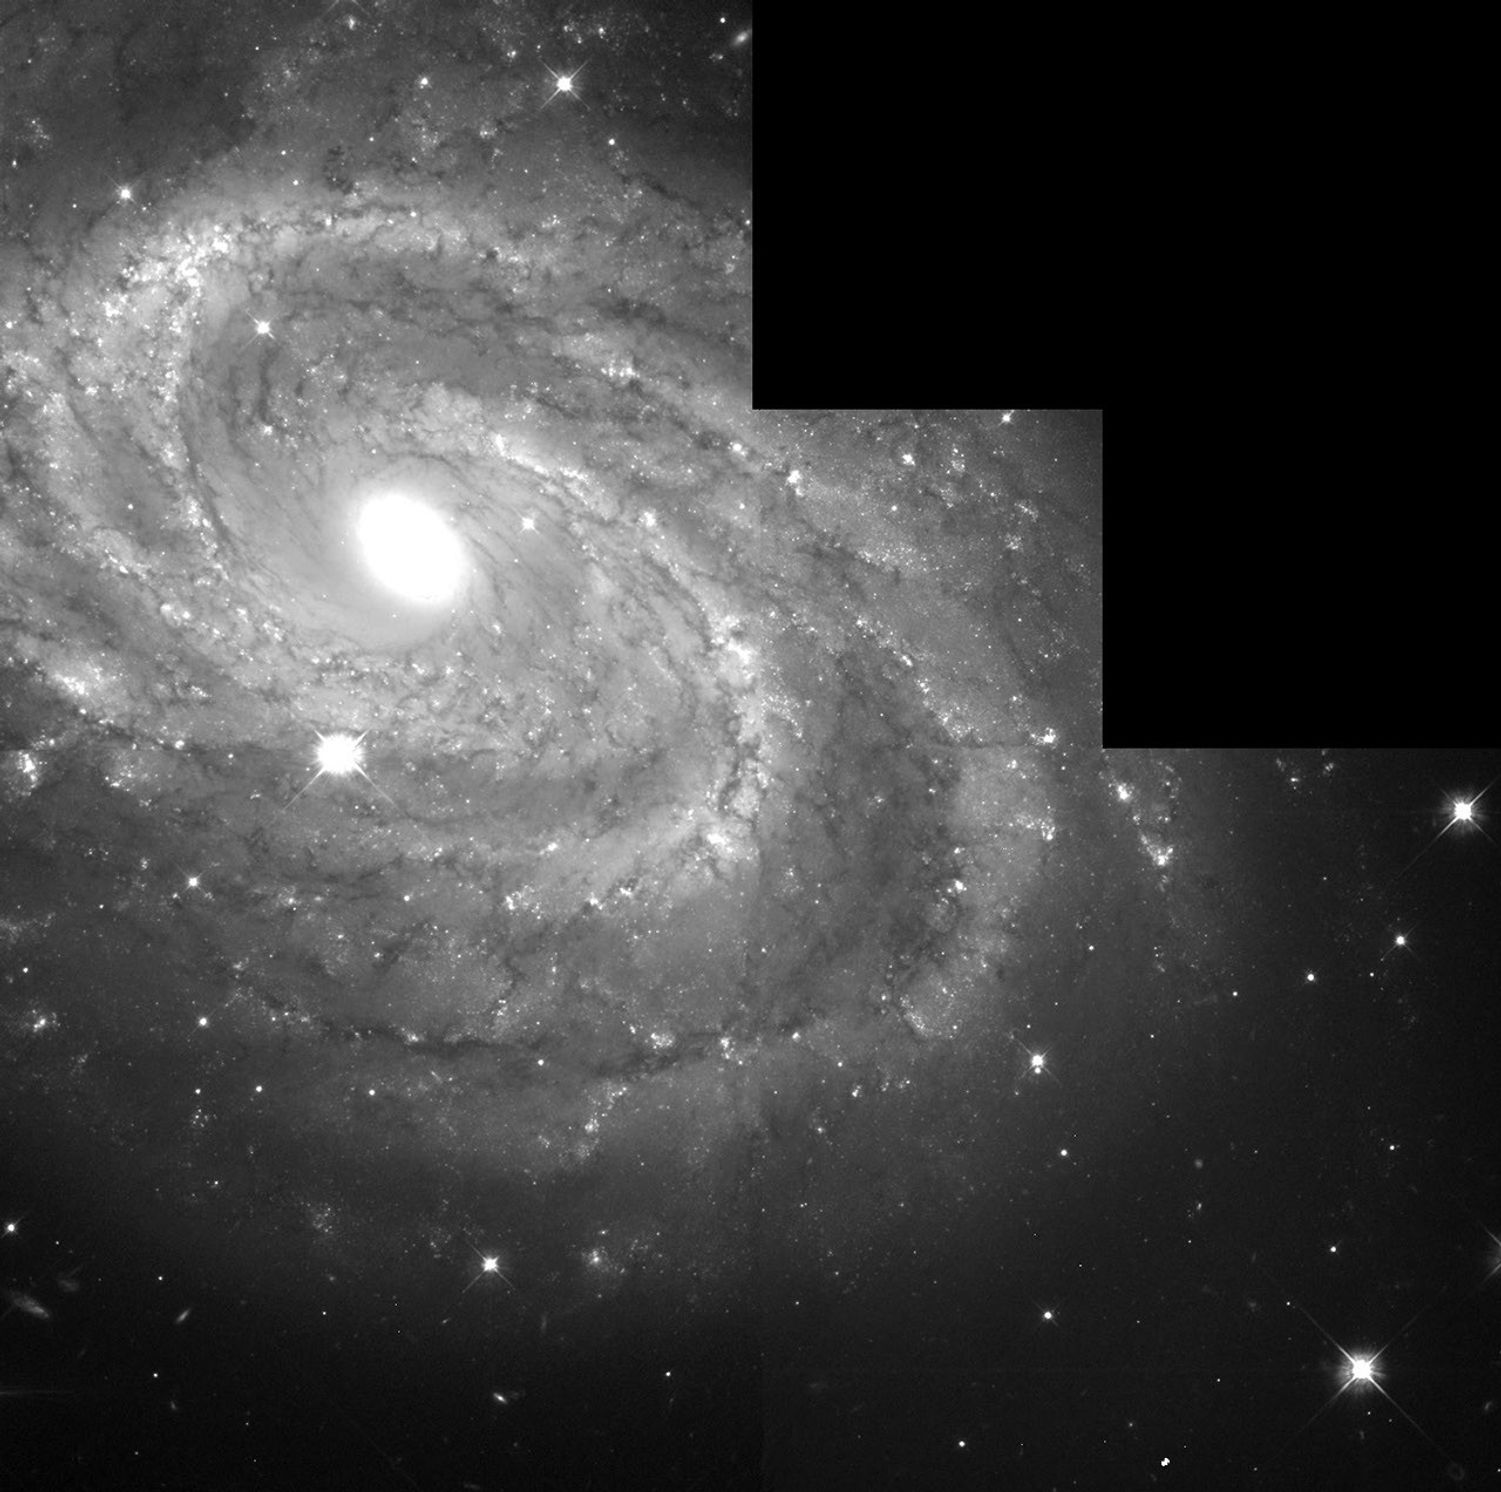
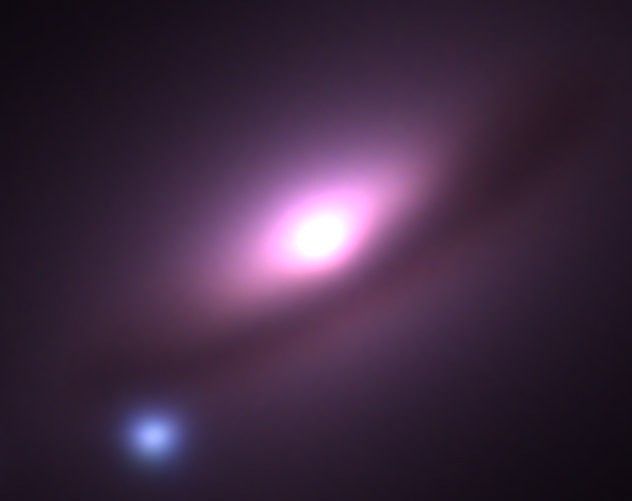
Distant Spiral Galaxy NGC 4603, Home to Variable Stars
A NASA Hubble Space Telescope (HST) view of the magnificent spiral galaxy NGC 4603, the most distant galaxy in which a special class of pulsating stars called Cepheid variables have been found. It is associated with the Centaurus cluster, one of the most massive assemblages of...
Share
Details
Last Updated
Aug 17, 2025
Contact
Media
Claire Andreoli
NASA’s Goddard Space Flight Center
Greenbelt, Maryland
claire.andreoli@nasa.gov


