1 min read
Lensed Supernova in Abell 370 Compass Image
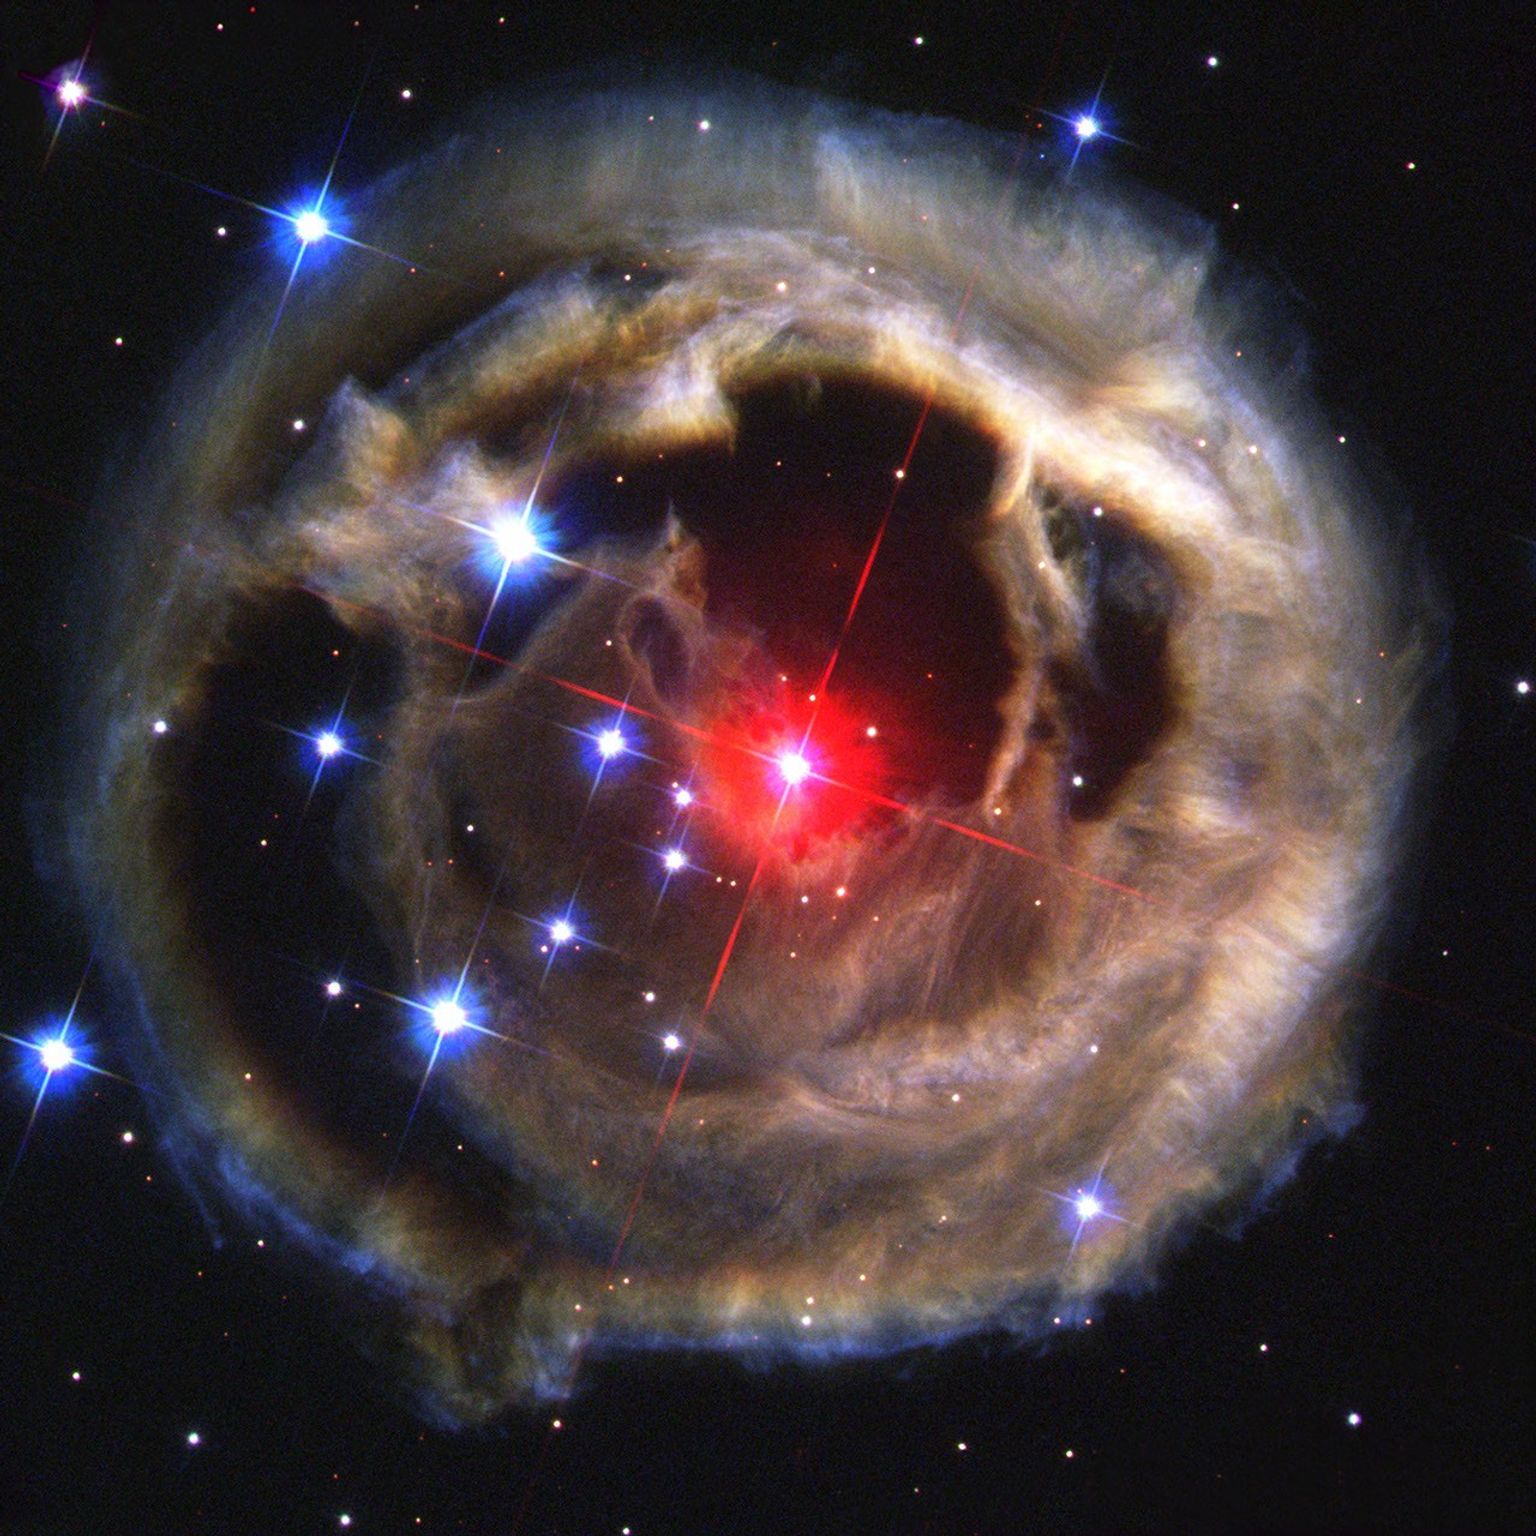
The compass graphic points to the object’s orientation on the celestial sphere. North points to the north celestial pole which currently lies near the star, Polaris, in the circumpolar constellation Ursa Minor. The object is observed at visible light wavelengths, the colors corresponding to the true emission of light from stars, galaxies and ionized gases.
About the Object
- R.A. PositionR.A. PositionRight ascension – analogous to longitude – is one component of an object's position.02:39:55.29
- Dec. PositionDec. PositionDeclination – analogous to latitude – is one component of an object's position.-01:33:51.50
- ConstellationConstellationOne of 88 recognized regions of the celestial sphere in which the object appears.Cetus
- DistanceDistanceThe physical distance from Earth to the astronomical object. Distances within our solar system are usually measured in Astronomical Units (AU). Distances between stars are usually measured in light-years. Interstellar distances can also be measured in parsecs.4 billion light-years
About the Data
- Data DescriptionData DescriptionProposal: A description of the observations, their scientific justification, and the links to the data available in the science archive.
Science Team: The astronomers who planned the observations and analyzed the data. "PI" refers to the Principal Investigator.These data are from the HST proposals 11108 (PI: E. Hu, University of Hawaii), 11507 (PI: K. Noll, GSFC), 11591 (PI: J.-P. Kneib, Laboratoire d'Astrophysique de Marseille), 13459 (PI: T. Treu, UCLA), 13790 (PI: S. Rodney, JHU), 14038 (PI: J. Lotz, STScI), and 14216 (R. Kirshner, Harvard University).
- InstrumentInstrumentThe science instrument used to produce the data.HST>ACS/WFC and HST>WFC3/IR
- Exposure DatesExposure DatesThe date(s) that the telescope made its observations and the total exposure time.September 2009 - February 2015
- FiltersFiltersThe camera filters that were used in the science observations.ACS/WFC: F435W, F606W, and F814W; WFC3/IR: F105W, F125W, F140W, and F160W
- Object NameObject NameA name or catalog number that astronomers use to identify an astronomical object.Abell 370
- Object DescriptionObject DescriptionThe type of astronomical object.Galaxy Cluster and Gratationally Lensed Supernova
- Release DateNovember 9, 2022
- Science ReleaseHubble Captures 3 Faces of Evolving Supernova in Early Universe
- CreditNASA, ESA, STScI, Wenlei Chen (UMN), Patrick Kelly (UMN)
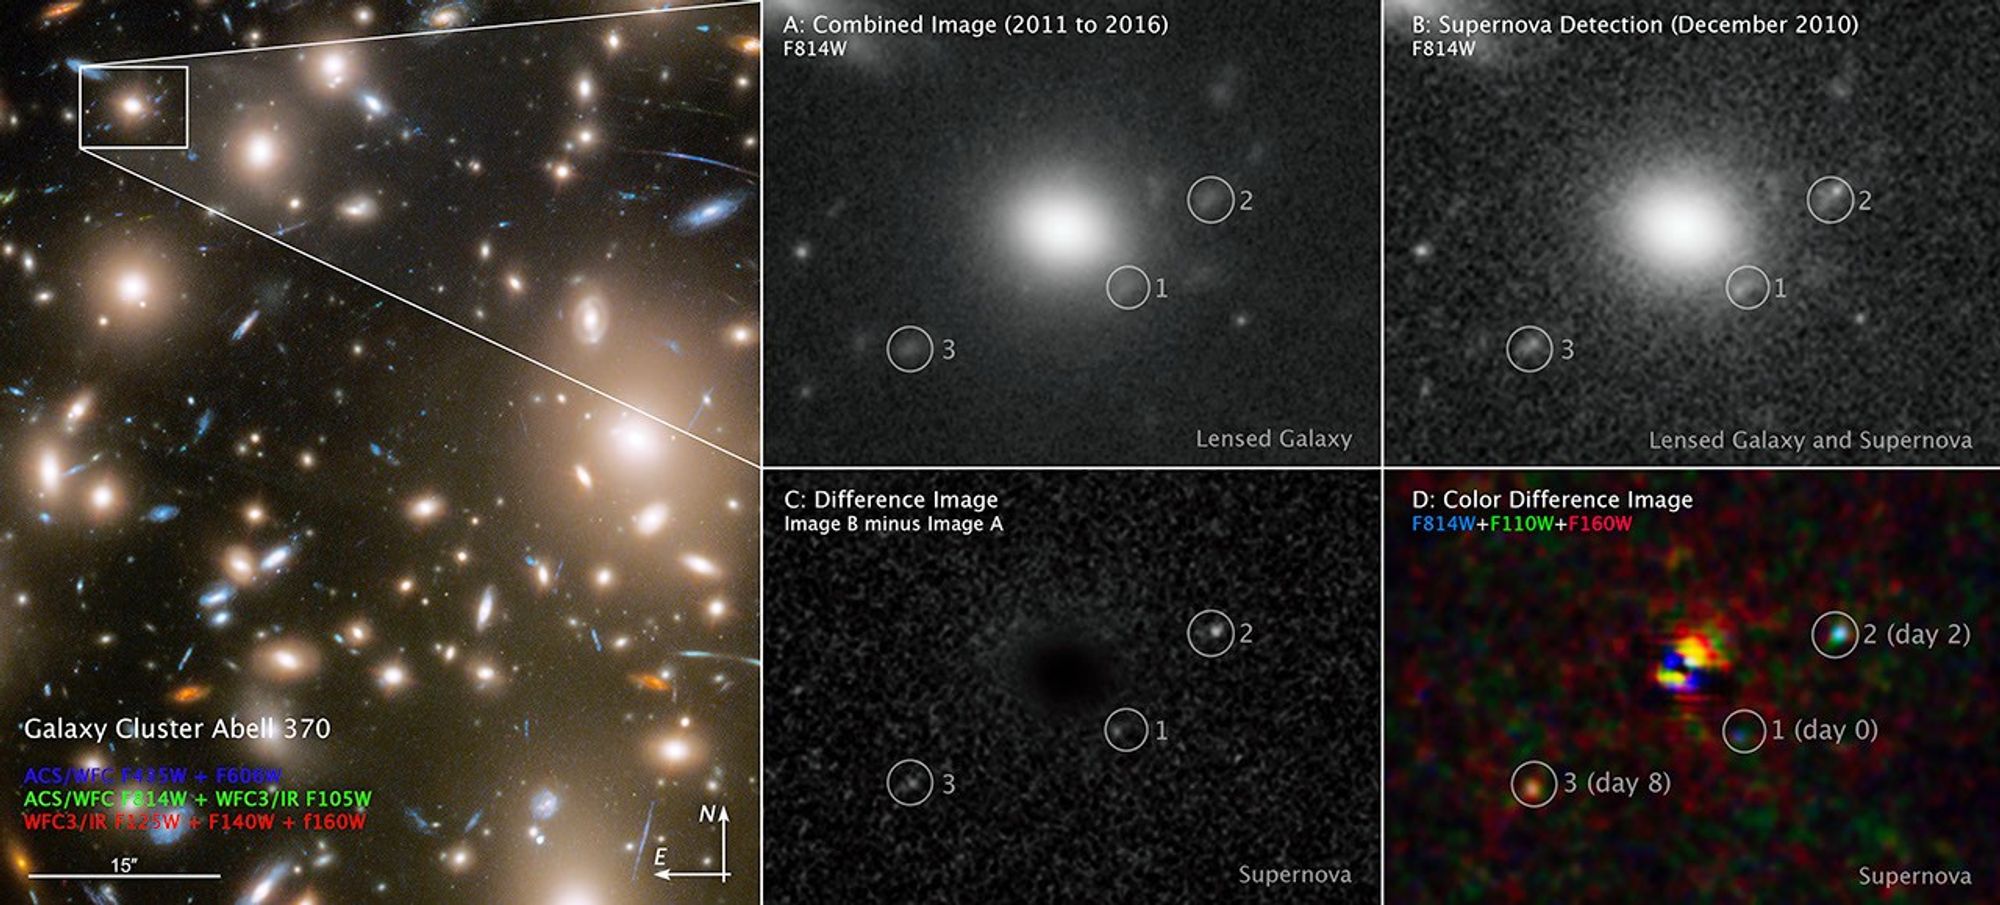
Blue: F435W + F606W Green: F814W + F105W Red: F125W + F140W + F160W
Related Images & Videos
Lensed Supernova in Abell 370
Through a phenomenon called gravitational lensing, three different moments in a far-off supernova explosion were captured in a single snapshot by NASA's Hubble Space Telescope. The light from the supernova, which was located behind the galaxy cluster Abell 370, was multiply...
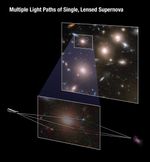
Multiple Light Paths of Single, Lensed Supernova
Through the phenomenon of gravitational lensing, NASA's Hubble Space Telescope captured three different moments in the explosion of a very far-off supernova—all in one picture! In this case, the immense gravity of the galaxy cluster Abell 370 acted as a cosmic lens, bending and...
Share
Details
Claire Andreoli
NASA’s Goddard Space Flight Center
Greenbelt, Maryland
claire.andreoli@nasa.gov