


1 min read
Neptune Cloud Cover and Solar Cycle Over Three Decades
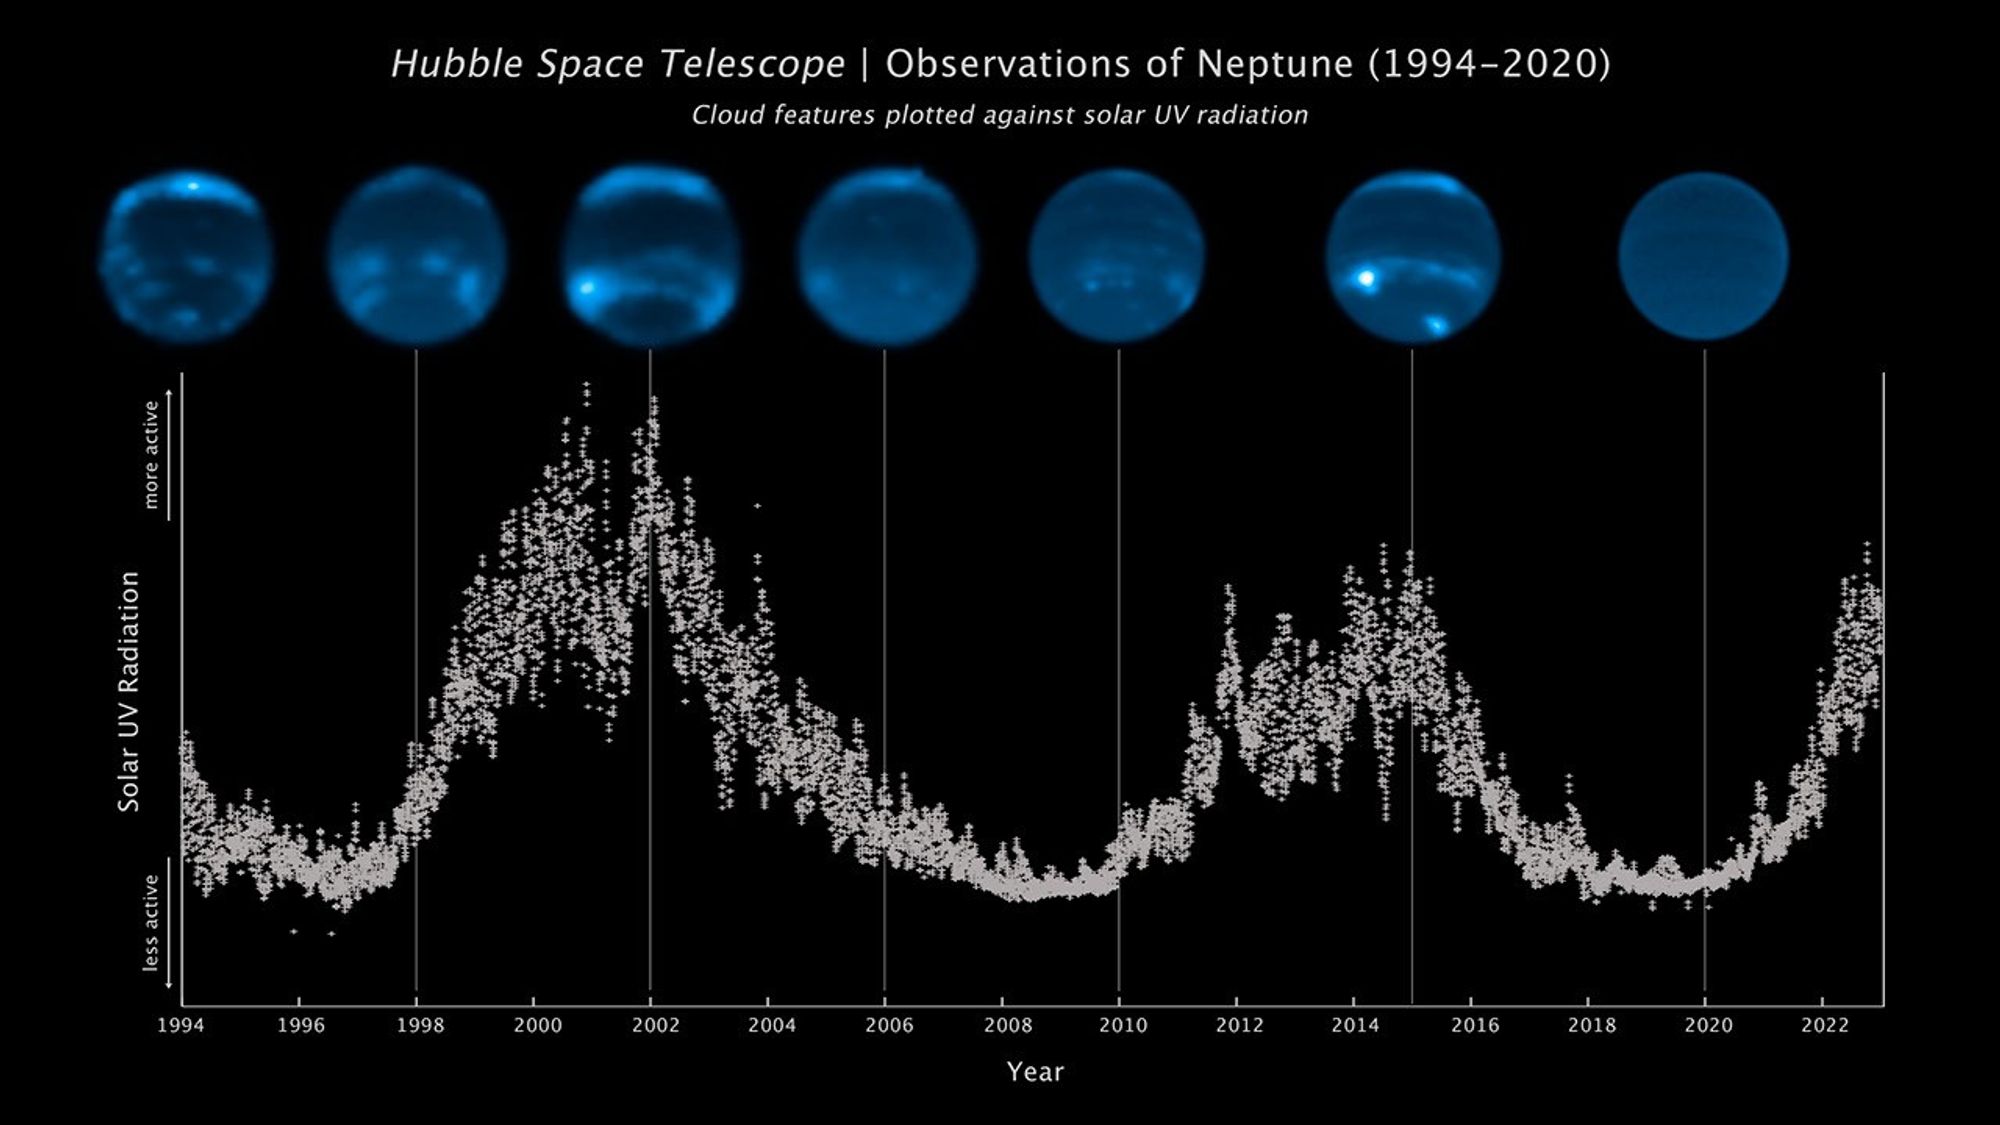
This sequence of Hubble Space Telescope images chronicles the waxing and waning of the amount of cloud cover on Neptune. This nearly-30-year-long set of observations shows that the number of clouds grows increasingly following a peak in the solar cycle – where the Sun's level of activity rhythmically rises and falls over an 11-year period.
The Sun's level of ultraviolet radiation is plotted in the vertical axis. The 11-year cycle is plotted along the bottom from 1994 to 2022. The Hubble observations along the top, clearly show a correlation between cloud abundance and solar peak of activity.
The chemical changes are caused by photochemistry, which happens high in Neptune's upper atmosphere and takes time to form clouds.
About the Object
- DistanceDistanceThe physical distance from Earth to the astronomical object. Distances within our solar system are usually measured in Astronomical Units (AU). Distances between stars are usually measured in light-years. Interstellar distances can also be measured in parsecs.The semi-major axis of Neptune's orbit about the Sun is 30.06 astronomical units (roughly 2.8 billion miles or 4.5 billion kilometers).
- DimensionsDimensionsThe physical size of the object or the apparent angle it subtends on the sky.Neptune has a diameter of roughly 30,800 miles (49,600 kilometers) at the equator.
About the Data
- Data DescriptionData DescriptionProposal: A description of the observations, their scientific justification, and the links to the data available in the science archive.
Science Team: The astronomers who planned the observations and analyzed the data. "PI" refers to the Principal Investigator.The HST observations include those from several programs throughout three decades of observations including: 5221, 5329, 5831, 6219, 6650, 7324, 8634, 9393, 10170, 10534, 11156, 11630, 12675, 13937, 14044, 14334, 14756, 15262, 15502, 16057, 16084, 16454
- InstrumentInstrumentThe science instrument used to produce the data.WFPC2 and WFC3
- Exposure DatesExposure DatesThe date(s) that the telescope made its observations and the total exposure time.Several observations spanning a time frame from 1994 to 2022
- FiltersFiltersThe camera filters that were used in the science observations.F845M, F850LP, F953N, CH4p15
- Object NameObject NameA name or catalog number that astronomers use to identify an astronomical object.Neptune
- Object DescriptionObject DescriptionThe type of astronomical object.Planet
- Release DateAugust 17, 2023
- Science ReleaseNeptune’s Disappearing Clouds Linked to the Solar Cycle
- CreditNASA, ESA, Erandi Chavez (UC Berkeley), Imke de Pater (UC Berkeley)
These images were acquired by the WFPC2 and WFC3 instruments on the Hubble Space Telescope. The color results from assigning a blue hue to a monochromatic (grayscale) image.
Related Images & Videos
Neptune Cloud Cover Over Three Decades
This sequence of Hubble Space Telescope images chronicles the waxing and waning of the amount of cloud cover on Neptune. This long set of observations shows that the number of clouds grows increasingly following a peak in the solar cycle – where the Sun's level of activity...
Share
Details
Claire Andreoli
NASA’s Goddard Space Flight Center
Greenbelt, Maryland
claire.andreoli@nasa.gov
NASA, ESA, LASP, Erandi Chavez (UC Berkeley), Imke de Pater (UC Berkeley)
Joseph DePasquale (STScI)