


1 min read
New Red Spot Appears on Jupiter
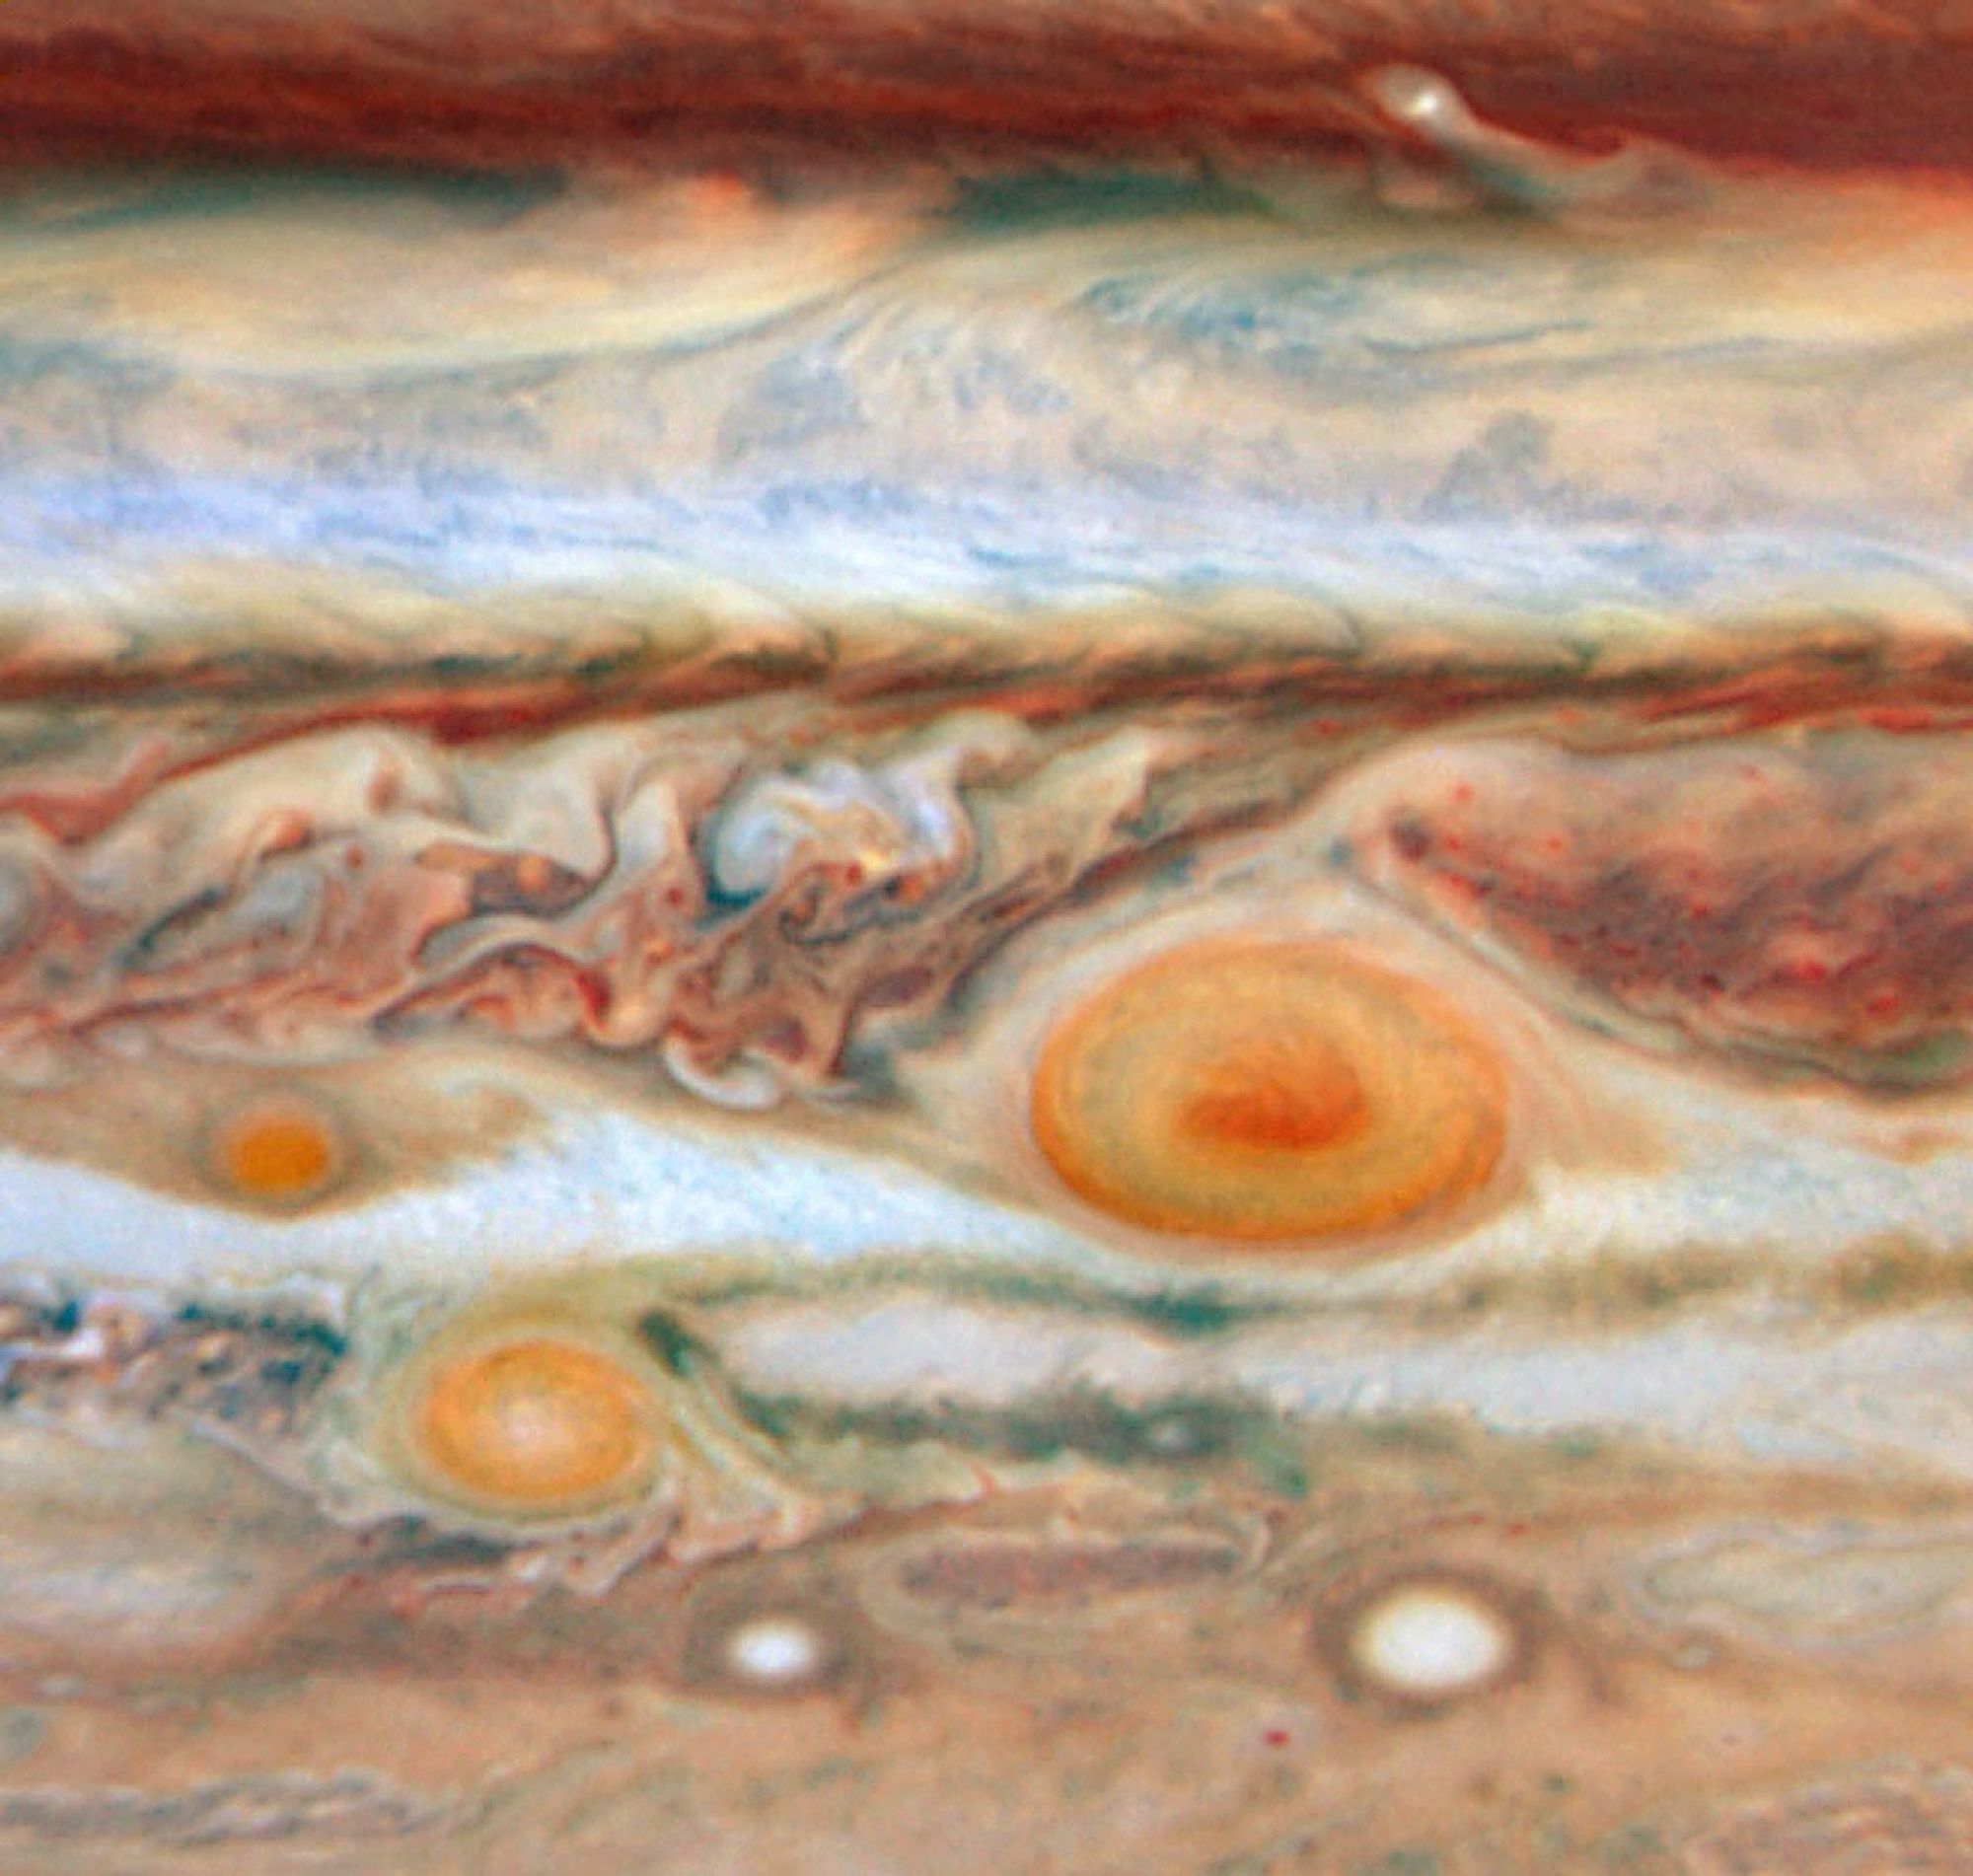
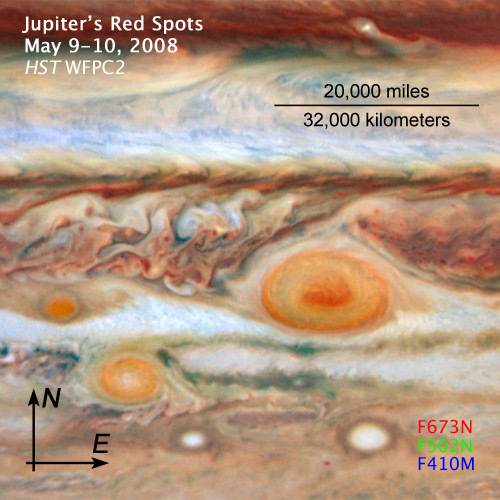
In what's beginning to look like a case of planetary measles, a third red spot has appeared alongside its cousins – the Great Red Spot and Red Spot Jr. – in the turbulent Jovian atmosphere.
This third red spot, which is a fraction of the size of the two other features, lies to the west of the Great Red Spot in the same latitude band of clouds.
The new red spot was previously a white oval-shaped storm. The change to a red color indicates its swirling storm clouds are rising to heights like the clouds of the Great Red Spot. One possible explanation is that the red storm is so powerful it dredges material from deep beneath Jupiter's cloud tops and lifts it to higher altitudes where solar ultraviolet radiation – via some unknown chemical reaction – produces the familiar brick color.
Detailed analysis of the visible-light images taken by Hubble's Wide Field Planetary Camera 2 on May 9 and 10, and near-infrared adaptive optics images taken by the W.M. Keck telescope on May 11, is revealing the relative altitudes of the cloud tops of the three red ovals. Because all three oval storms are bright in near-infrared light, they must be towering above the methane in Jupiter's atmosphere, which absorbs the Sun's infrared light and so looks dark in infrared images.
Turbulence and storms first observed on Jupiter more than two years ago are still raging, as revealed in the latest pictures. The Hubble and Keck images also reveal the change from a rather bland, quiescent band surrounding the Great Red Spot just over a year ago to one of incredible turbulence on both sides of the spot.
Red Spot Jr. appeared in spring of 2006. The Great Red Spot has persisted for as long as 200 to 350 years, based on early telescopic observations. If the new red spot and the Great Red Spot continue on their courses, they will encounter each other in August, and the small oval will either be absorbed or repelled from the Great Red Spot. Red Spot Jr. which lies between the two other spots, and is at a lower latitude, will pass the Great Red Spot in June.
The Hubble and Keck images may support the idea that Jupiter is in the midst of global climate change, as first proposed in 2004 by Phil Marcus, a professor of mechanical engineering at the University of California, Berkeley. The planet's temperatures may be changing by 15 to 20 degrees Fahrenheit. The giant planet is getting warmer near the equator and cooler near the South Pole. He predicted that large changes would start in the southern hemisphere around 2006, causing the jet streams to become unstable and spawn new vortices.
The Hubble team members are Imke de Pater, Phil Marcus, Mike Wong and Xylar Asay-Davis of the University of California, Berkeley, and Christopher Go of the Philippines. The Keck team members were de Pater, Wong, and Conor Laver of the University of California, Berkeley, and Al Conrad of the Keck Observatory. More information about the Keck observations is available in The University of California, Berkeley press release (http://www.berkeley.edu/news/media/releases/2008/05/22_redspots.shtml). The contributions by the amateur network (http://jupos.privat.t-online.de/) are invaluable for this research.
About the Object
- DistanceDistanceThe physical distance from Earth to the astronomical object. Distances within our solar system are usually measured in Astronomical Units (AU). Distances between stars are usually measured in light-years. Interstellar distances can also be measured in parsecs.The semi-major axis of Jupiter's orbit about the sun is 5.2 Astronomical Units (483 million miles or 778 million km).
- DimensionsDimensionsThe physical size of the object or the apparent angle it subtends on the sky.The planet has a diameter of roughly 88,789 miles (142,984 km) at the equator.
About the Data
- Data DescriptionData DescriptionProposal: A description of the observations, their scientific justification, and the links to the data available in the science archive.
Science Team: The astronomers who planned the observations and analyzed the data. "PI" refers to the Principal Investigator.HST Proposal: 11102: I. de Pater, P. Marcus, M. Wong, and X. Asay-Davis (University of California, Berkeley), and C. Go (University of San Carlos, Philippines). - InstrumentInstrumentThe science instrument used to produce the data.HST>WFPC2
- Exposure DatesExposure DatesThe date(s) that the telescope made its observations and the total exposure time.May 9-10, 2008
- FiltersFiltersThe camera filters that were used in the science observations.410 nm, 502 nm, and 673 nm
- Object NameObject NameA name or catalog number that astronomers use to identify an astronomical object.Jupiter
- Object DescriptionObject DescriptionThe type of astronomical object.Planet
- Release DateMay 22, 2008
- Science ReleaseNew Red Spot Appears on Jupiter
- CreditM. Wong and I. de Pater (University of California, Berkeley)
These images are a composite of separate exposures made by the WFPC2 instrument on the Hubble Space Telescope. Three filters were used to sample various wavelength ranges. The color results from assigning different hues (colors) to each monochromatic image. In this case, the assigned colors are: Blue: F410 M Green: F502 N Red: F673 N
Related Images & Videos
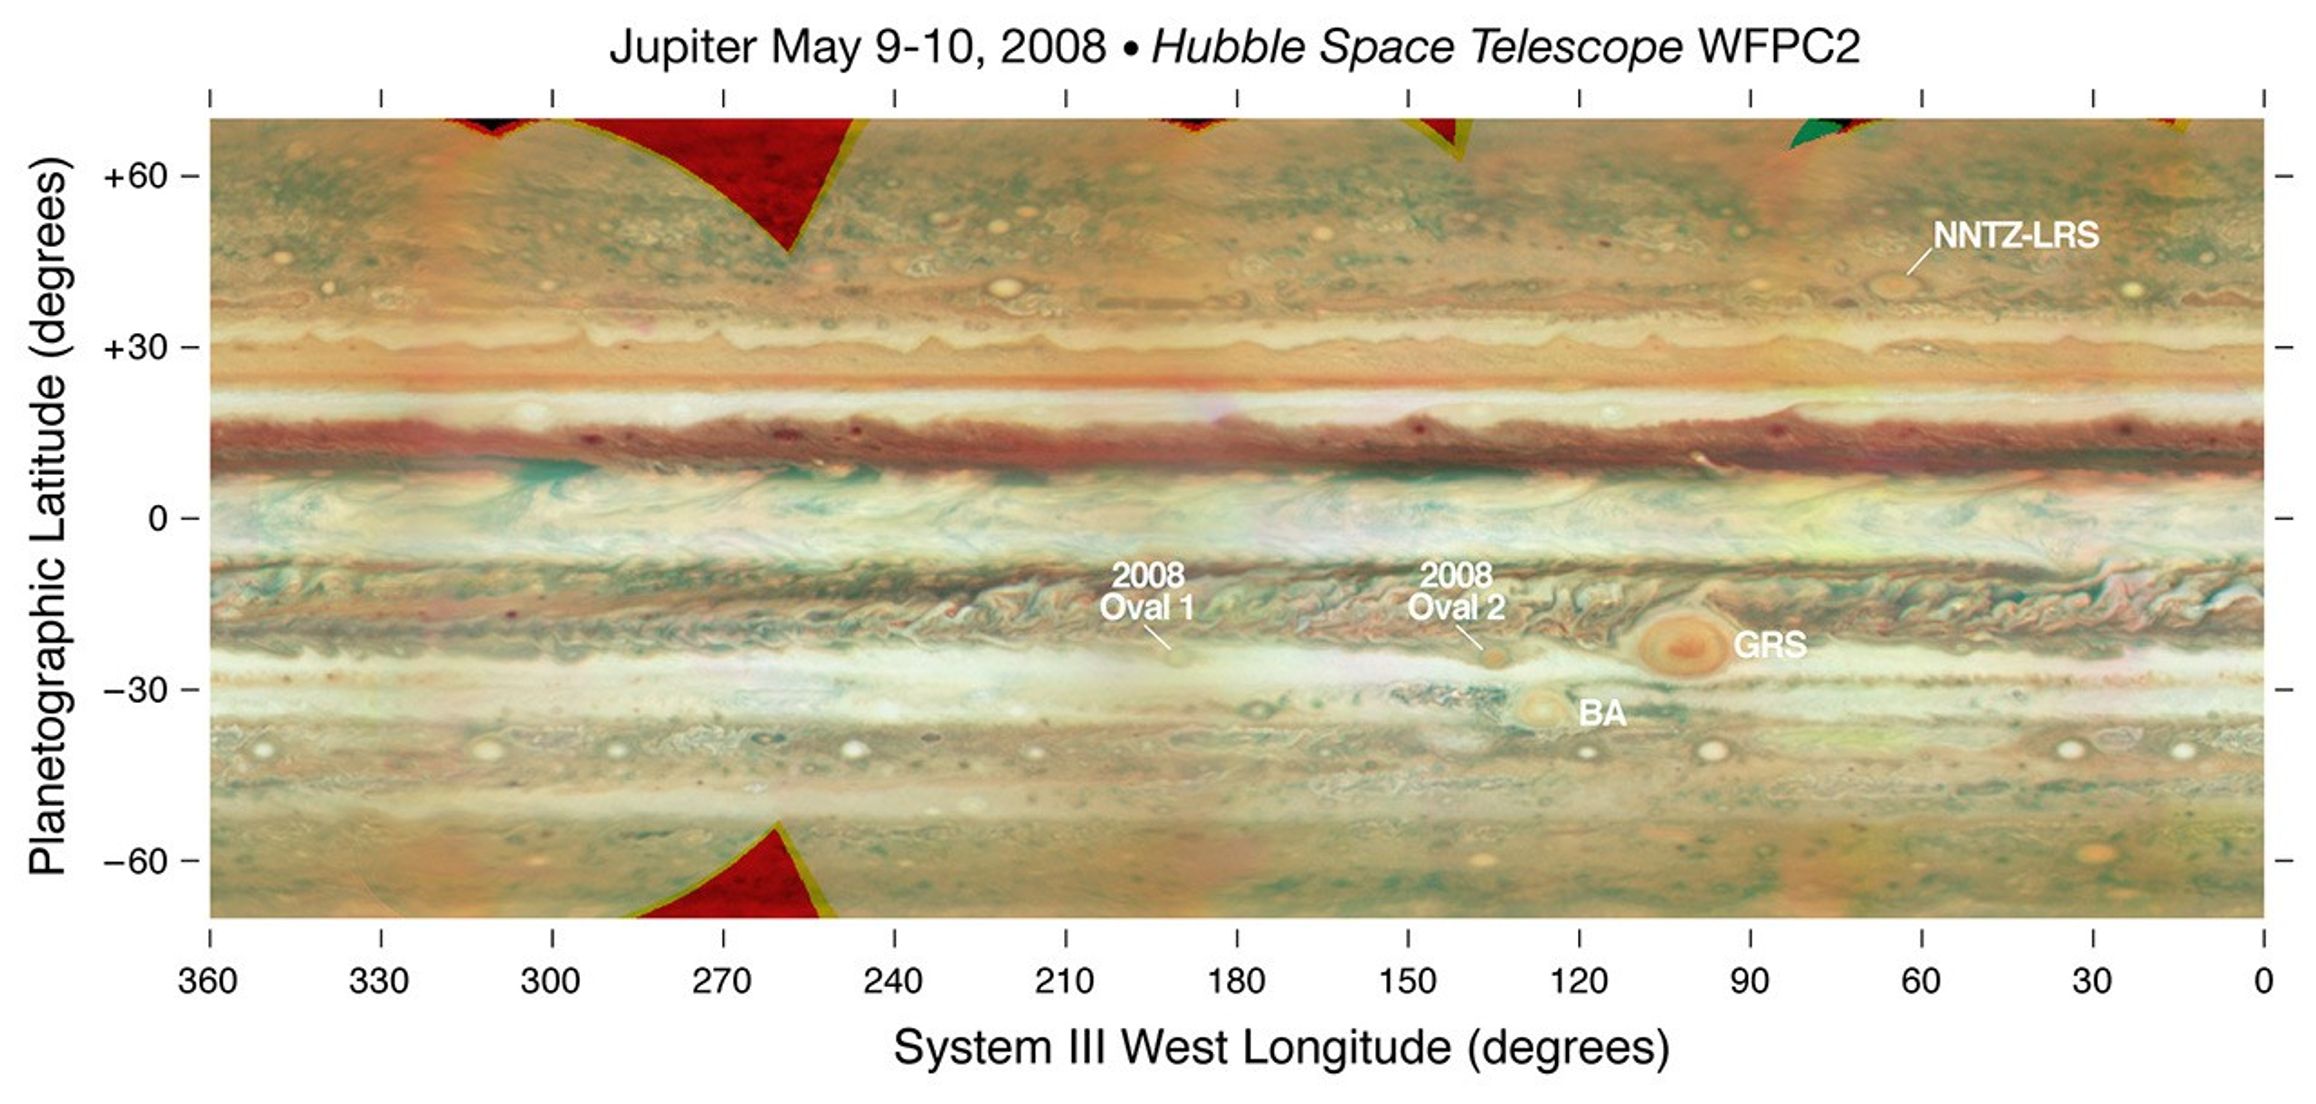
Jupiter Map – Annotated
False color cylindrical map of Jupiter, constructed from a set of images of the planet obtained with the WFPC2 on the Hubble Space Telescope. Individual frames were obtained on May 9 and May 10, 2008. The images were deprojected and mosaiced together. The map shows latitudes...

Share
Details
Claire Andreoli
NASA’s Goddard Space Flight Center
Greenbelt, Maryland
claire.andreoli@nasa.gov