


1 min read
Winds in Jupiter’s Great Red Spot
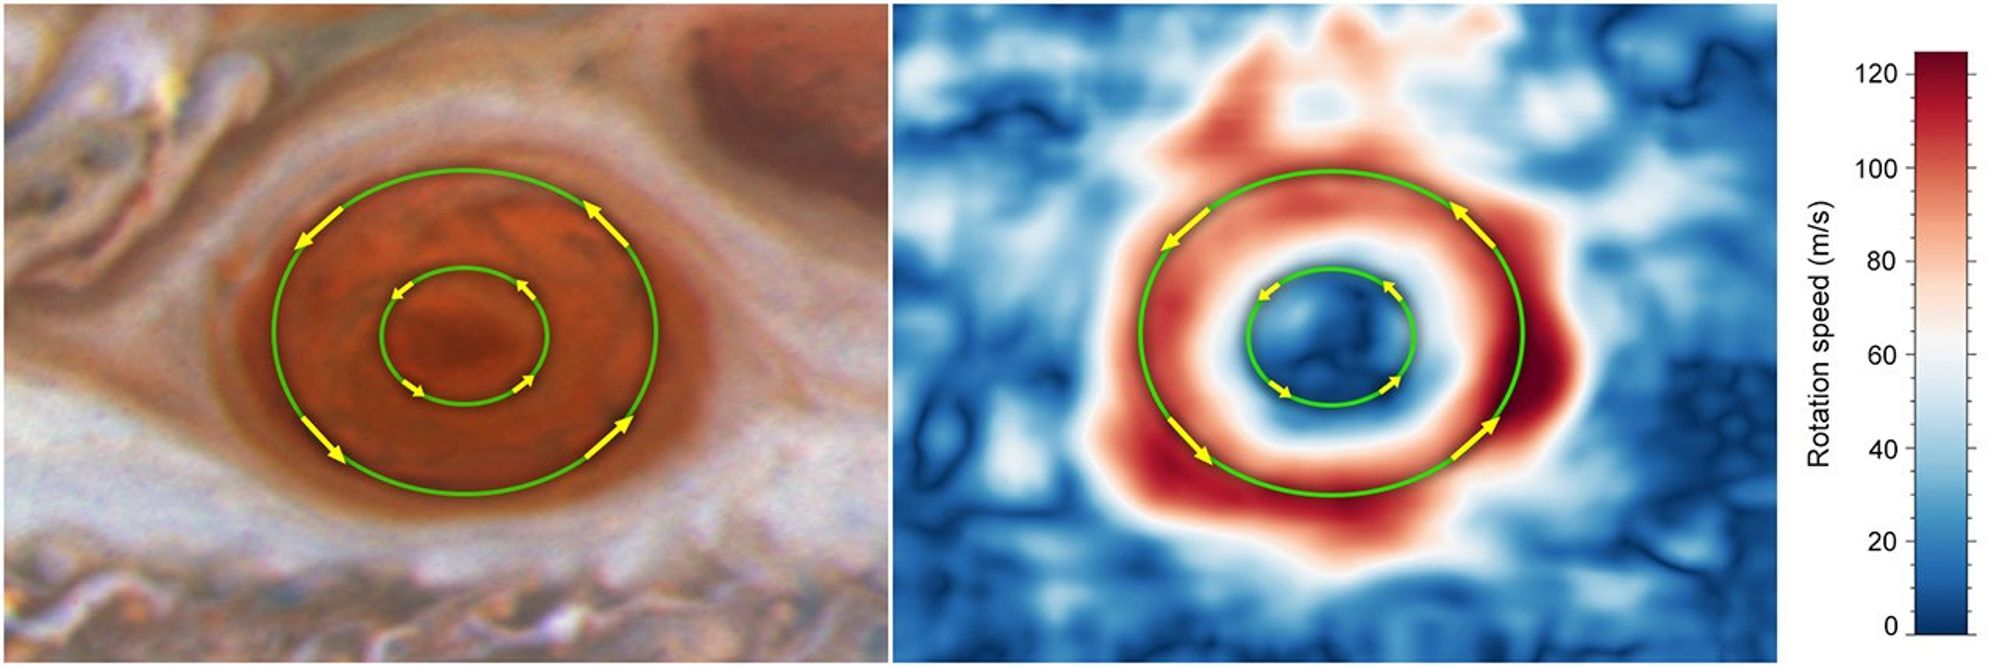
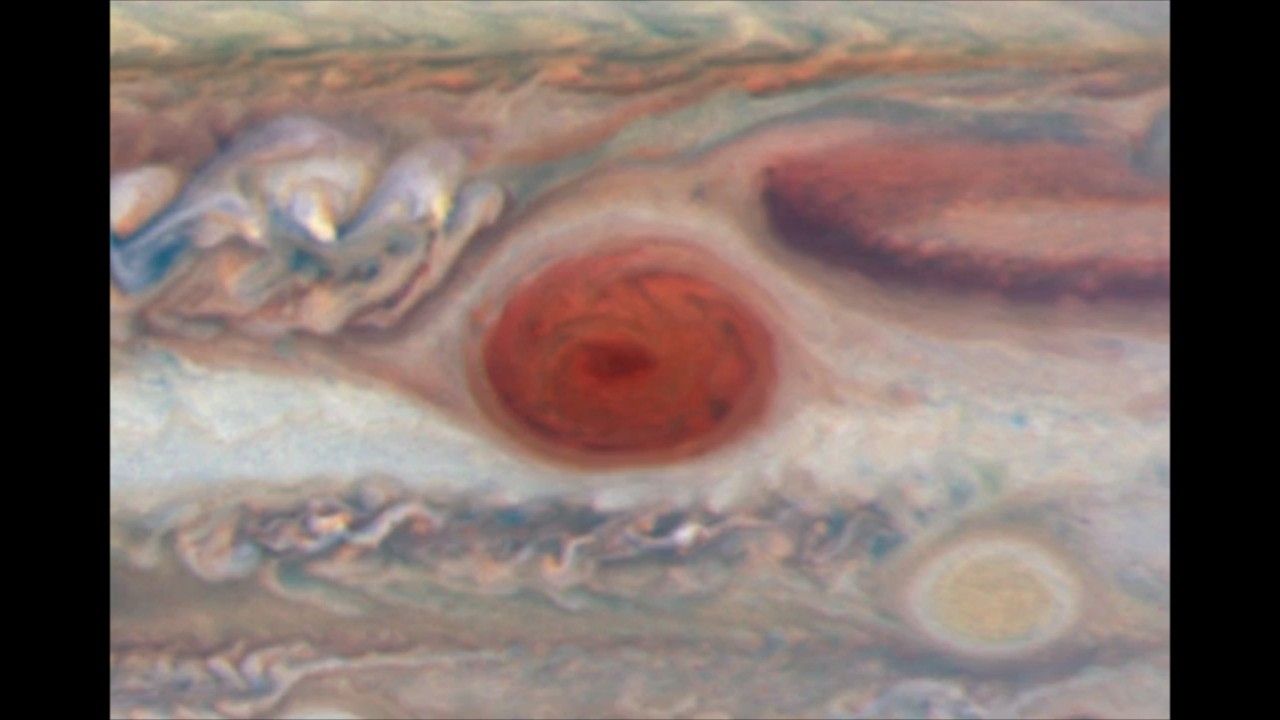
By analyzing images taken by NASA's Hubble Space Telescope from 2009 to 2020, researchers found that the average wind speed just within the boundaries of the Great Red Spot, set off by the outer green circle, have increased by up to 8 percent from 2009 to 2020 and exceed 400 miles per hour. In contrast, the winds near the storm's innermost region, set off by a smaller green ring, are moving significantly more slowly. Both move counterclockwise.
About the Object
- DistanceDistanceThe physical distance from Earth to the astronomical object. Distances within our solar system are usually measured in Astronomical Units (AU). Distances between stars are usually measured in light-years. Interstellar distances can also be measured in parsecs.At the time of observation, Jupiter was 4.36 AU (405 million miles or 652 million kilometers) from Earth.
About the Data
- Data DescriptionData DescriptionProposal: A description of the observations, their scientific justification, and the links to the data available in the science archive.
Science Team: The astronomers who planned the observations and analyzed the data. "PI" refers to the Principal Investigator.The left image was created from Hubble data from proposal 15929 (A. Simon)
- Exposure DatesExposure DatesThe date(s) that the telescope made its observations and the total exposure time.20 Sept. 2020
- FiltersFiltersThe camera filters that were used in the science observations.F395N, F502N, F631N
- Object NameObject NameA name or catalog number that astronomers use to identify an astronomical object.Jupiter
- Object DescriptionObject DescriptionThe type of astronomical object.Jovian planet
- Release DateSeptember 27, 2021
- Science ReleaseHubble Shows Winds in Jupiter’s Great Red Spot Are Speeding Up
- CreditNASA, ESA, Michael Wong (UC Berkeley)
The image on the left is a composite of separate exposures acquired by the WFC3 instrument on the Hubble Space Telescope. Several filters were used to sample narrow wavelength ranges. The color results from assigning different hues (colors) to each monochromatic (grayscale) image associated with an individual filter. In this case, the assigned colors are: Blue: F395N (395 nm); Green: F502N (502 nm); and Red: F631N (631 nm).
Related Images & Videos
Moving Winds in Jupiter’s Great Red Spot
Each loop in this video represents approximately 10 Earth hours or one Jupiter day, approximating what it would look like if the Great Red Spot were constantly illuminated. By analyzing this set of data from NASA’s Hubble Space Telescope, researchers were able to simulate what...
Share
Details
Claire Andreoli
NASA’s Goddard Space Flight Center
Greenbelt, Maryland
claire.andreoli@nasa.gov