


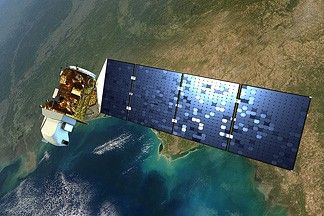
Landsat 2
Landsat 2 built on the Earth observation capabilities established by Landsat 1. With two satellites operating simultaneously, data users could monitor the same location on Earth twice as often. It played a vital role in agricultural monitoring by supporting major programs like the Large Area Crop Inventory Experiment (LACIE) and expanded international collaboration through a growing network of global ground stations.
Mission objective
Partners
Launched
decommissioned
| Quick Facts | |
|---|---|
| Sensors: RBV, MSS | Spatial Resolution: 80 m |
| Spectral Resolution: 4 bands | Temporal Resolution: 18 days |
| Radiometric Resolution: 6-bit, processed to 8-bit | Image Data: 122 scenes/day |
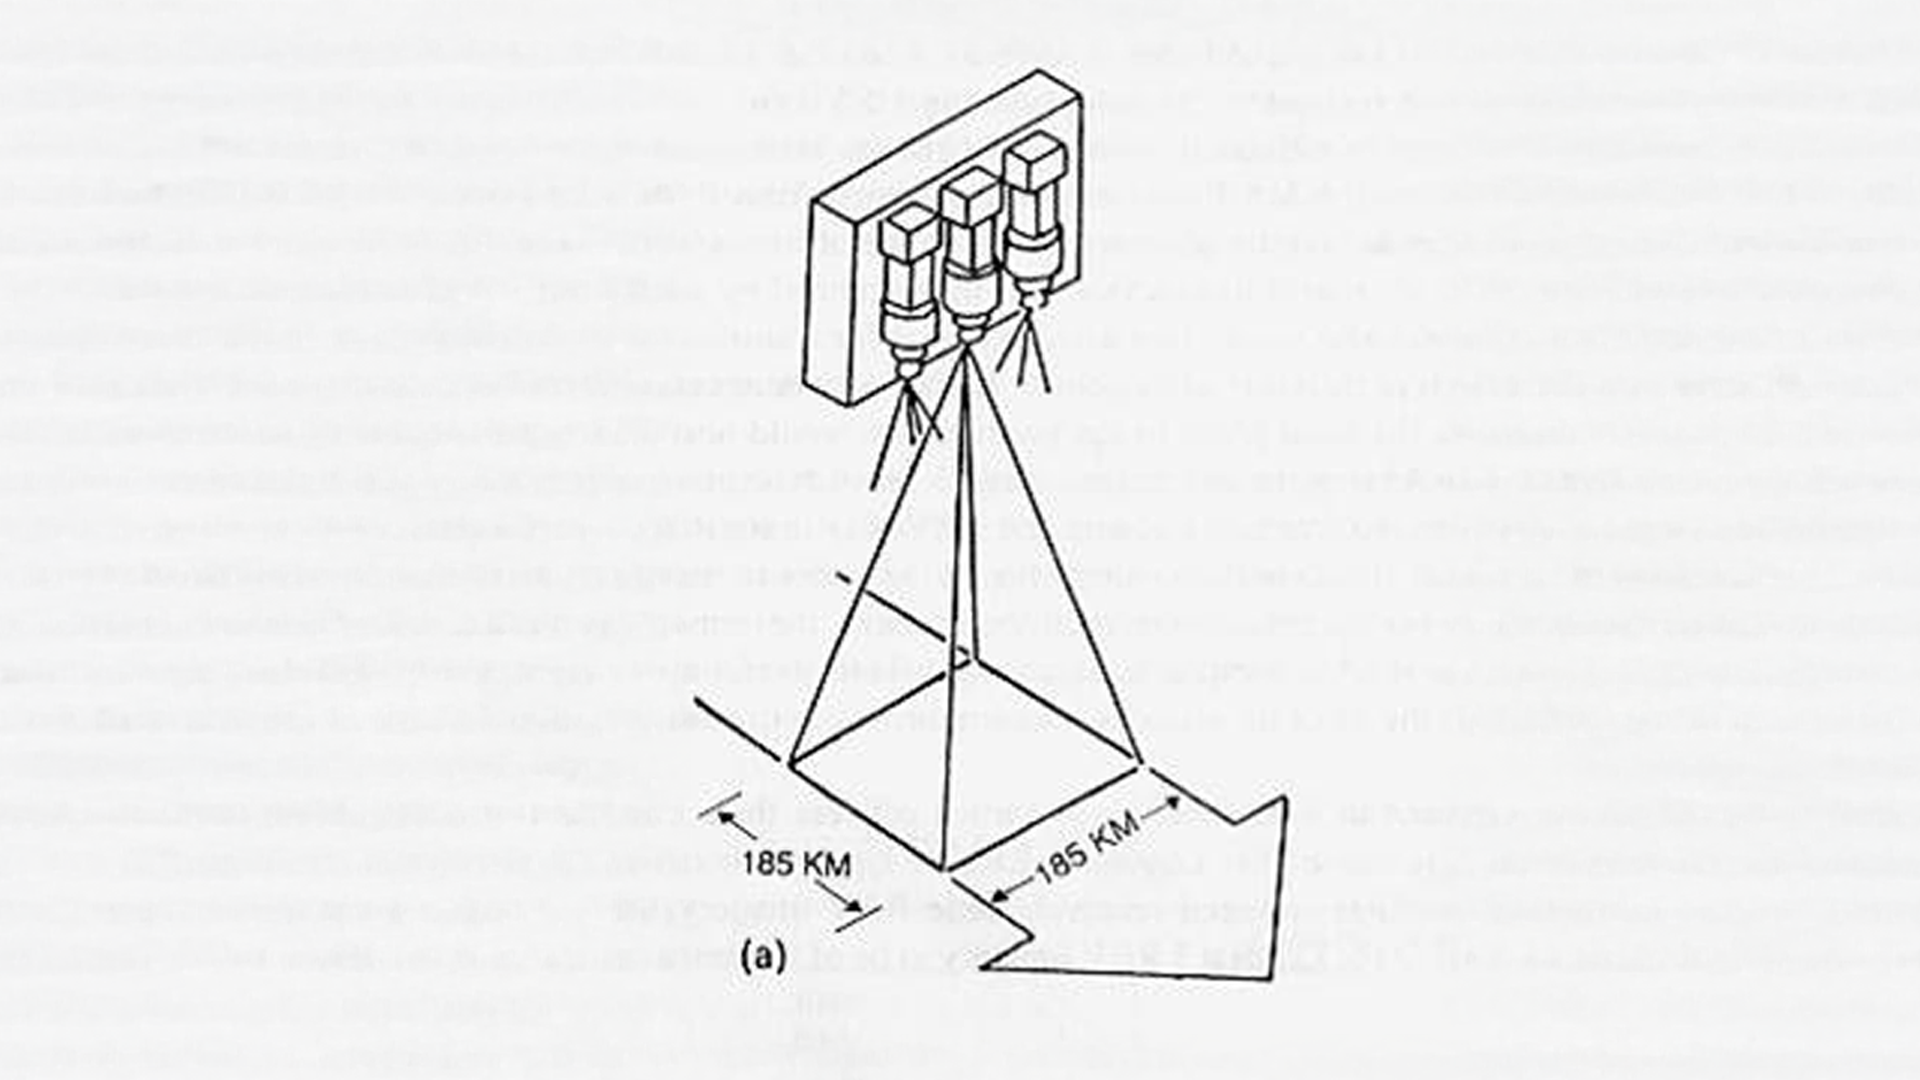
| Scene size: 170 km (106 mi) x 185 km (115 mi) | Swath Width: 185 km (115 mi) |
| Global Reference Grid System: WRS-1 | Altitude: 917 km (570 mi) |
| Inclination: 99.2° | Orbit: Polar, sun-synchronous |
| Equatorial Crossing Time: Nominally 9:42 AM mean local time (descending node) | Period of Revolution: 103 minutes; ~14 orbits/day |
| Design Life: 1 year |
Overview
Launched on July 22, 1975, the Landsat 2 (formerly ERTS-B) mission continued Landsat 1’s record of spaceborne Earth observation, demonstrating the scientific and economic value of consistent land measurements. Together, these satellites established the foundation of systematic, global land monitoring for resource management, environmental analysis, and mapping.
Landsats 1 and 2 were designed and built concurrently with a total budget of $197 million—approximately $1.5 billion in 2025. Landsat 2 carried the same two instruments as its predecessor: the Multispectral Scanner System (MSS) and the Return Beam Vidicon (RBV). The MSS was the satellite’s primary sensor due to its proven stability and reliability. The two satellites orbited together until Landsat 1 was decommissioned in 1978, providing scientists with imagery every nine days. Landsat 2 also provided the continuity needed for scientists to make reliable short- and long-term comparisons of Earth’s surface over time.
Until it was decommissioned on July 27, 1983, Landsat 2 reinforced the value of the Landsat program for researchers and decision-makers worldwide.
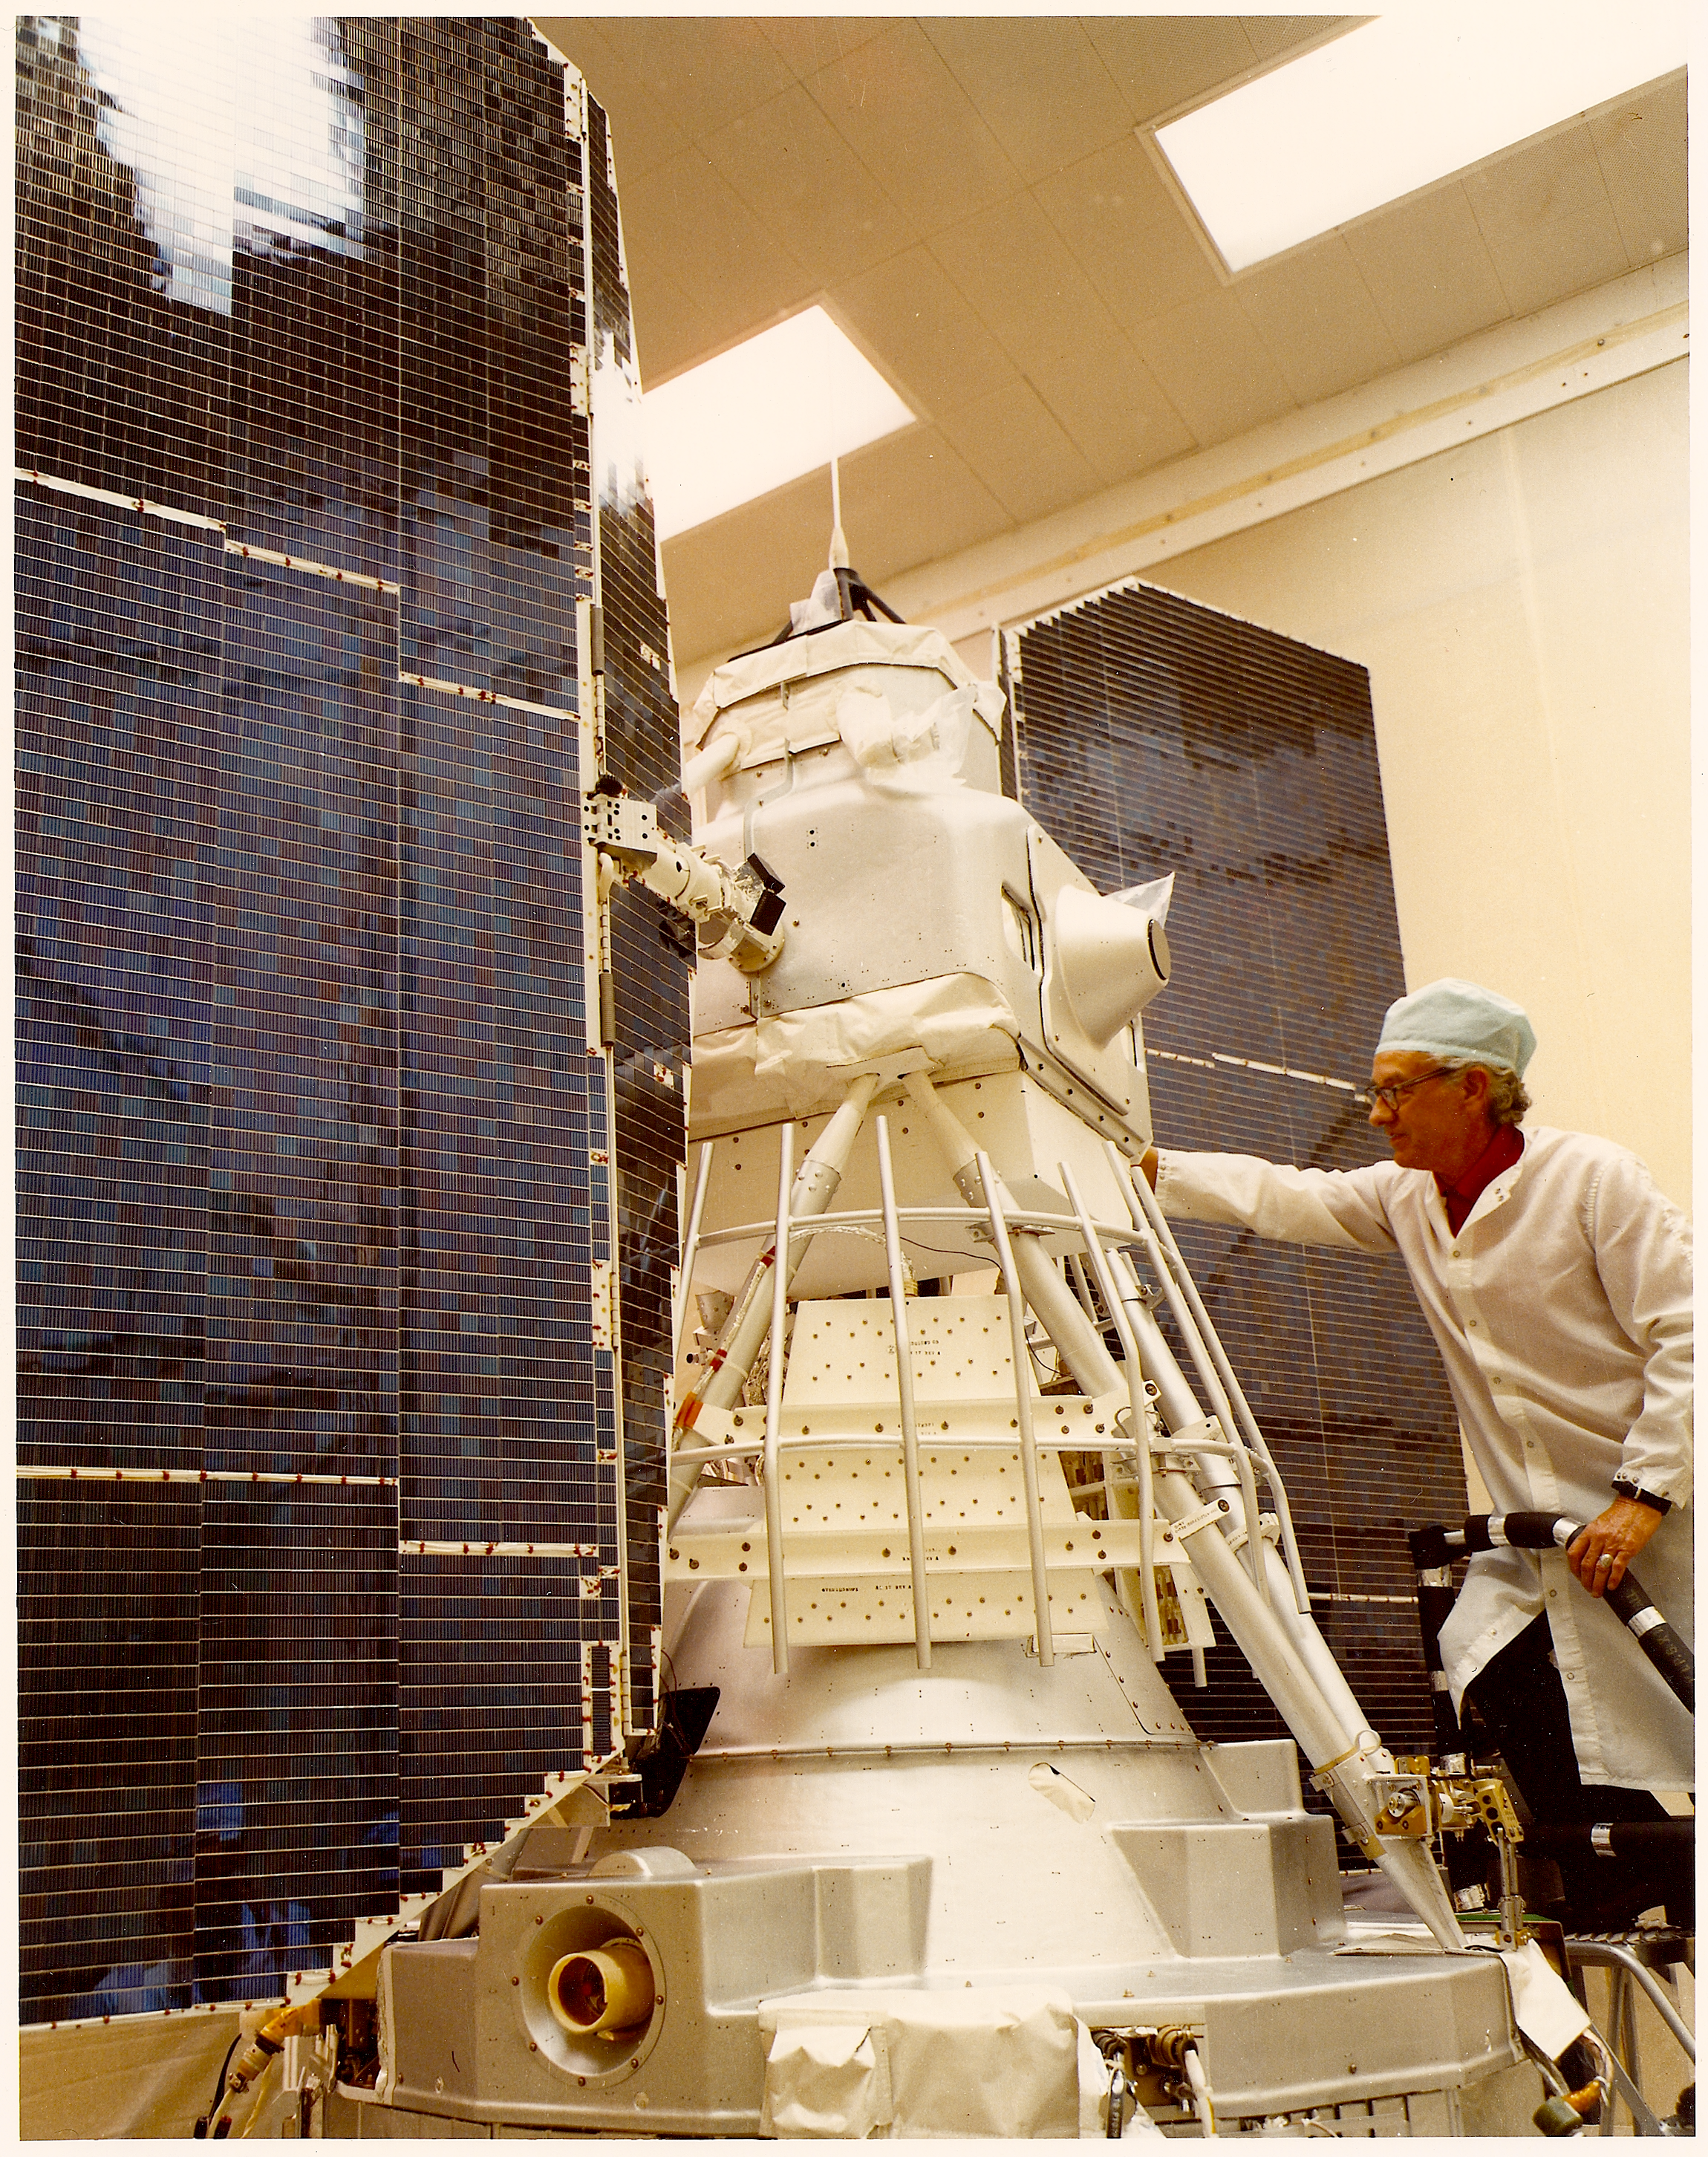
Spacecraft
Landsat 2 used the same Nimbus-derived platform and orbital path as Landsat 1 to deliver consistent land imaging. Working together, the two satellites scanned Earth every nine days.
The satellite carried two tape recorders to store data directly on the spacecraft. After both eventually failed, Landsat 2 continued transmitting valuable data through a growing network of international ground stations equipped with dedicated recording systems.
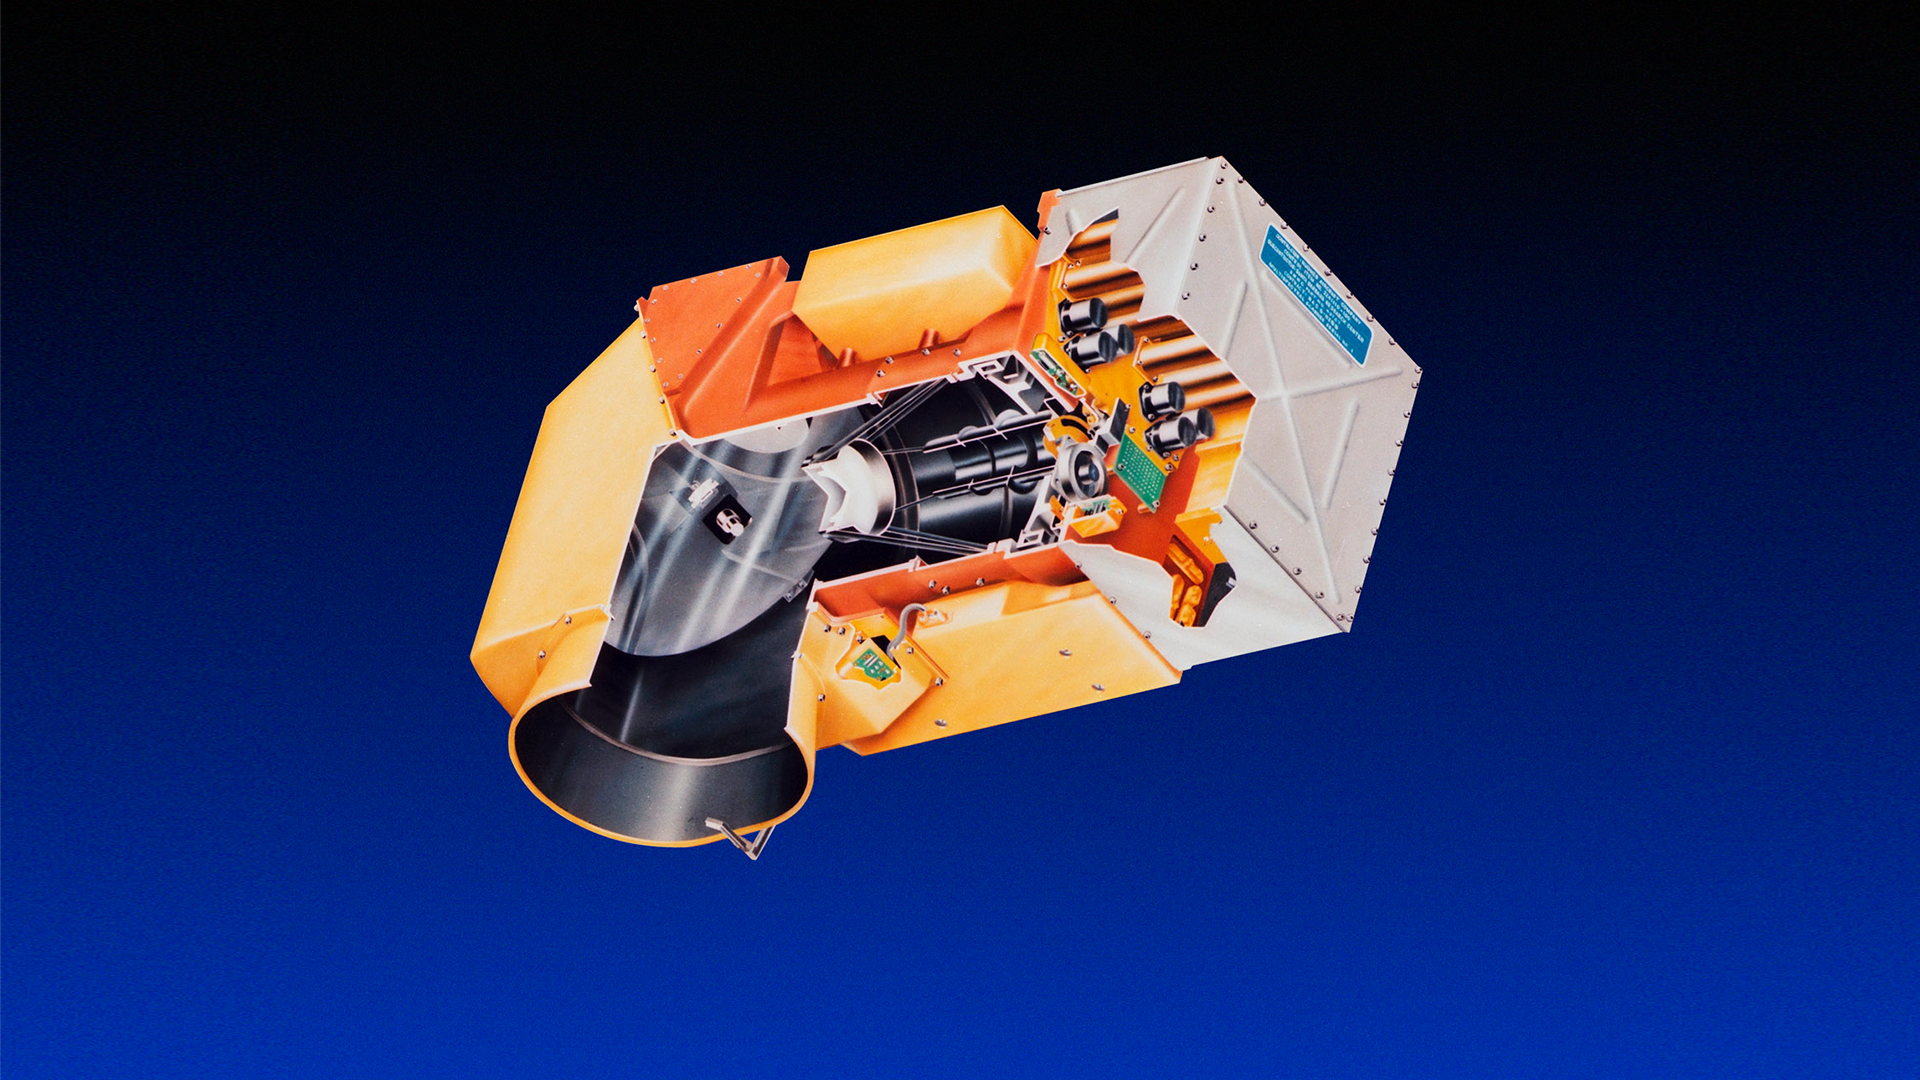
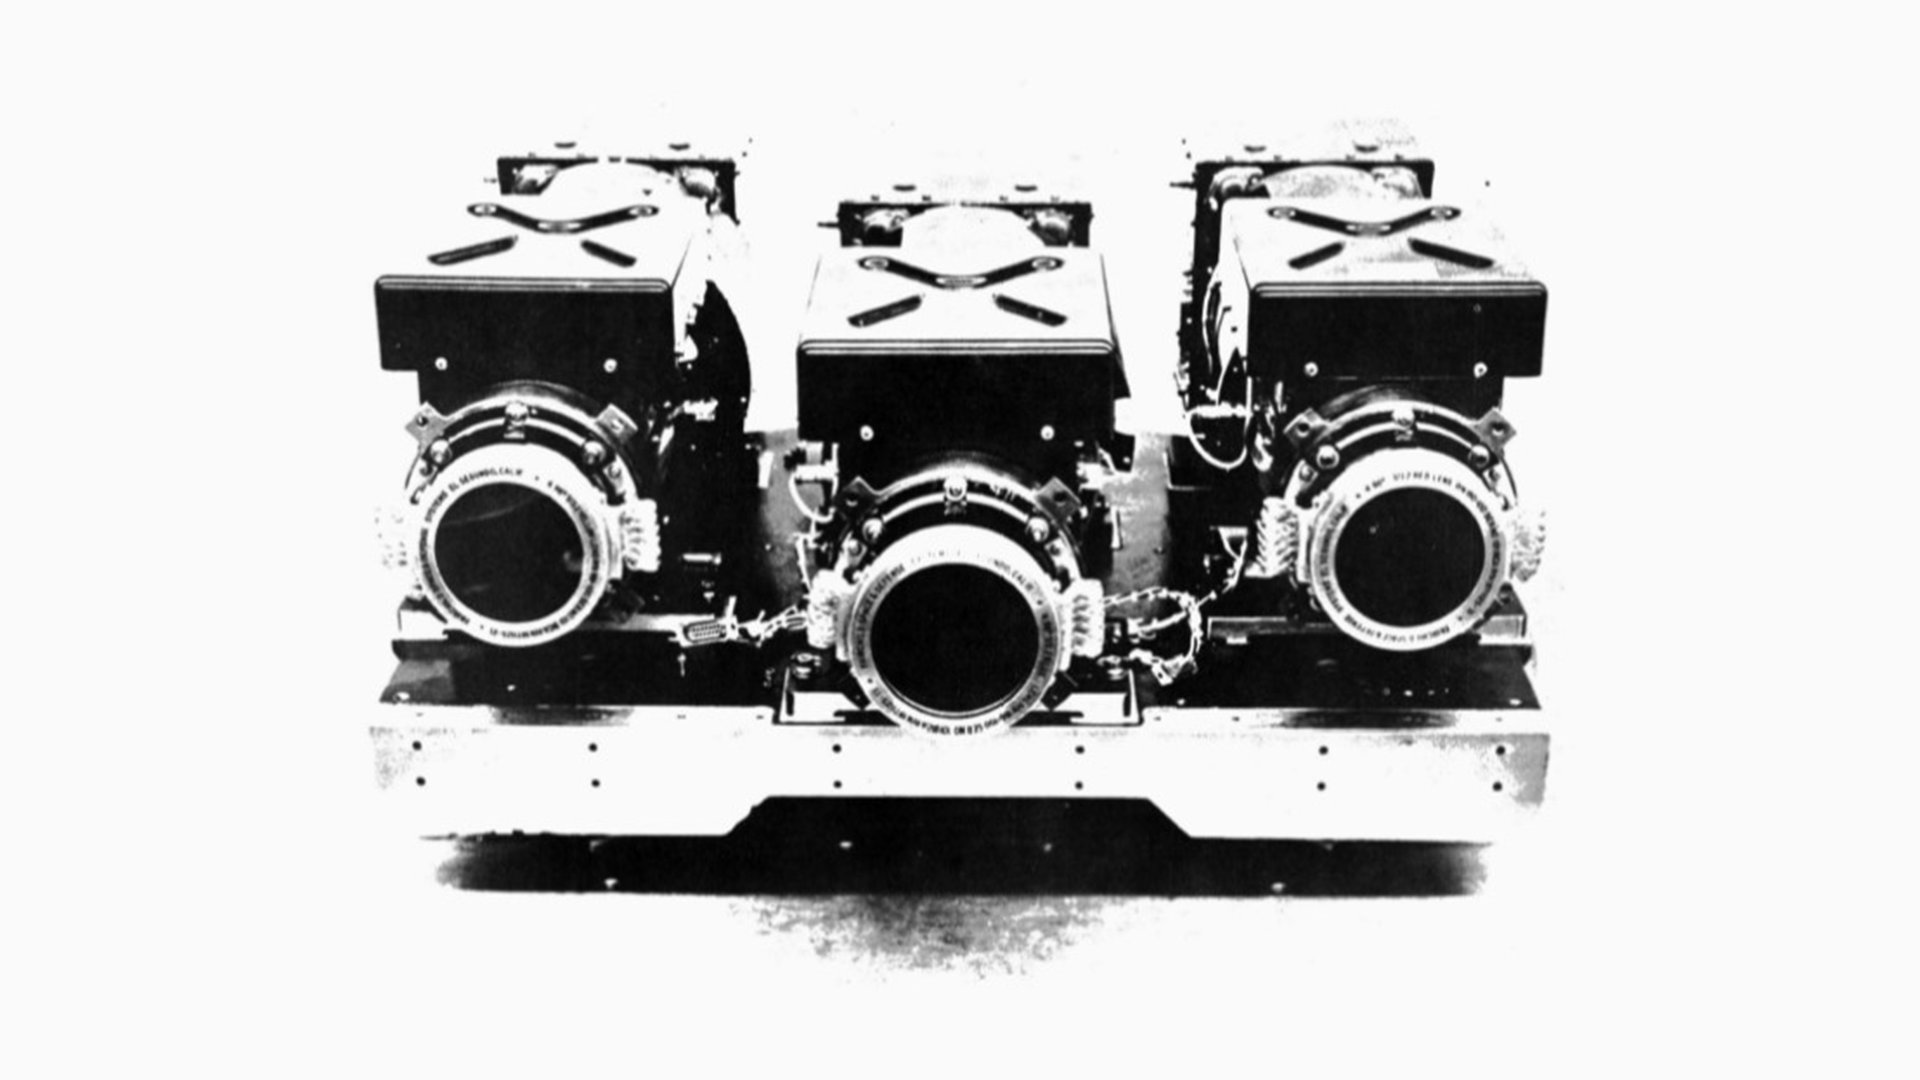
Return Beam Vidicon (RBV)
Though not required for scientific purposes, the RBV system flew on Landsat 2 as part of the legacy spacecraft design. The sensor was retained to avoid redesigning the spacecraft which was otherwise identical to Landsat 1. The RBV performed reliably but was rarely used, acquiring just 2,890 scenes by 1980.
It captured imagery in three visible-to-near-infrared bands at approximately 80-meter spatial resolution.
Band 1: Blue-green (0.475 – 0.575 µm)
Band 2: Orange-red (0.580 – 0.680 µm)
Band 3: Red-near-infrared (0.690 – 0.830 µm)
Spatial resolution: 80 m
Data: 3.5 MHz FM video
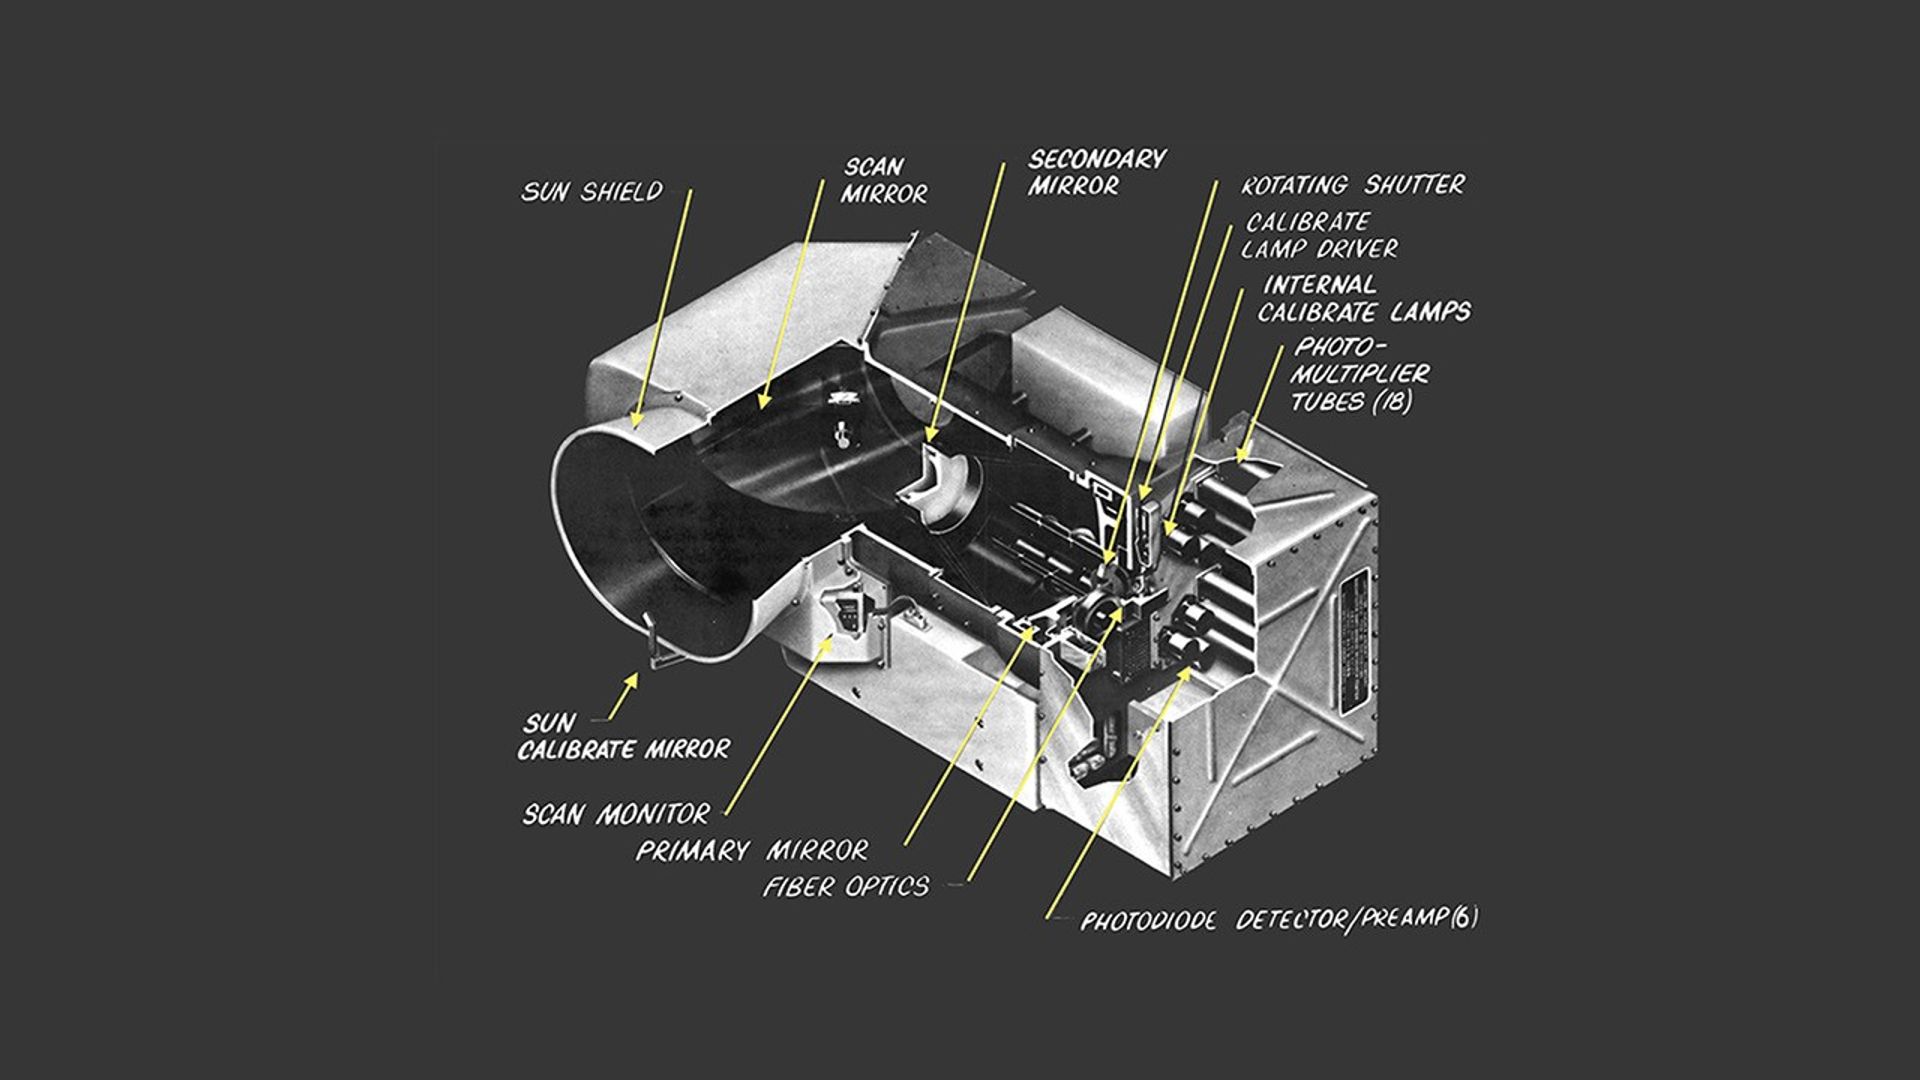
Multispectral Scanner System (MSS)
The MSS served as the primary instrument on Landsat 2, delivering high-quality data throughout the mission. By 1980, it had collected 383,942 scenes, supporting a wide range of land and water studies.
The sensor provided multispectral imagery in four bands, each with 80-meter spatial resolution, ideal for monitoring vegetation, surface water, and urban growth:
Band 4: Green (0.5 – 0.6 µm)
Band 5: Red (0.6 – 0.7 µm)
Band 6: Near-infrared (0.7 – 0.8 µm)
Band 7: Near-infrared (0.8 – 1.1 µm)
Spatial Resolution: 80 m (commonly resampled to 60 m)
Ground Sampling Interval (pixel size): 57 m x 79 m
Scene size: 170 km x 185 km (106 mi x 115 mi)
January 24, 1975
First Light
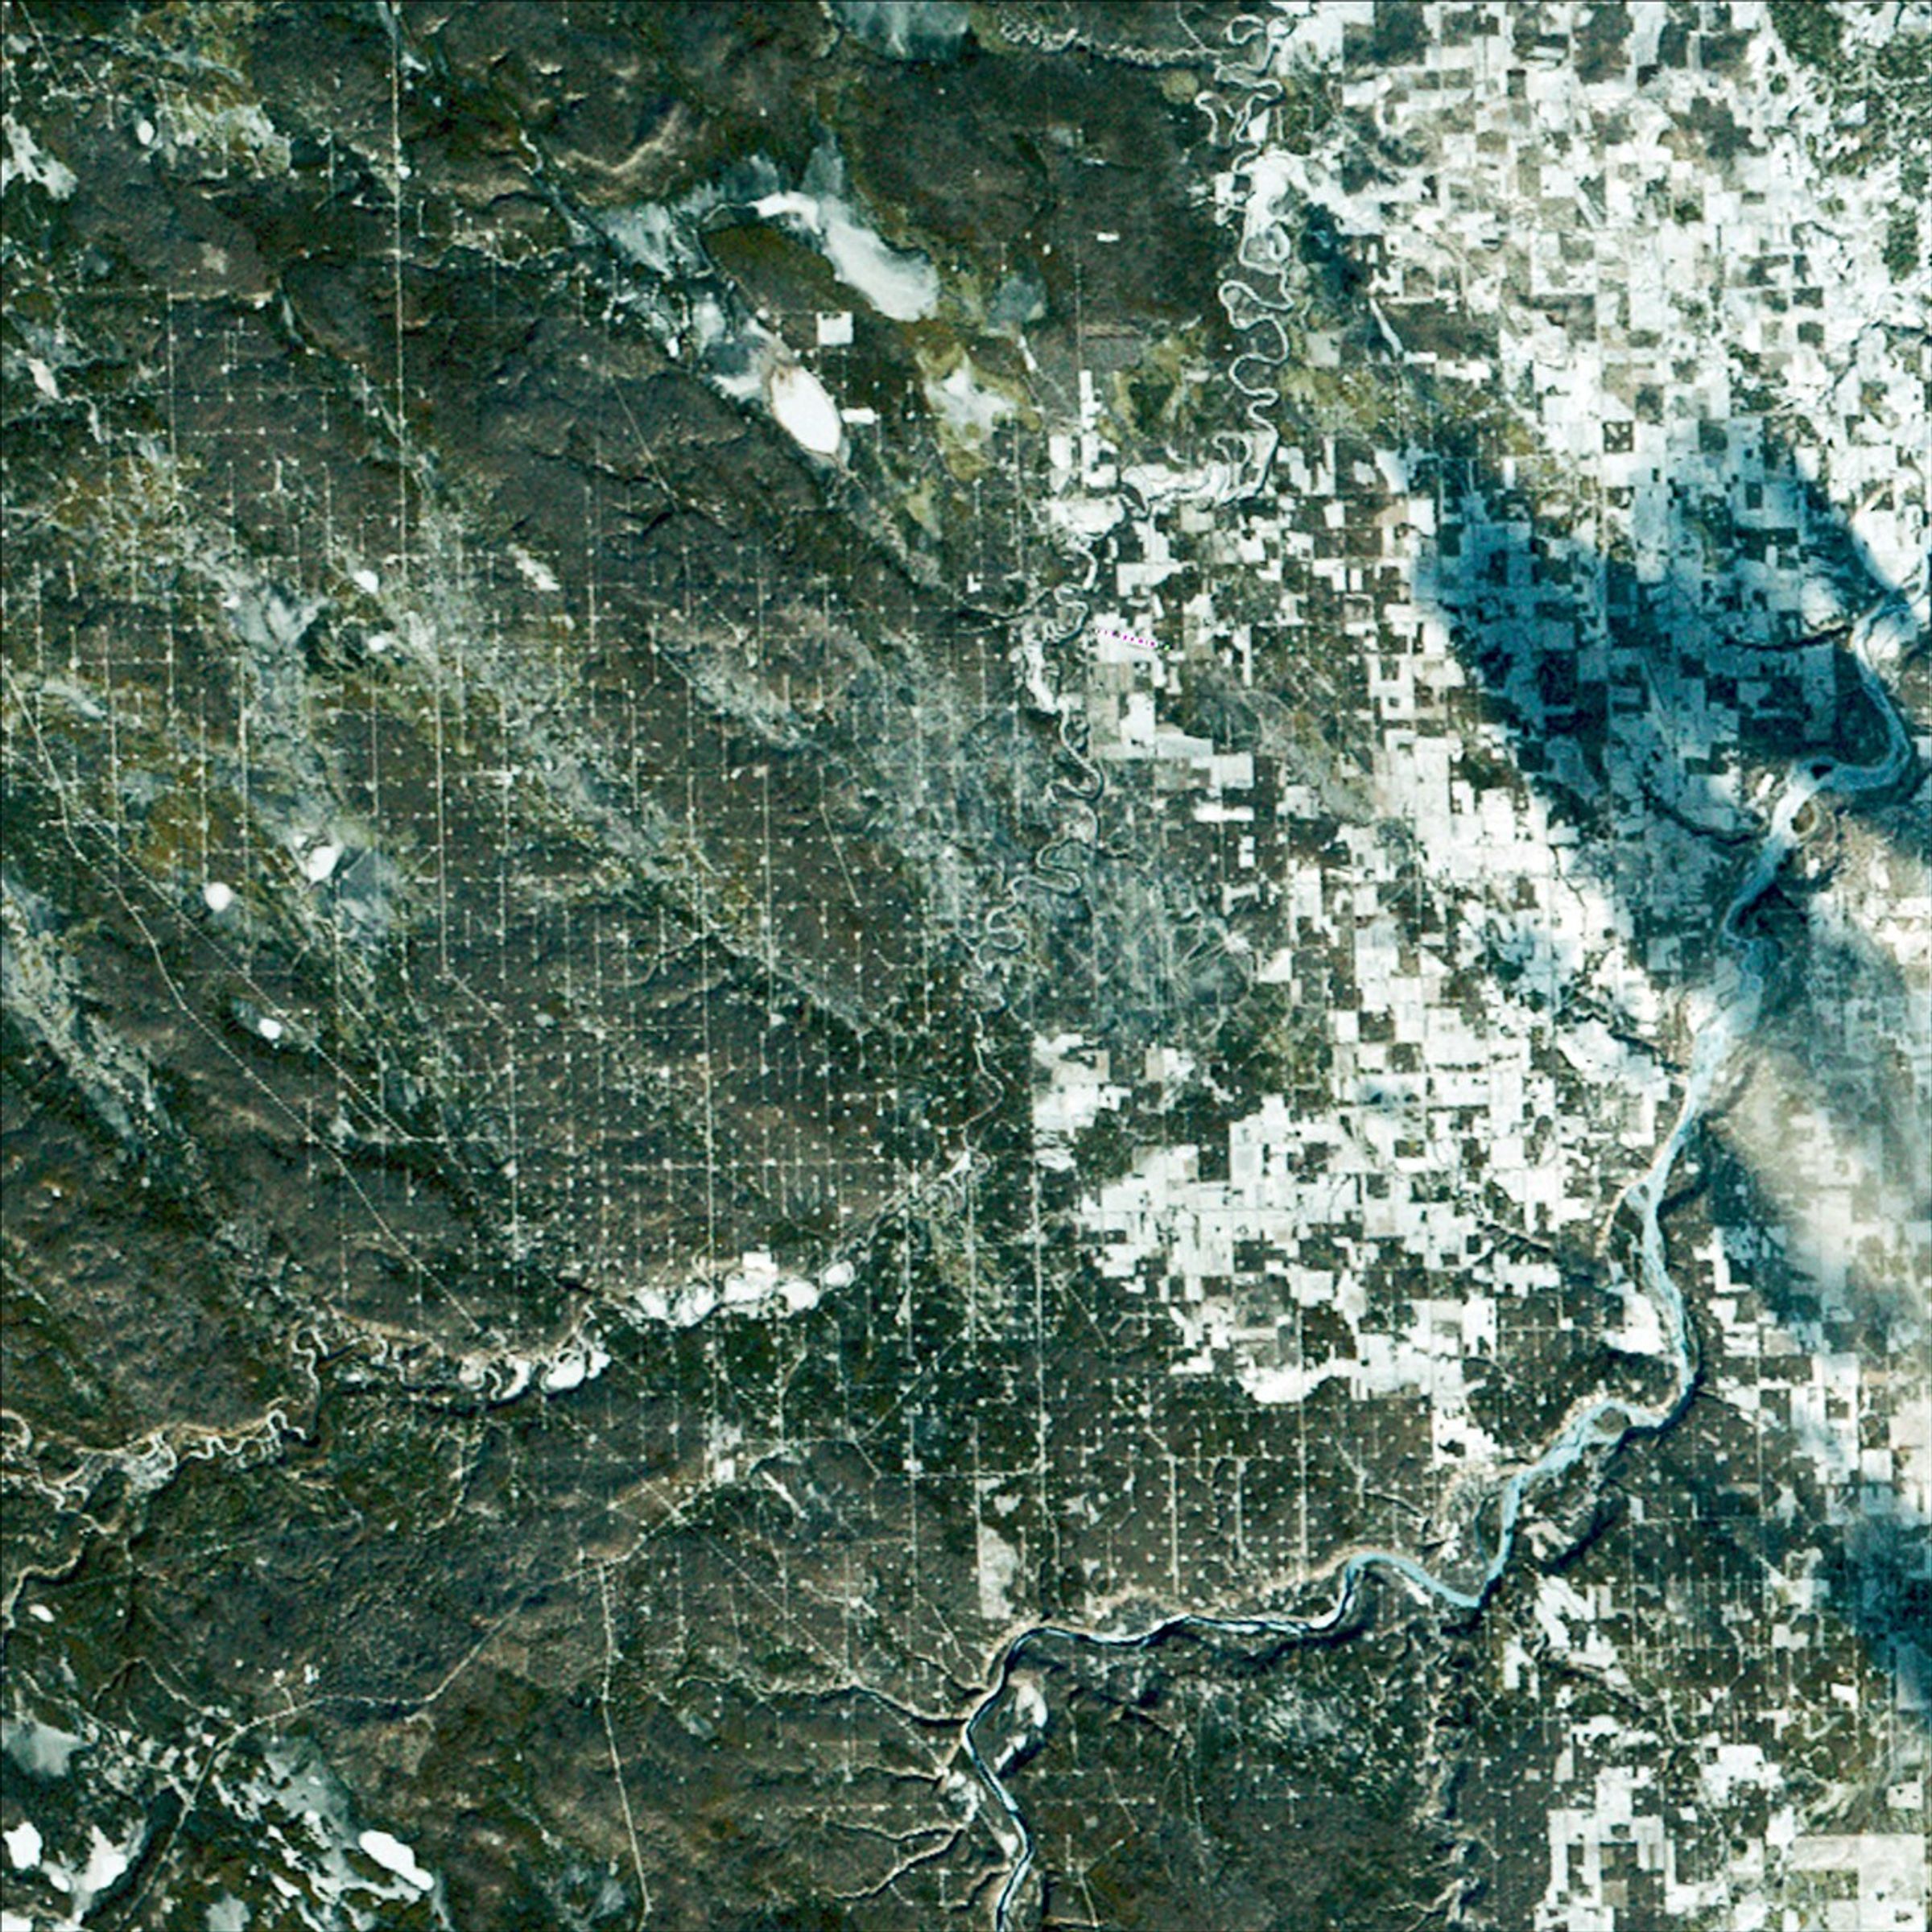
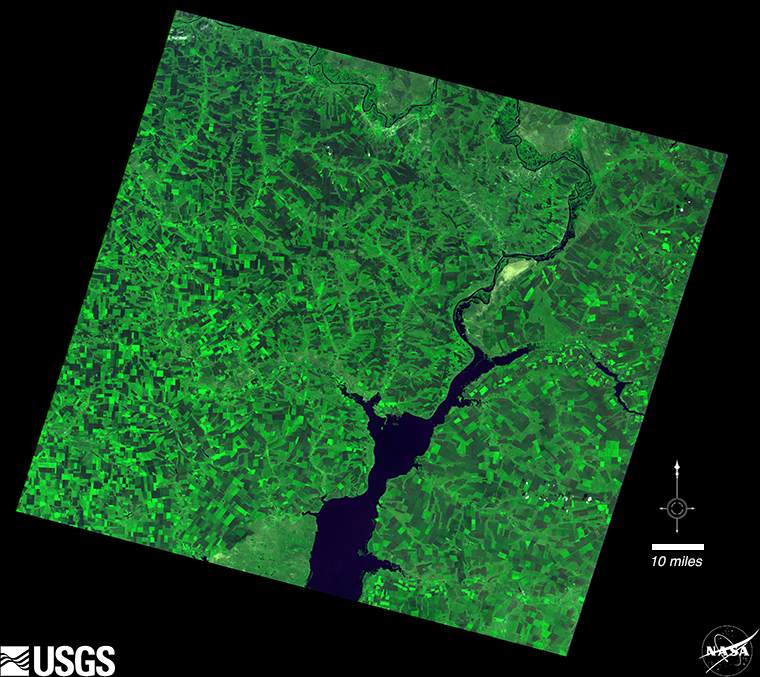
Canada's Drayton Valley
Landsat 2’s first light image shows a striking box pattern of wells and access roads along Canadian Highway 22. Following the 1953 Pembina oil field discovery, this sparsely populated farming and logging town experienced explosive growth and extensive infrastructure development to support the burgeoning oil and gas industry.
Learn More
Mission Objectives
-
• Acquire multispectral data of the surface of the Earth in the form of imagery or in digital format on magnetic tape.
• Develop a relay system to gather data from remote, widely distributed ground sensor platforms.
• Provide high-quality data by collecting synoptic, repetitive imagery of Earth's surface under consistent observation conditions for maximum utility of the multispectral imagery.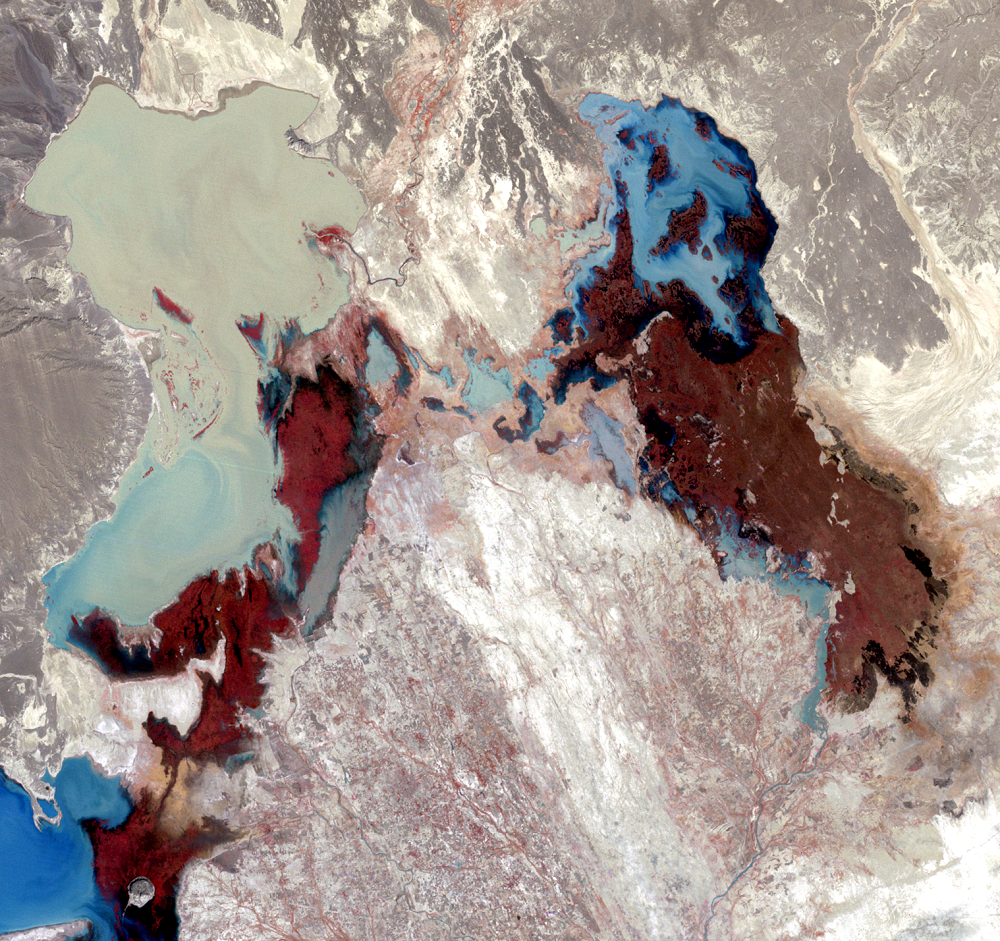 A false-color Landsat 2 satellite image of Lake Hamoun, Iran and Afghanistan (path/row 169/38,39).USGS
If I had to pick one spacecraft, or Space Age development to save the world, I would pick ERTS and the satellites which I believe will be evolved from it later in this decade.
James C. Fletcher
Former NASA Administrator
Mission Results
-
Data Collection
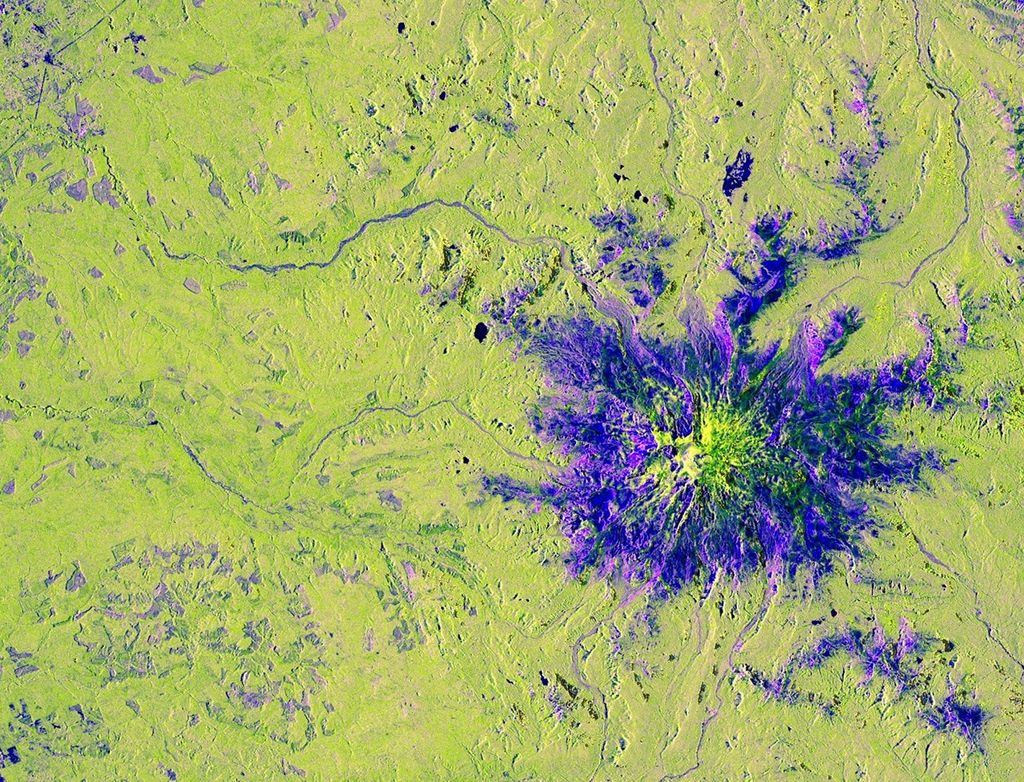
In its first five years, Landsat 2 collected 383,942 scenes—nearly twice the amount of data collected by Landsat 1 in a similar time period. This included imagery downlinked through both U.S. and international ground stations, helping build one of the most comprehensive global land datasets of its time. This massive data collection contributed to the growing global archive of Earth observation data that enabled change detection analyses for the first time.
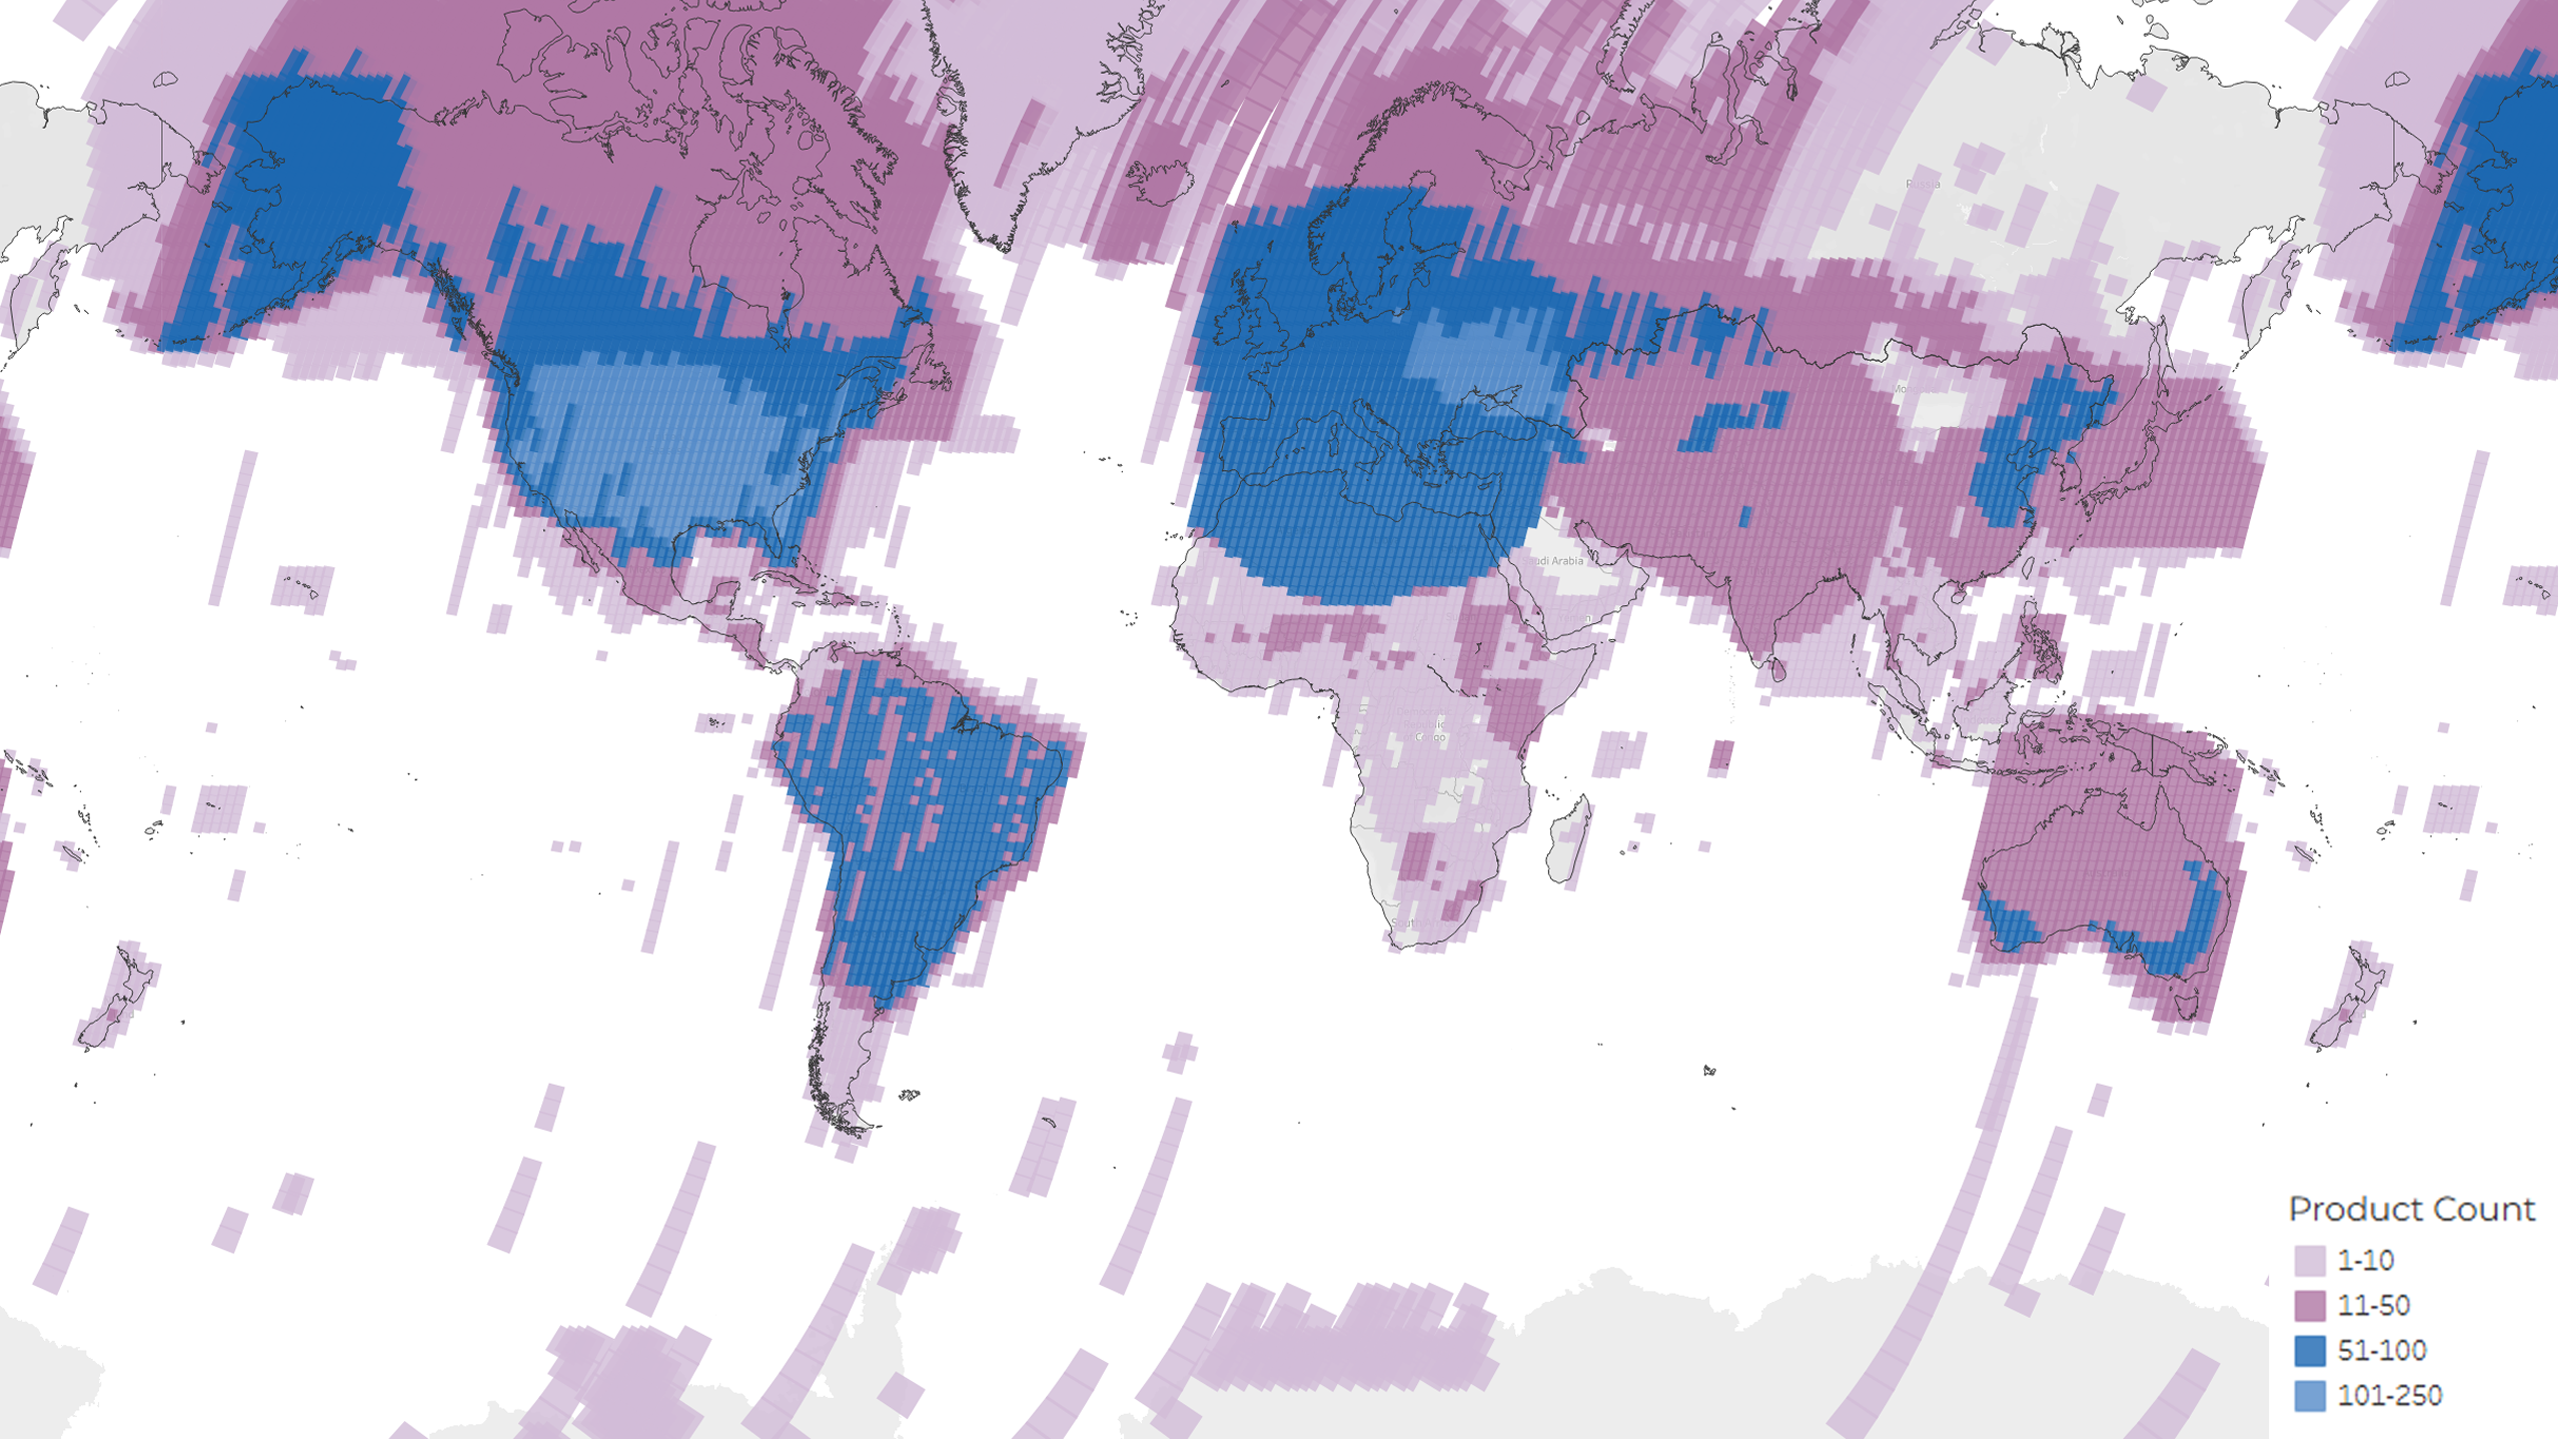 A density map showing the distribution of the more than 350,000 MSS scenes acquired during the lifetime of the Landsat 2 mission. The colors represent the number of products per Path/Row, which are still increasing as more images are added to the archive.USGS
 -
Extended Mission Continuity
Circling the Earth in an orbit offset by 9 days from Landsat 1’s orbit, Landsat 2 reduced the risk of a data gap should something happen to one of the two satellites. This redundancy proved useful in 1977 and 1980, when Landsat 1 experienced tape recorder failures that limited its acquisitions to areas within downlink range of a ground station. Landsat 2 was able to maintain global coverage and ensure data continuity for hundreds of scientific investigations. The enhanced coverage supported expanding international applications, as shown by the growing network of international ground stations during this period.
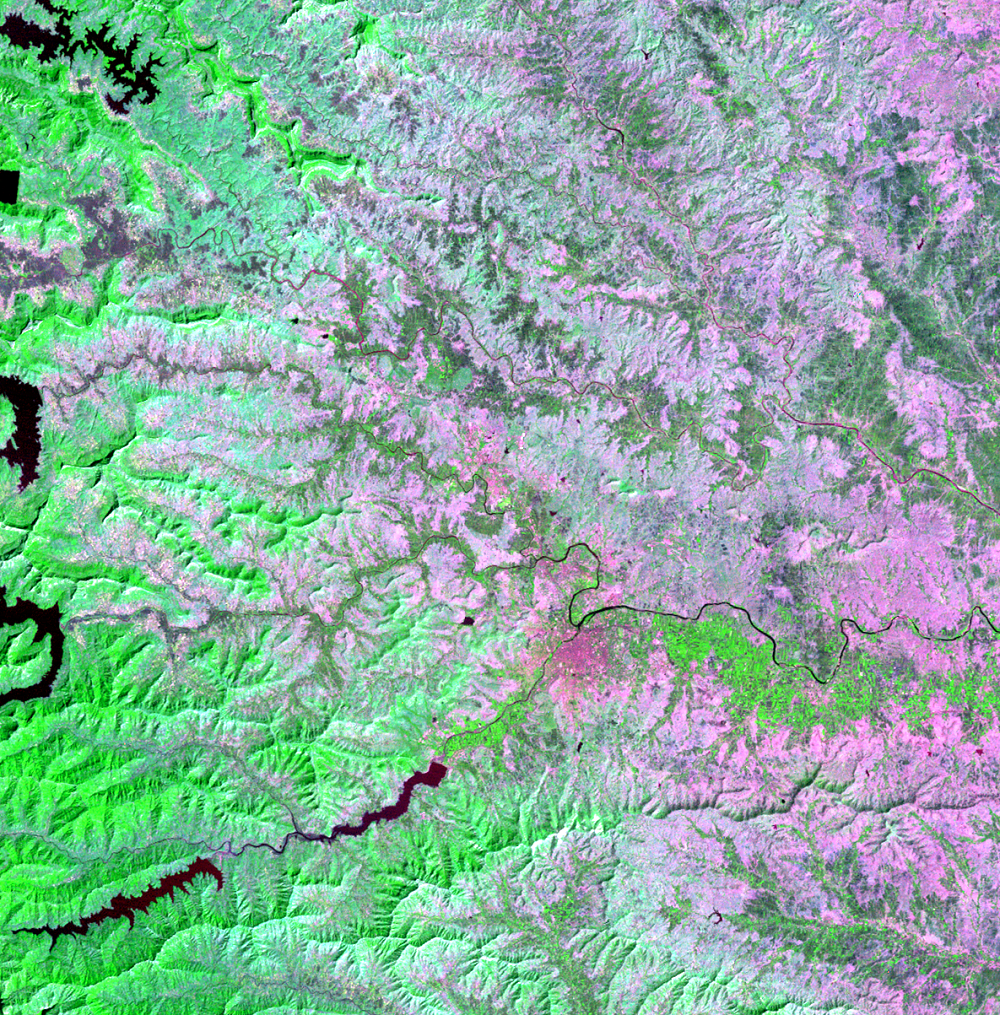
Redundancy of onboard components was also essential to the successful operation of Landsat 2. When the MSS scan line monitor developed issues in 1979, engineers successfully activated a backup LED that allowed the mission to continue through its seven-year lifespan. Hand-laid mosaic of 75 false color photos derived from digital MSS data over Minnesota, Michigan’s Upper Peninsula, Wisconsin, Illinois, and Iowa, with Lake Superior at the top and Lake Michigan at right. Data acquired by Landsat 1 and 2, April– June, 1973–1978.USGS EROS
Go Now! Landsat & the Calypso Caper
During the summer of 1975, Jacques Cousteau and his divers helped NASA determine if Landsat could measure the depth of shallow ocean waters. The story of this NASA-led satellite bathymetry experiment unfolds through the photography and expedition documents preserved by David Lychenheim, the expedition’s communications engineer.
Learn MoreLegacy
-
Expansion of International Cooperators
Early Landsat satellites had limited onboard storage and needed to transmit data to various ground stations around the globe. Canada, Brazil, and Italy were the first in this network of international cooperators (ICs) who paid a fee for the right to receive and distribute Landsat data.
By the end of Landsat 2’s operational life in 1982, there were 12 international ground stations, expanding coverage over three more continents. This expansion demonstrated the usefulness of global ground station networks to effectively distribute responsibilities and established the foundation for international cooperation in Earth observation that continues today. -
A Satellite Constellation
Landsat 2 operated in tandem with Landsat 1 for nearly three years, reducing the revisit time from 18 to 9 days. Doubling the temporal frequency was critical for:
• Supporting agricultural inventory programs including the Large Area Crop Inventory Experiment (LACIE)
• Disaster response and assessment
• Tracking rapid environmental changes
• Increasing the likelihood of cloud-free observations -
Pioneering Digital Crop Forecasting
Together with Landsat 1, Landsat 2 demonstrated the practical value of satellite imagery for scientific and commercial applications. One of the most significant applications of early Landsat data was the NASA-led, interagency Large Area Crop Inventory Experiment (LACIE). Following the 1973 Crop Identification Technology Assessment for Remote Sensing (CITARS) project, LACIE (1974–1978) used MSS data to monitor and estimate global wheat production.
LACIE marked a shift from visual interpretation to digital image processing. In 1977, it successfully estimated Soviet wheat harvest within one percent of the final reported total, proving that automated analysis could produce accurate global crop forecasts.
As a result of the LACIE program, future Landsat sensors were built with higher spatial, spectral, and temporal resolution to better discriminate among land cover types. Early multispectral Landsat data also spurred commercial applications. EarthSat’s CROPCAST system leveraged MSS data to improve forecasts of wheat, corn, soybeans, and cotton for North and South America.
Project and Program Management
Stanley C. Freden
Landsat 2 Project Scientist
Jack Sargent
Landsat 2 Project Manager
Harry Mannheimer
NASA Headquarters ERTS Program Manager
Charles D. Center
NASA Headquarters ERTS Program Engineer
Landsat 2 Graphics Library

Related Resources
Explore additional Landsat 2 resources for more background information about the development, launch, and history of the mission.
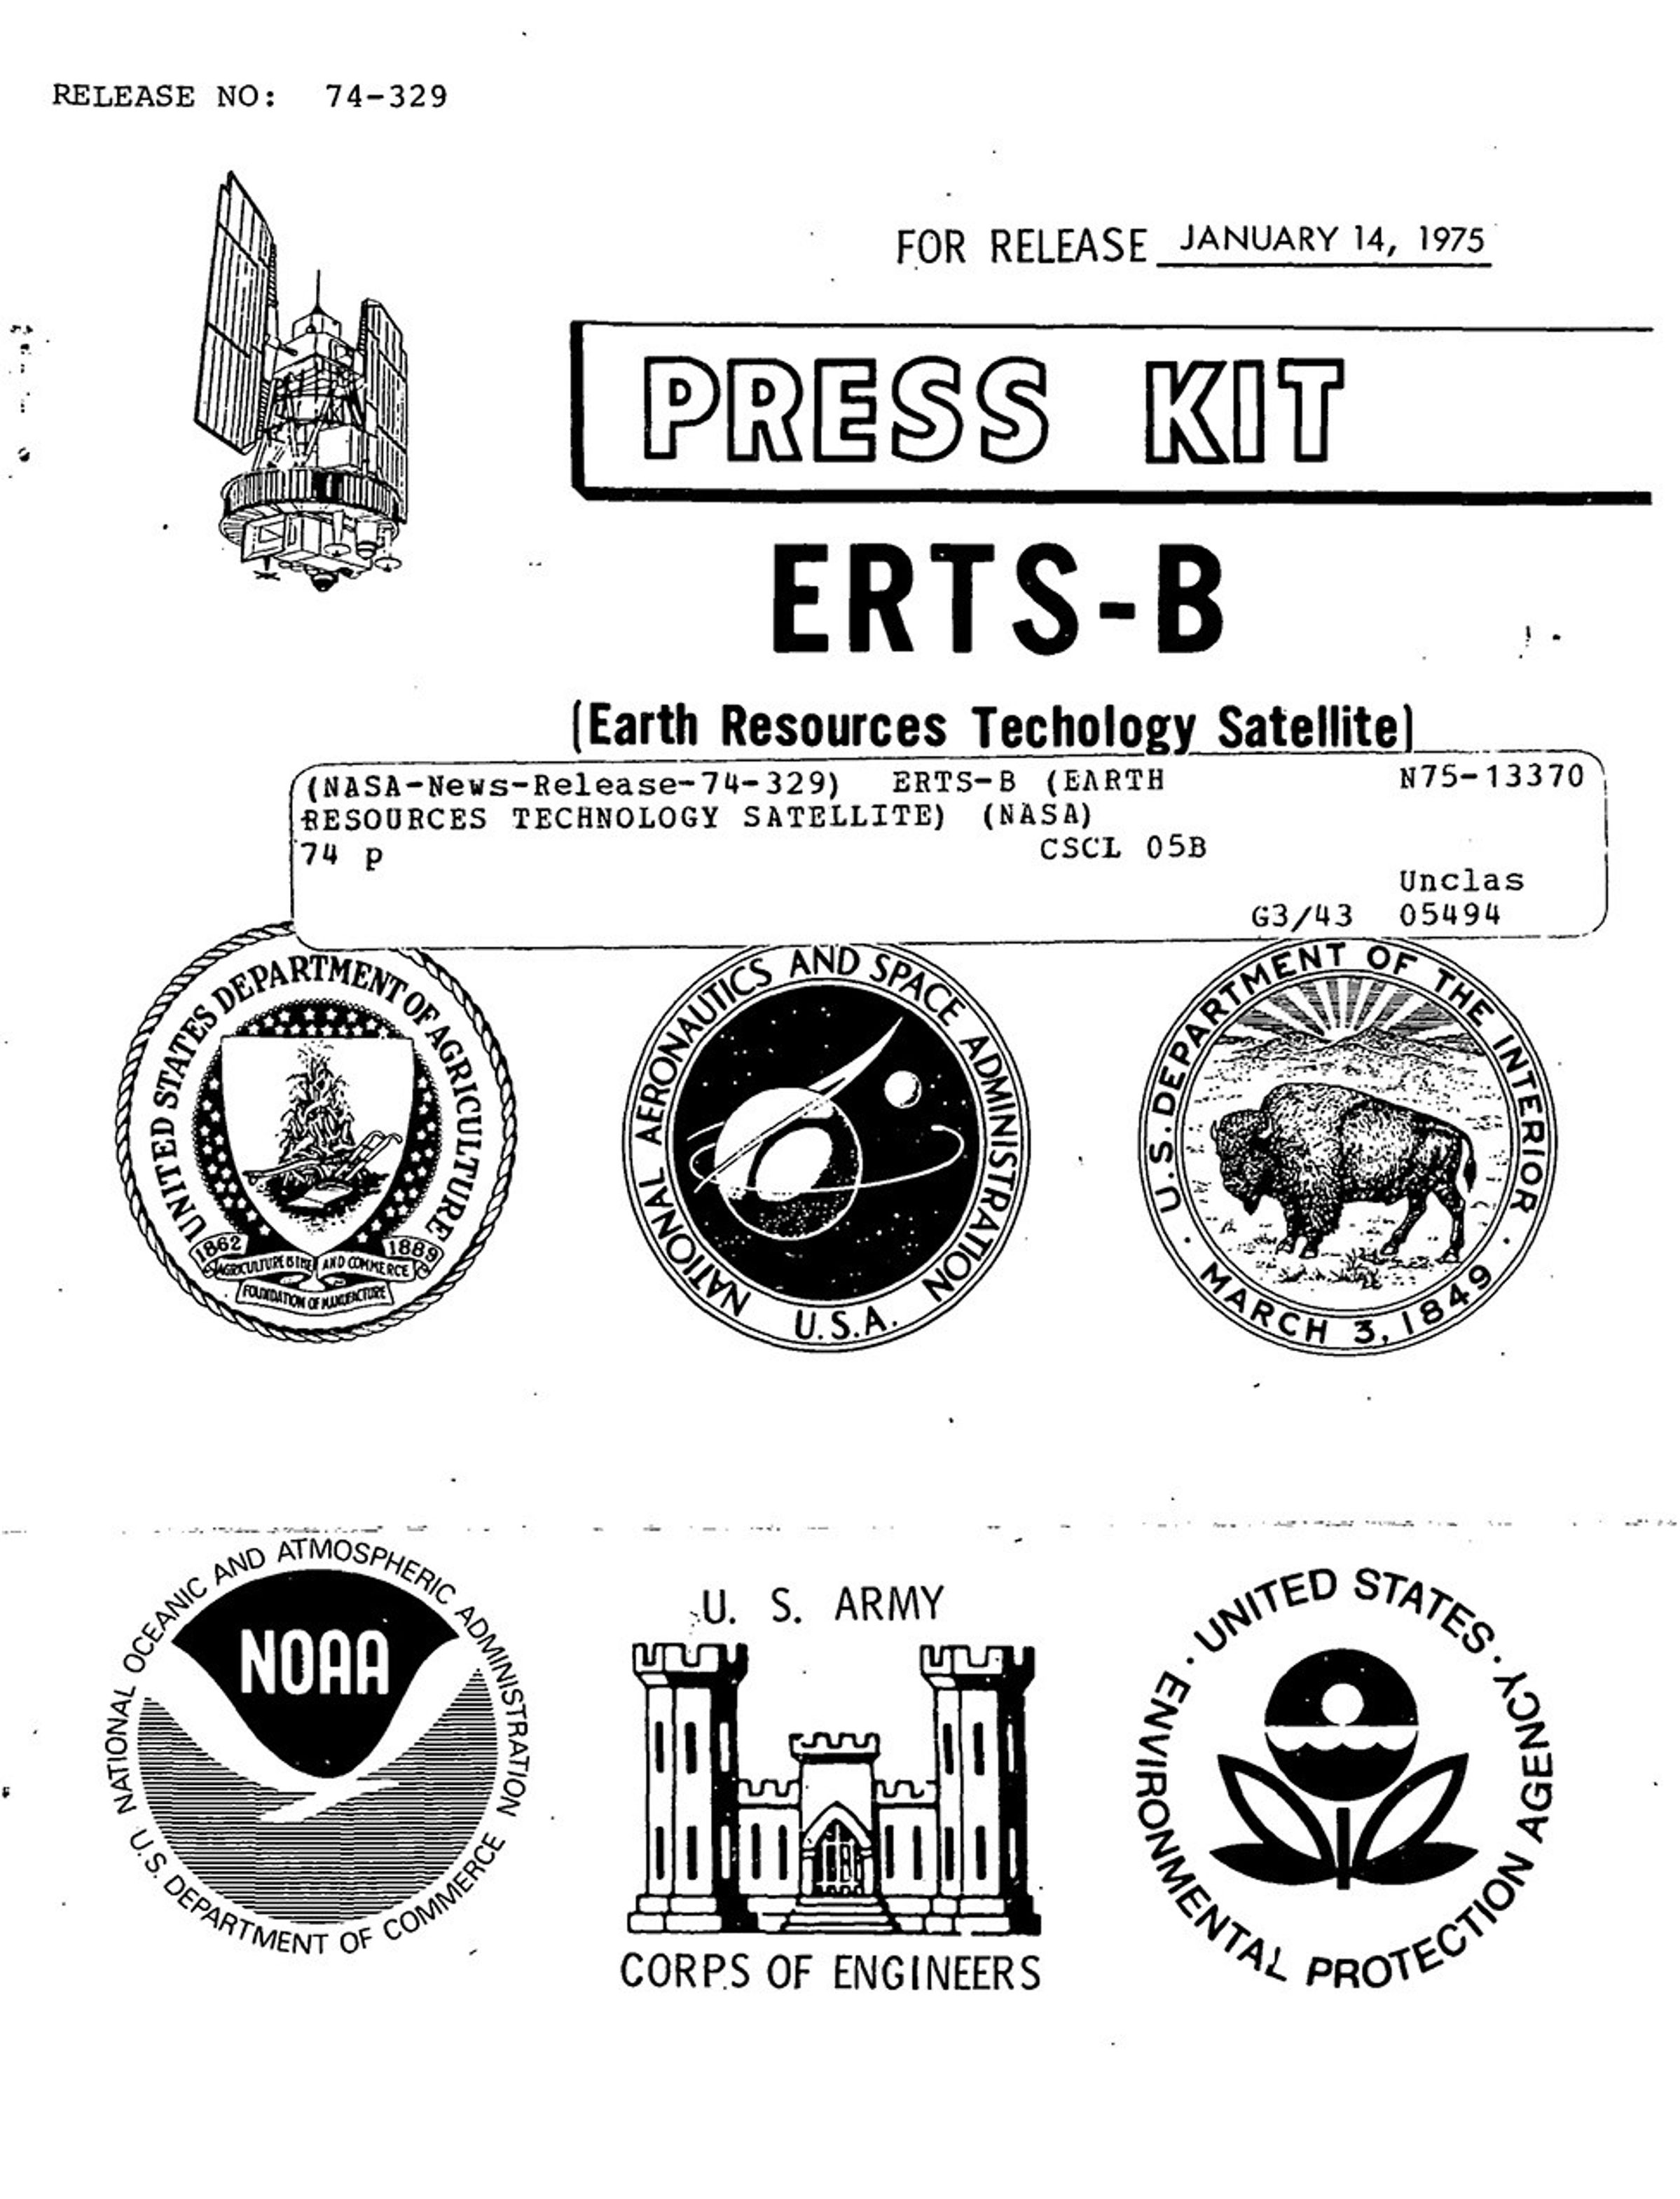
ERTS-B Press Kit
This document introduces NASA's Earth Resources Technology Satellite B, detailing its purpose and objectives.

ERTS (II): A New Way of Viewing the Earth
This 1973 Science article highlights how ERTS-1 revolutionized global mapping and environmental monitoring.
USGS Landsat 2 StoryMap
This interactive story narrates the launch, history, and applications of the Landsat 2 mission.


