











Mission Success! Celebrating Landsat 9’s Five-Year Design Life Milestone
By Sean Keefe
September 29, 2026
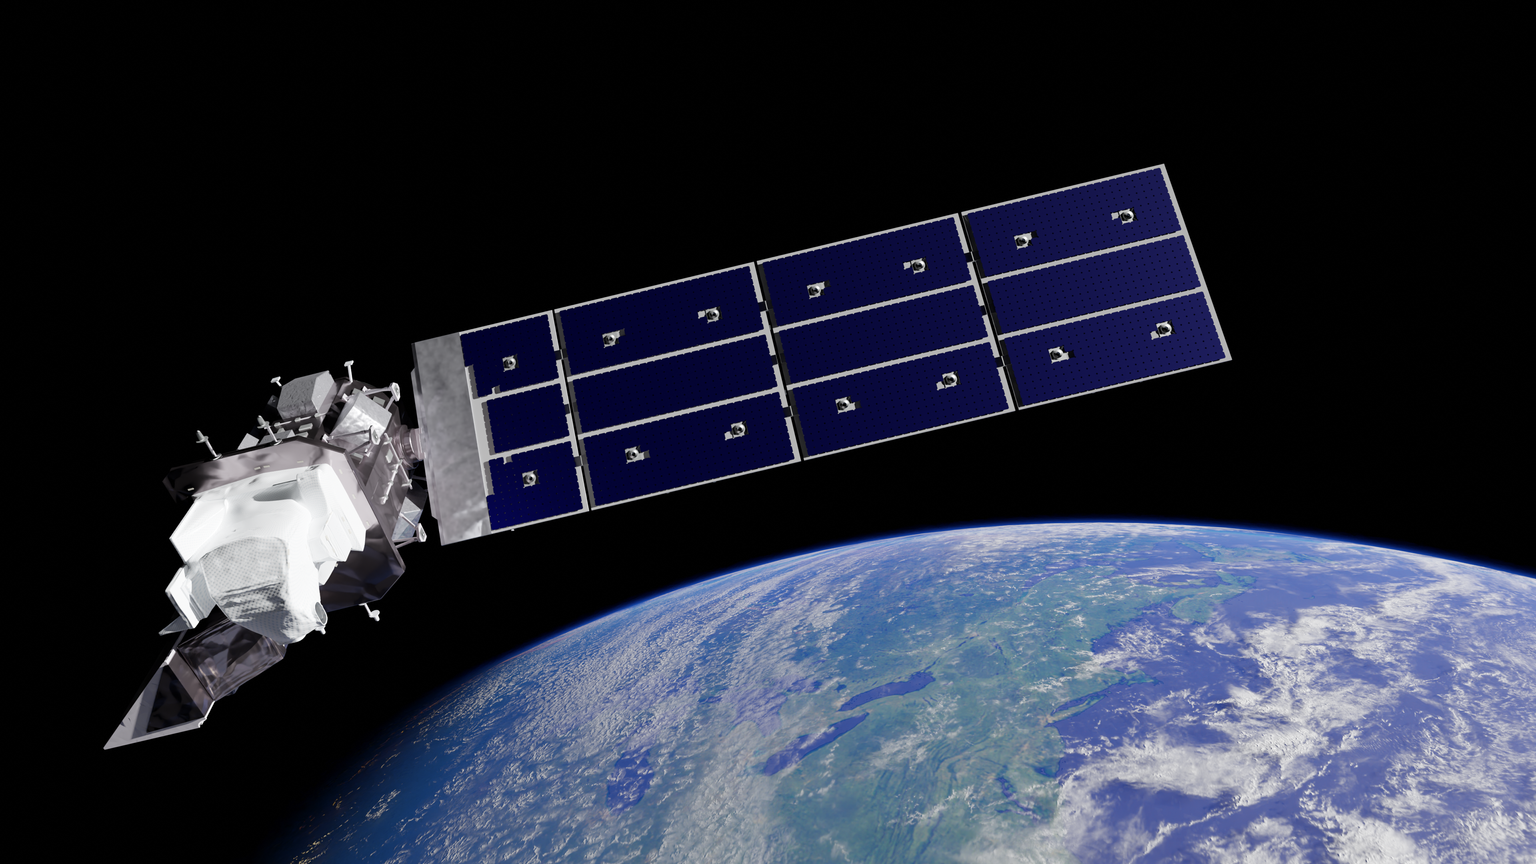
NASA’s Landsat 9 mission completed its five-year design life on Sunday, September 27, 2026. This critical mission milestone — 54 years after the Landsat 1 mission launch — is a reminder of the enduring success of the Landsat program and its role in providing the longest continuous, space-based record of Earth’s surface. As with all past missions, Landsat 9's data are essential for studying change over time to better understand our planet and make informed decisions about Earth’s resources and environment.
The Landsat 9 mission is a joint partnership between NASA and the U.S. Geological Survey (USGS). NASA built and launched the satellite into orbit on September 27, 2021, then put the satellite through 10 months of extreme calibration, validation, and maneuvering tests to ensure that its instruments operated as planned while in orbit. Once this on-orbit checkout was completed, the USGS took over day-to-day operations and data management. Landsat 9 is also the first Landsat mission of the NASA/USGS Sustainable Land Imaging (SLI) Program, which was established to bring stability and predictability to spaceborne U.S. land imaging.
When Landsat 9 joined Landsat 8 in orbit in 2021, it doubled the data that researchers can use to study Earth. By combining the data from each satellite's 16-day passes over the globe, this provides near-weekly observations of a given area, which improves agricultural reporting, disaster management, forestry and fire management, public health and safety monitoring, and water quality assessments.
Agriculture
Landsat data serves as the foundation for invaluable agricultural research tools, including the National Land Cover Database (NLCD) and the USDA's Cropland Data Layer (CDL), which provide standardized information for decision-makers across the agricultural sector. Landsat 9's accurate, reliable, timely data helps research teams monitor crop health and famine across the planet. This vital information is used by governments and humanitarian organizations to efficiently increase food productivity, reduce food insecurity, maximize resource efficiency, and strategically plan food aid where it is needed most.
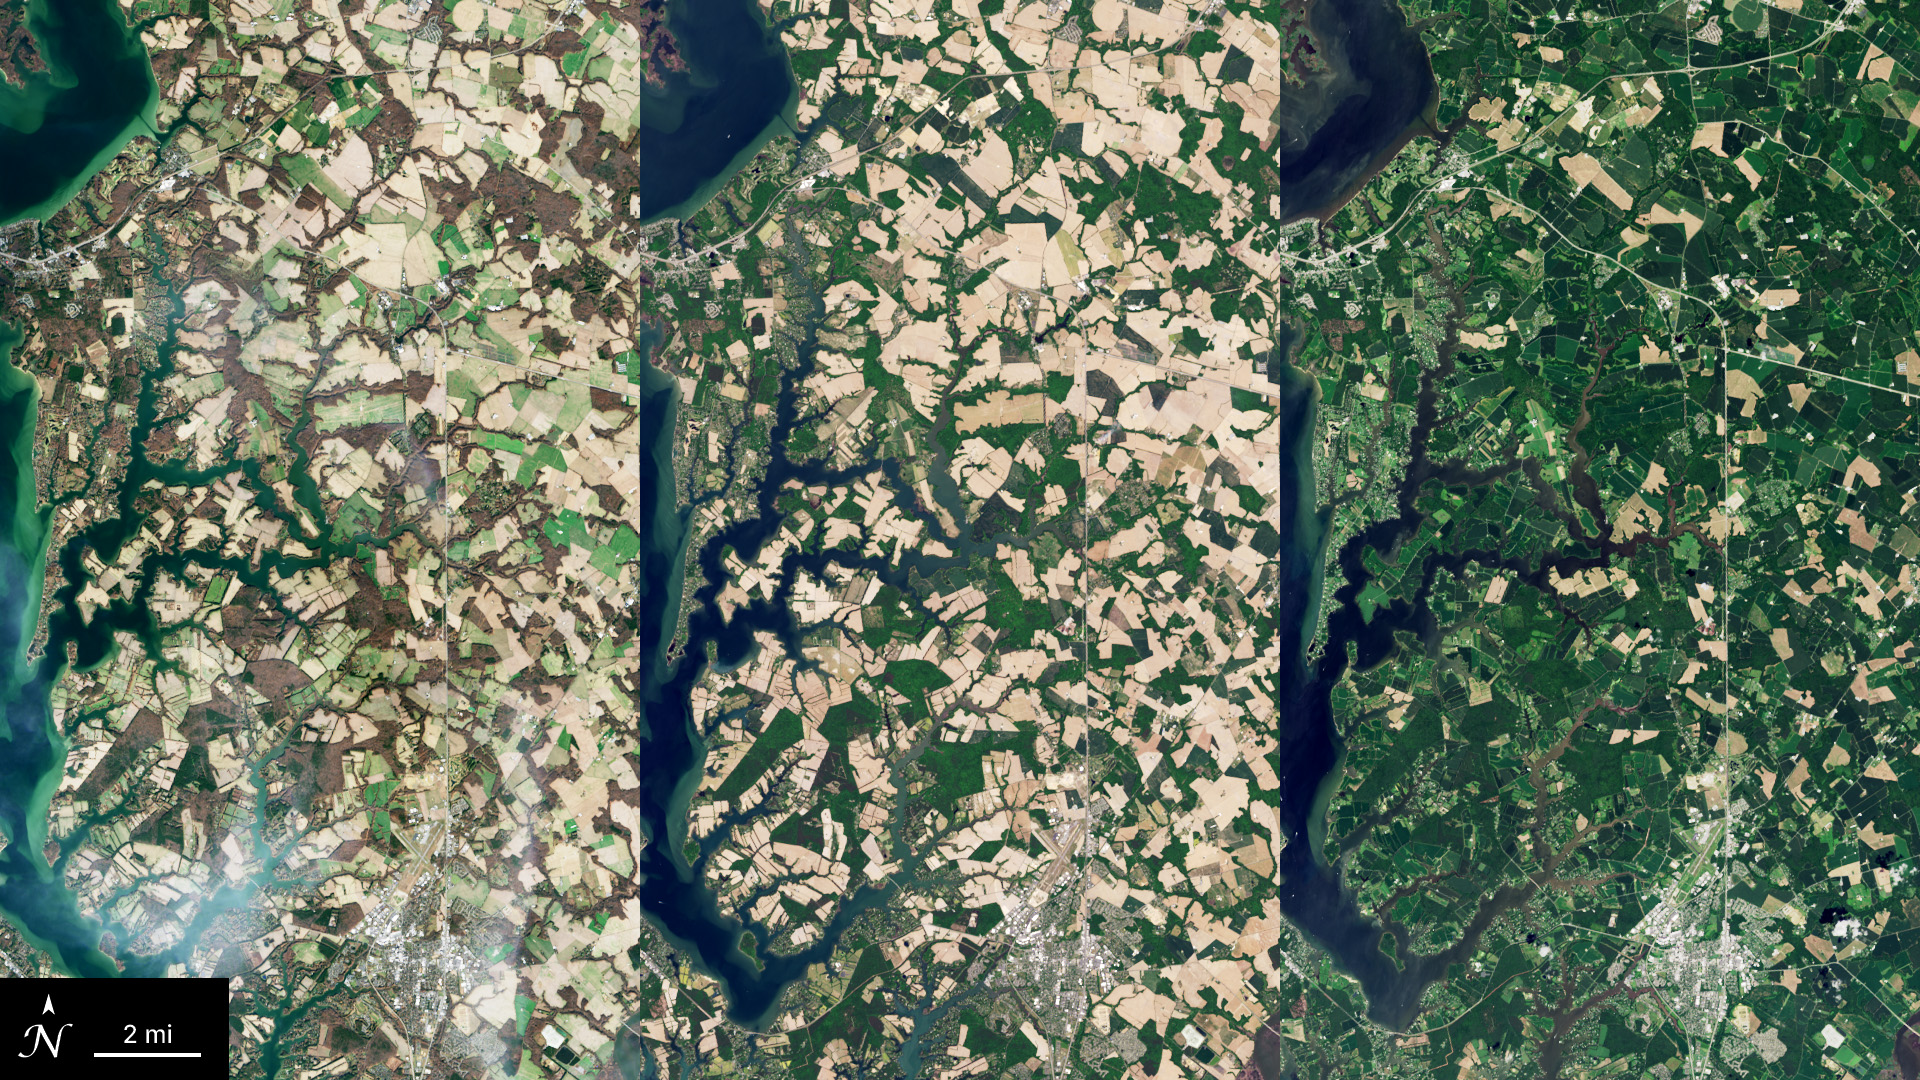
Researchers use NASA's Harmonized Landsat and Sentinel-2 (HLS) dataset, along with field observations and planting records, to capture the seasonal rhythm of agricultural fields. HLS combines imagery from NASA/USGS Landsat 8 and 9 and the European Space Agency's (ESA) Sentinel-2A, B, and C satellites to provide observations every 1.6 days (the global average revisit rate) — frequent enough to track small changes in the lifecycle of crops. For example, HLS enables a new, phenology-based algorithm to remotely detect winter cover crops — crops that significantly improve regional soil and water conservation — with 75 to 80% accuracy. Scientists, farmers, and water managers measure water consumption at the individual field level and fine-tune watering for specific plants using Landsat 9's thermal-infrared and optical data.
Additionally, agriculturalists have been able to maximize irrigation efficiency and support long-term sustainability across thousands of acres of vineyards using Landsat 9's thermal-infrared and optical data. These satellite observations also help researchers monitor the impacts of natural disasters on crops, such as floods and droughts, and shape broader tools supporting water management across the United States.
Disaster Management
The UN Office for Disaster Risk Reduction reports that, on any given day on Earth, an average of 1.15 natural disasters strike, with 350 to 500 significant natural disasters happening each year. And disasters are on the rise. Landsat 9 data are used to detect and monitor the impacts of natural disasters such as floods, droughts, fires, landslides, crop losses, storms, and volcanic eruptions.
To increase the survivability of these disasters, both land managers and disaster teams need fast, frequent, clear, reliable data about dynamic and long-term changes to our planet. From space, Landsat 9 gives us that picture in the form of near-real-time imaging. With Landsat 8 and 9 working in tandem, this drastically shortens the timeline between an event happening, assessing damage, and routing life-saving emergency responses to pinpointed locations. By providing critical before-and-after images, local authorities have the data they need for acute crises. These data are then used to build actionable frameworks for disaster management, specifically targeting prevention, zoning, and sensor-driven emergency responses. Using HLS data, users can track changes in vegetation across the globe at a 30-meter spatial resolution. By locating severe burn scars, land managers can predict and mitigate flash floods and mudslides before the rainy season hits.
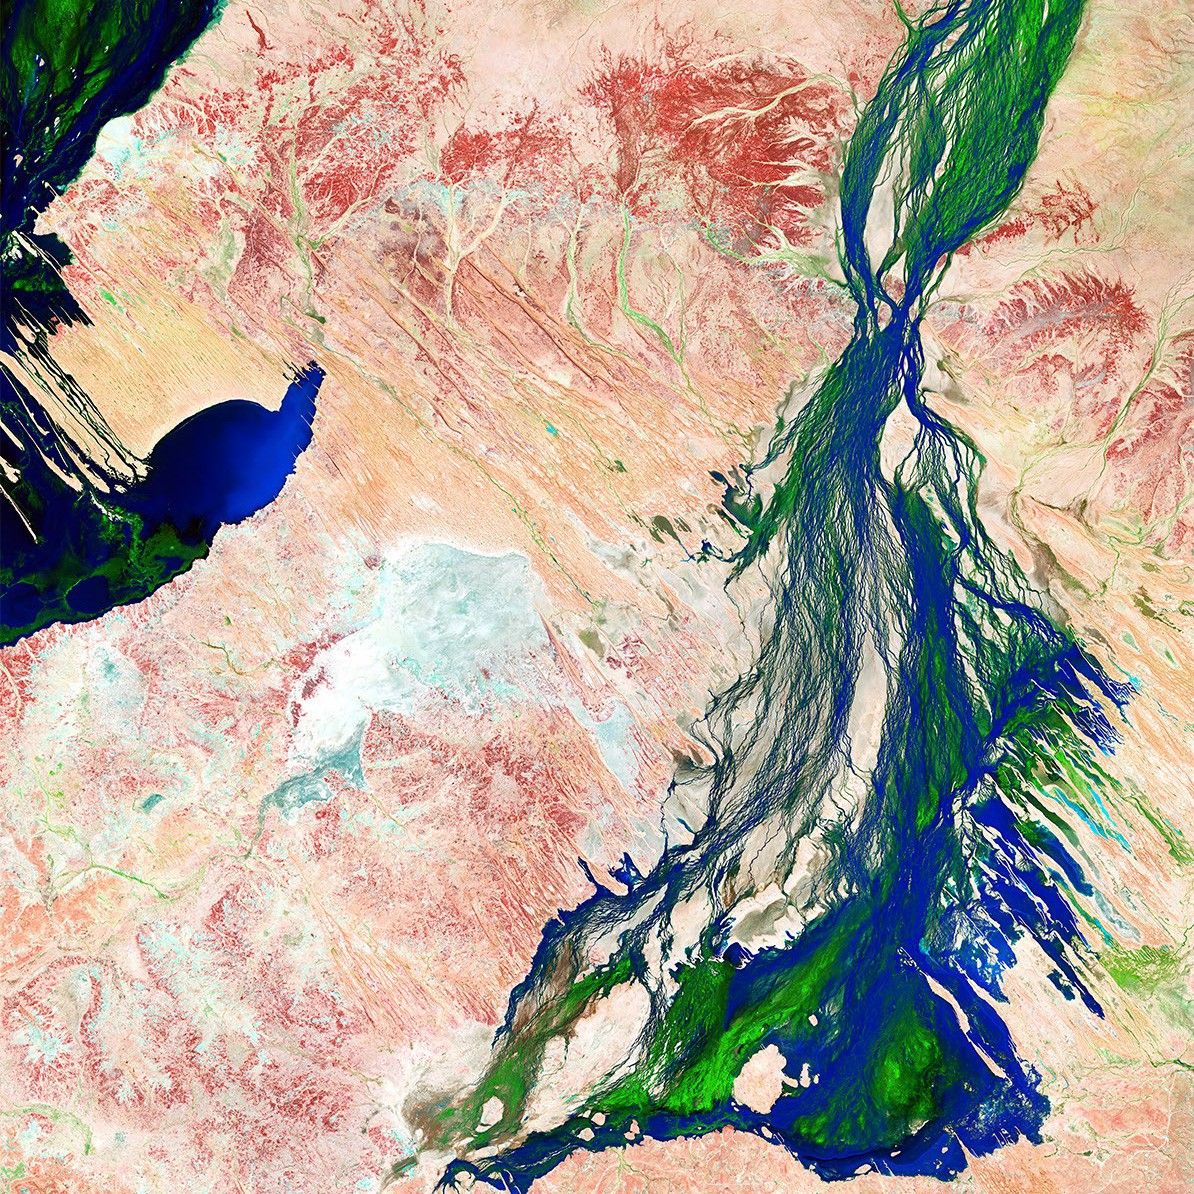
Landsat 9 supports mapping the extent of disasters and impassible road networks so that managers can deploy and safely route humanitarian aid. Its Thermal Infrared Sensor, TIRS, traces moving lava flows and locates new thermal vents, even when heavy volcanic gases obscure them from visibility, and at night, when there is no reflected sunlight to obscure subtle, low-level temperature variations. NASA's new vegetation dataset — the Observational Products for End-Users from Remote Sensing Analysis (OPERA) Land Surface Disturbance Alert (DIST-ALERT) — detects vegetation cover loss at 30-meter pixels every two to four days. This high temporal frequency provides greater sensitivity to both large magnitude/short duration (wildfires, floods, storm surges, landslides) and small magnitude/long duration land changes (droughts, land clearing). Using Landsat 9 data, managers have tracked flood susceptibility in Somalia's Juba–Shabelle river basin and in areas with poor drainage such as East Java.
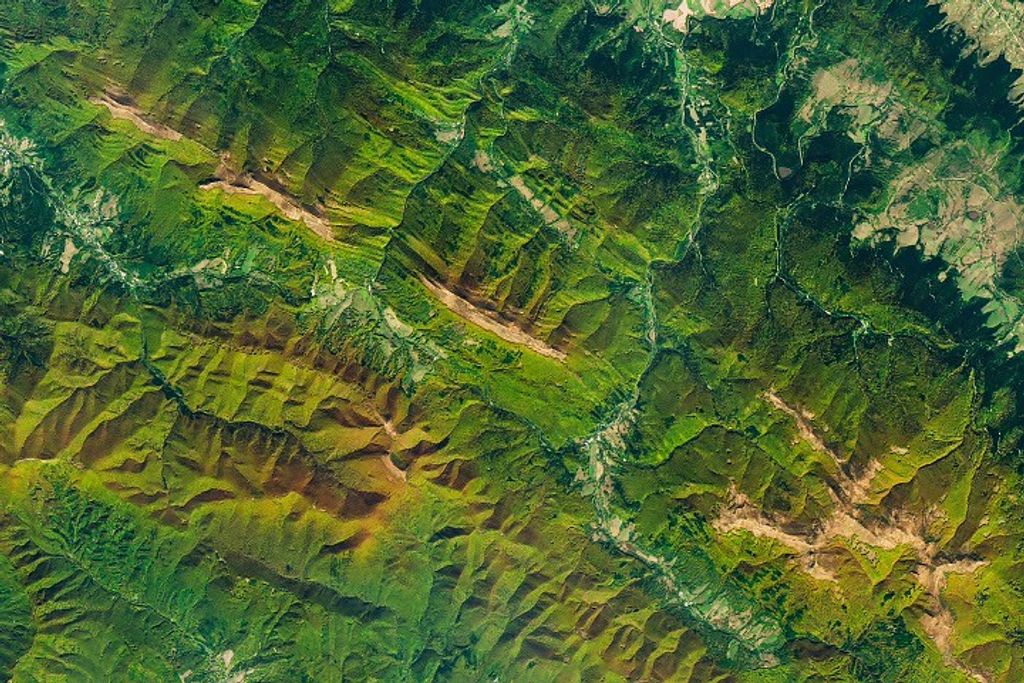
Landsat 9 also helps researchers track glacial meltwater increase and localized warming of moraines in remote, inaccessible mountain ridges, which helps predict and evacuate communities ahead of devastating and sudden floods. By modeling losses from hurricanes using Landsat observations, residents can better prepare when hurricanes threaten.
Forestry and Forest Management
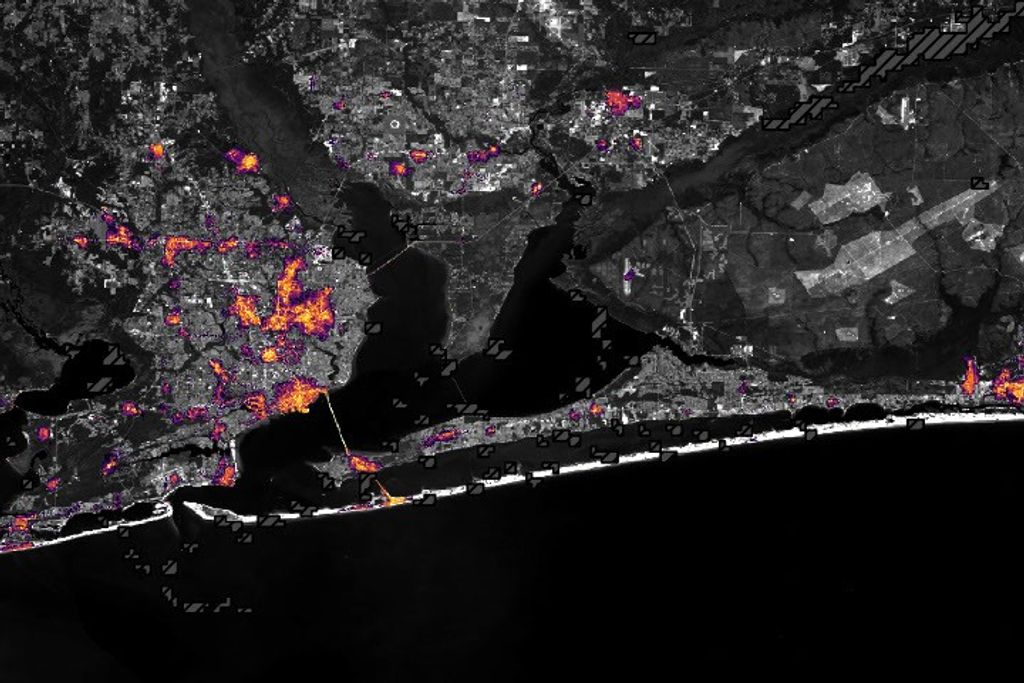
Forests across the globe are in flux: moving north, shrinking, burning, regrowing, or being replaced by agriculture. Researchers study these complex forest dynamics by combining Landsat 9’s multispectral data with Landsat 8 data and ICESat-2 laser altimetry. Together, these data capture the subtle variations in forest canopies and accurately map recent forest age and disturbances. In a recent study published in Nature, researchers combined Landsat and ICESat-2 data to model and estimate the potential carbon storage capacity of young boreal forests across the entire global taiga biome. Meanwhile, forest managers use NASA's high-resolution, near-real-time fire alert system — the Fire Information for Resource Management System (FIRMS) to track forests across the West. Landsat's Operational Land Imager (OLI) contributes the 30-meter, multispectral imagery layer to the FIRMS platform.
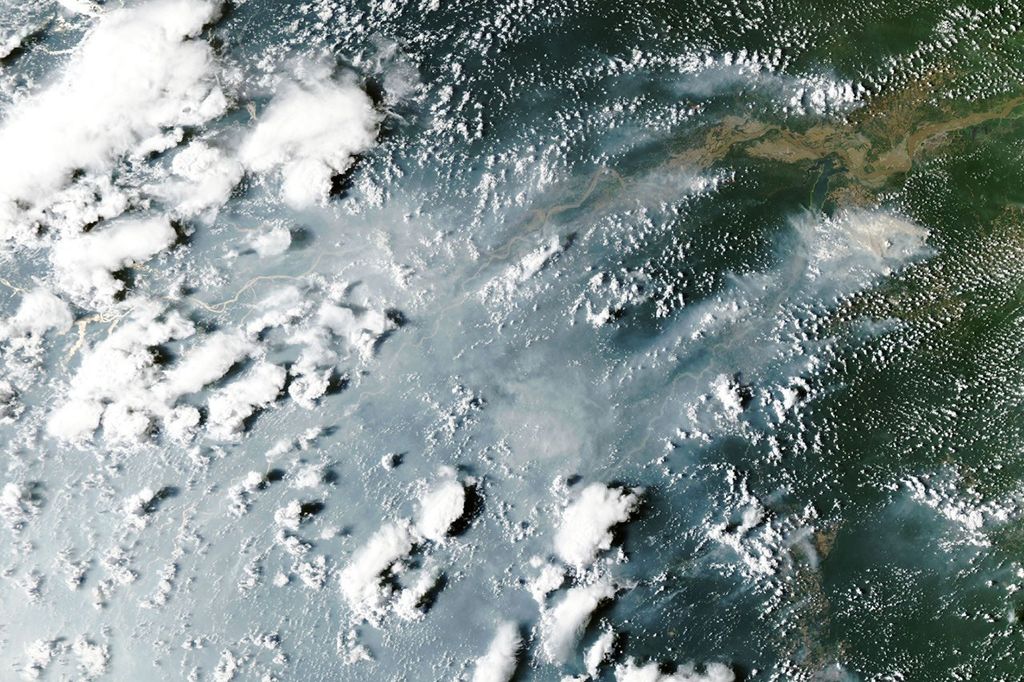
Beyond locating fires, Landsat 9 imagery provides context and characterization of fires: the vegetation, land cover, fire boundaries, burn scars, and landscape surrounding a hotspot. Understanding the footprint of a wildfire's smoke plume also provides crucial data that informs how agencies prepare for, respond to, and mitigate the public health and economic impacts of future wildfires. Landsat 9 was instrumental in analyzing the devastating 97,000-acre Cottonwood Fire that blazed through rugged terrain along Utah’s Beaver River in July-August 2026. Using the clear, multispectral, before-and-after imagery of the fire captured by the satellite, emergency management teams were able to map not only the full scale of the destruction from this month-long fire but also study the behavior and spread of its severe, widespread, hazardous smoke plume.
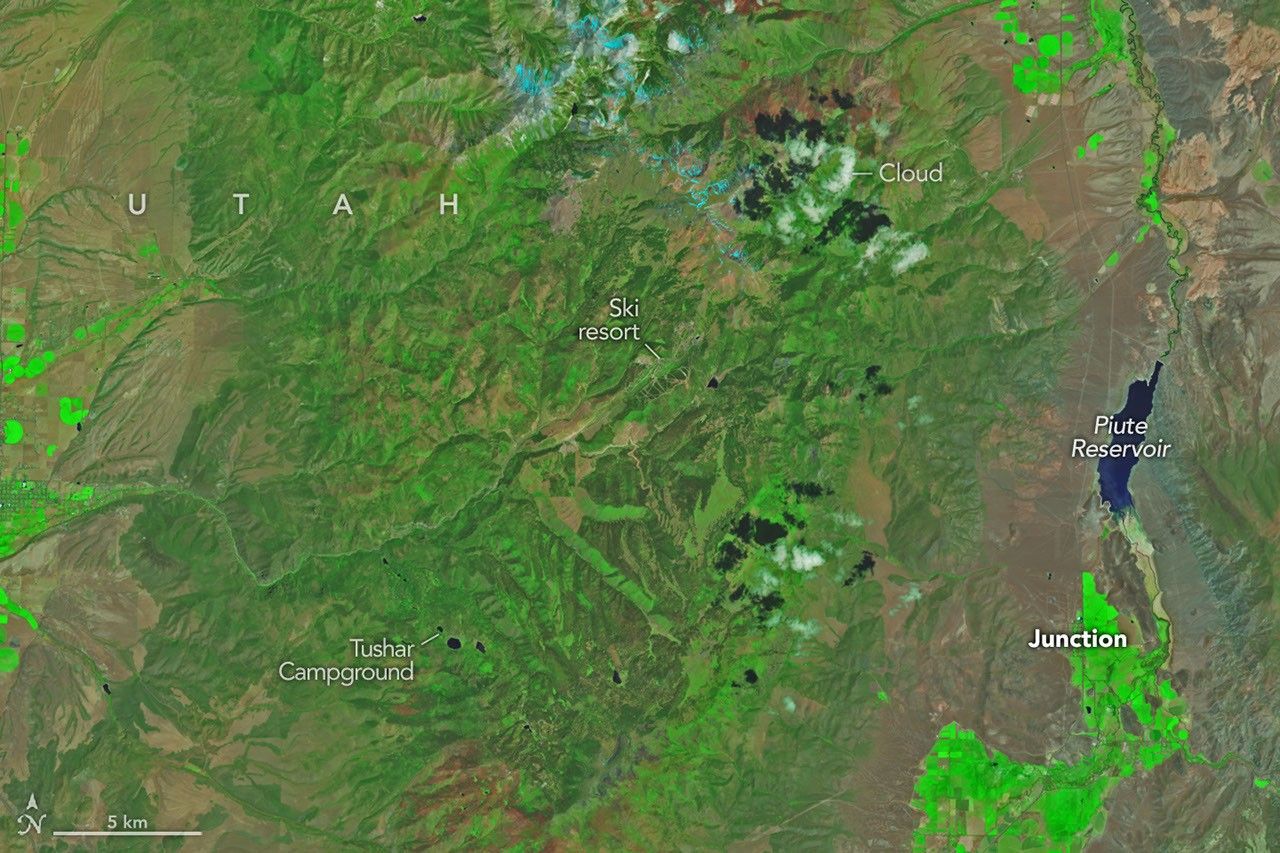
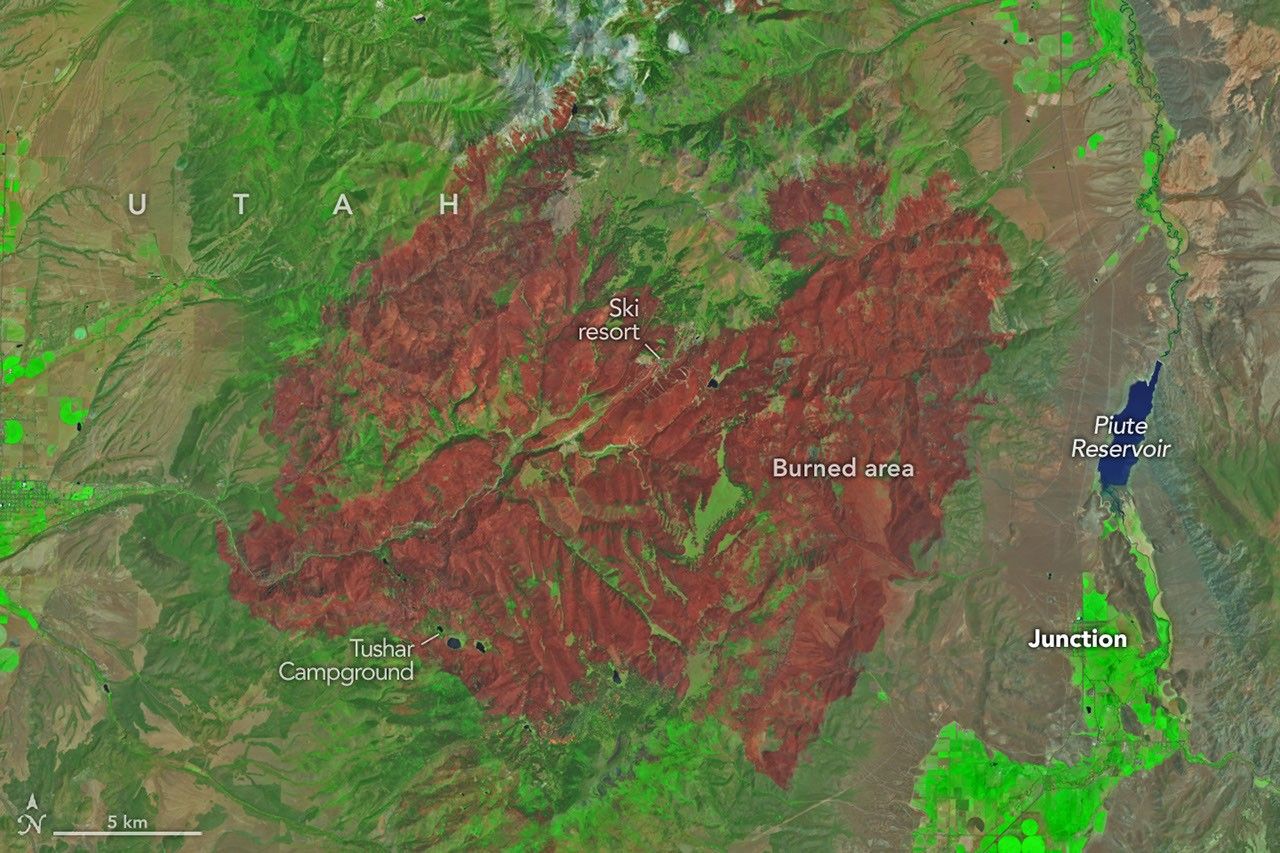
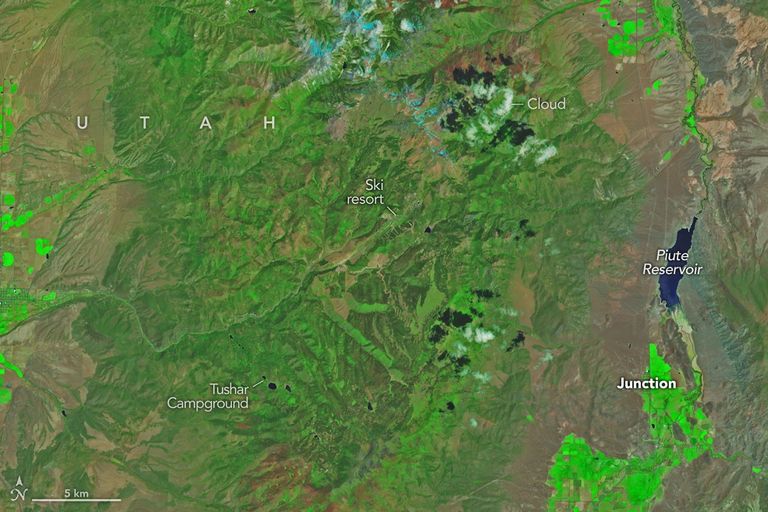
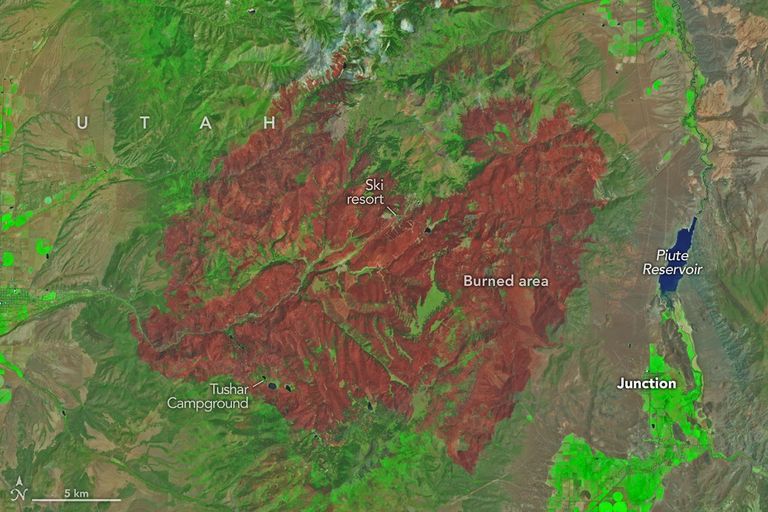
Cottonwood Fire Chars Utah
June 5, 2026 - June 29, 2026
Human Health
When lake temperatures rise and sunlight is abundant, strong wind can push an exponentially growing bloom of toxic, photosynthetic bacteria across a lake, piling it up like a thick mass of toxic soup to the shoreline. Wind-driven waves cause the water to churn, trapping air bubbles that pop and release tiny droplets of cytotoxins downwind. Inhaling these cytotoxins poses a significant risk to human health. With Landsat 9, water managers can get early warnings about harmful algal bloom (HAB) outbreaks from space. Landsat 9's OLI provides nine spectral bands that capture imagery of these photosynthetic bacteria and identify the distinct pigment signaling chlorophyll-a concentrations.
If the weather is calm, surface water can look deceptively clear during the dangerous die-off period, when there is a massive toxin release. Since HABs are highly volatile, they can spin up, peak, and begin collapsing in 2 to 7 days: these ephemeral blooms can go entirely undetected. NASA's Satellite-based Analysis Tool for Rapid Evaluation of Aquatic Environments (STREAM) tool also relies on the Landsat 8, Landsat 9, and Sentinel-2 constellation and a dedicated, optimized machine learning model for rapid, near real-time output of water quality maps. By using data collected at this increased frequency, investigators are able to capture transient water variations, and water quality managers are able to do the rapid-response tracking necessary for issuing timely public safety warnings and closures that protect human health.

Ice and Glaciers
Historically, Landsat measures heat during daylight hours. In early 2024, a new NASA/USGS nighttime imaging campaign began: Landsat Extended Acquisition of the Poles (LEAP). Under this program, instrument operators essentially “turn on” both satellites at polar twilight to monitor ice-covered areas towards the poles. Landsat’s TIRS instruments act like a heat map for polar regions. LEAP enables year-round observation of Antarctica, Greenland, Arctic sea ice, and polar ocean conditions.
Landsat 9’s upgraded OLI optical sensor is a four-fold increase in radiometric resolution compared to Landsat 8. The upgraded sensor can distinguish over 16,000 shades of a given wavelength of light, which allows scientists to discern more of the subtle changes in highly reflective surfaces like polar glaciers and ice sheets. The Landsat 8 and 9 constellation produces 1,500 scenes per day, which helps beat the persistent polar cloud cover problem, closes data gaps, enables more feature matching, and captures sudden events like ice calving, catastrophic lake drainages, and permafrost collapses during the short, intense polar melt seasons.
Landsat 9: The Workhorse
For the past five years, Landsat 9 has been tireless. Encircling Earth every 99 minutes and orbiting more than 14 times per day, Landsat captures rich images and critical data of the growth of cities, crops, glacial lakes, forests, wildfires, storms, and hurricanes — changes that impact entire regions and ecosystems. Landsat data also show us things that wane: glaciers receding, native grasslands shrinking, and rivers drying up. The satellite's captured data are used to inform key actions on the ground that benefit humans and ecosystems.
To NASA's Landsat 9 Project Scientist Christopher Neigh, the success of the mission is defined by its data — and the satellite's delivery of high-quality, science-grade information about land surfaces and near coastal waters while maintaining continuity of the record of Earth's surface. Neigh observed that free and open data access, plus cloud computing, has brought us into the global survey, environmental scientific analysis of monitoring at the human scale of a baseball diamond. Now, anyone with an SI assistant and cloud account can process Landsat 9 data to derive insights.
When asked about notable science results made possible with Landsat 9 data, Neigh responded that there are too many application areas for a concise summary. Considering the fact that Landsat 8 and 9 are twins, most of the notable impacts to science leverage the enhanced global revisit survey capabilities of both missions to capture 1,500 images per day, the equivalent size of the Eurasia landmass. With this revisit rate and coverage, Landsat 9 has opened new scientific windows of discovery to understand our dynamic planet. For example, we can now understand and quantify the seasonal rates of ice flow globally, we can distinguish rates of water use in agriculture and forested ecosystems.
Describing the impact of the satellite's contribution to the cumulative Landsat program's data record, Neigh emphasized that "Landsat 9 has been a workhorse. It's had minimal anomalies and downtime, routinely collecting over 750 images per day with science-quality, 14-bit radiometry. Landsat 9 engineers worked with scientists to resolve problems that emerged with Landsat 8. These revisions empowered Landsat 9 to be the workhorse it is today and will hopefully continue to be until Landsat 10 joins it in orbit." Key lessons learned from Landsat 9 will inform Landsat 10's performance improvements to serve growing user needs – such as additional bands and increased spatial and radiometric resolution.
"Landsat 9 leverages a workforce and technical innovations that NASA excels at providing," Neigh said. "These data are an invaluable resource, providing critical information about our home planet so we can manage, live, and thrive with the limited resources that exist here."
Landsat 9 - More Than Just A Picture
For over 50 years, the Landsat program has provided the longest continuous satellite record of Earth's land surface from space. Landsat 9, launched in 2021, is the latest mission in this remarkable legacy — building on decades of Earth observation with upgraded technology, including enhanced radiometric resolution, improved signal-to-noise performance, and polar night thermal imaging.
Explore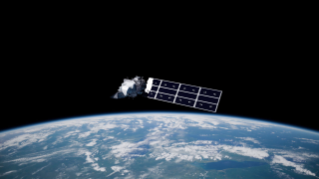

Related Resources
- Landsat 9 Mission Page
- Landsat Societal Benefits
- NASA Earthdata – Landsat 9 Overview
- Access Landsat 9 Data: USGS EarthExplorer
- USGS Landsat Data Access Portal
- USGS Landsat 9 Science Products page
- Landsat 9 Data Release
- Landsat 9 – More Than Just a Picture