


1 min read
Comparison of Normal Matter and Dark Matter’s Large Scale Structure
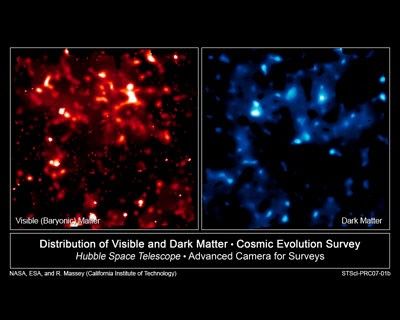
These two false-color images compare the distribution of normal matter (red, left) with dark matter (blue, right) in the universe. The brightness of clumps corresponds to the density of mass. The map covers an area of sky nine times the angular diameter of the full Moon, and is the largest sample of the distribution of dark matter ever obtained. It demonstrates how normal matter - including stars, galaxies and gas - is built inside an underlying scaffolding of dark matter. The comparison of dark matter and normal matter will provide critical observational underpinnings to future theories for how structure formed in the evolving universe under the relentless pull of gravity.
Dark matter is an invisible form of matter comprising the bulk of the universe's mass. Because the dark matter can't be seen directly, its distribution on the sky is measured via weak gravitational lensing. This is the distortion of light from distant galaxies (rather like the effect of a funhouse mirror), due to the gravitational warping of space by dark matter along our line of sight. Hubble Space Telescope's keen ability to measure these distortions allowed this map to be created with fine resolution. Constructing the entire map required the measurement of the shapes of half a million background galaxies.
The map was derived from Hubble Space Telescope's largest ever survey of the universe, the Cosmic Evolution Survey ("COSMOS") with an international team of 70 astronomers. In making the COSMOS survey, Hubble photographed 575 adjacent and slightly overlapping views of the universe using the Advanced Camera for Surveys' (ACS) Wide Field Camera onboard Hubble. It took nearly 1,000 hours of observations. The distances to the galaxies were determined from their spectral redshifts, using the Subaru telescope in Hawaii. The distribution of additional gas outside galaxies was measured with the European Space Agency's XMM/Newton telescope.
About the Object
- R.A. PositionR.A. PositionRight ascension – analogous to longitude – is one component of an object's position.10h 0m 28.6s
- Dec. PositionDec. PositionDeclination – analogous to latitude – is one component of an object's position.02° 12' 21.0"
- ConstellationConstellationOne of 88 recognized regions of the celestial sphere in which the object appears.Sextans
About the Data
- Data DescriptionData DescriptionProposal: A description of the observations, their scientific justification, and the links to the data available in the science archive.
Science Team: The astronomers who planned the observations and analyzed the data. "PI" refers to the Principal Investigator. - InstrumentInstrumentThe science instrument used to produce the data.HST>ACS/WFC, Subaru>Suprime-Cam, VLT>VIMOS, and XMM/Newton>EPIC
- Object NameObject NameA name or catalog number that astronomers use to identify an astronomical object.Cosmological Evolution Survey Field, COSMOS Field
- Object DescriptionObject DescriptionThe type of astronomical object.Visible and Dark Matter Distribution Map, Astronomical Survey
- Release DateJanuary 7, 2007
- Science ReleaseHubble Maps the Cosmic Web of “Clumpy” Dark Matter in 3-D
- Credit
Related Images & Videos
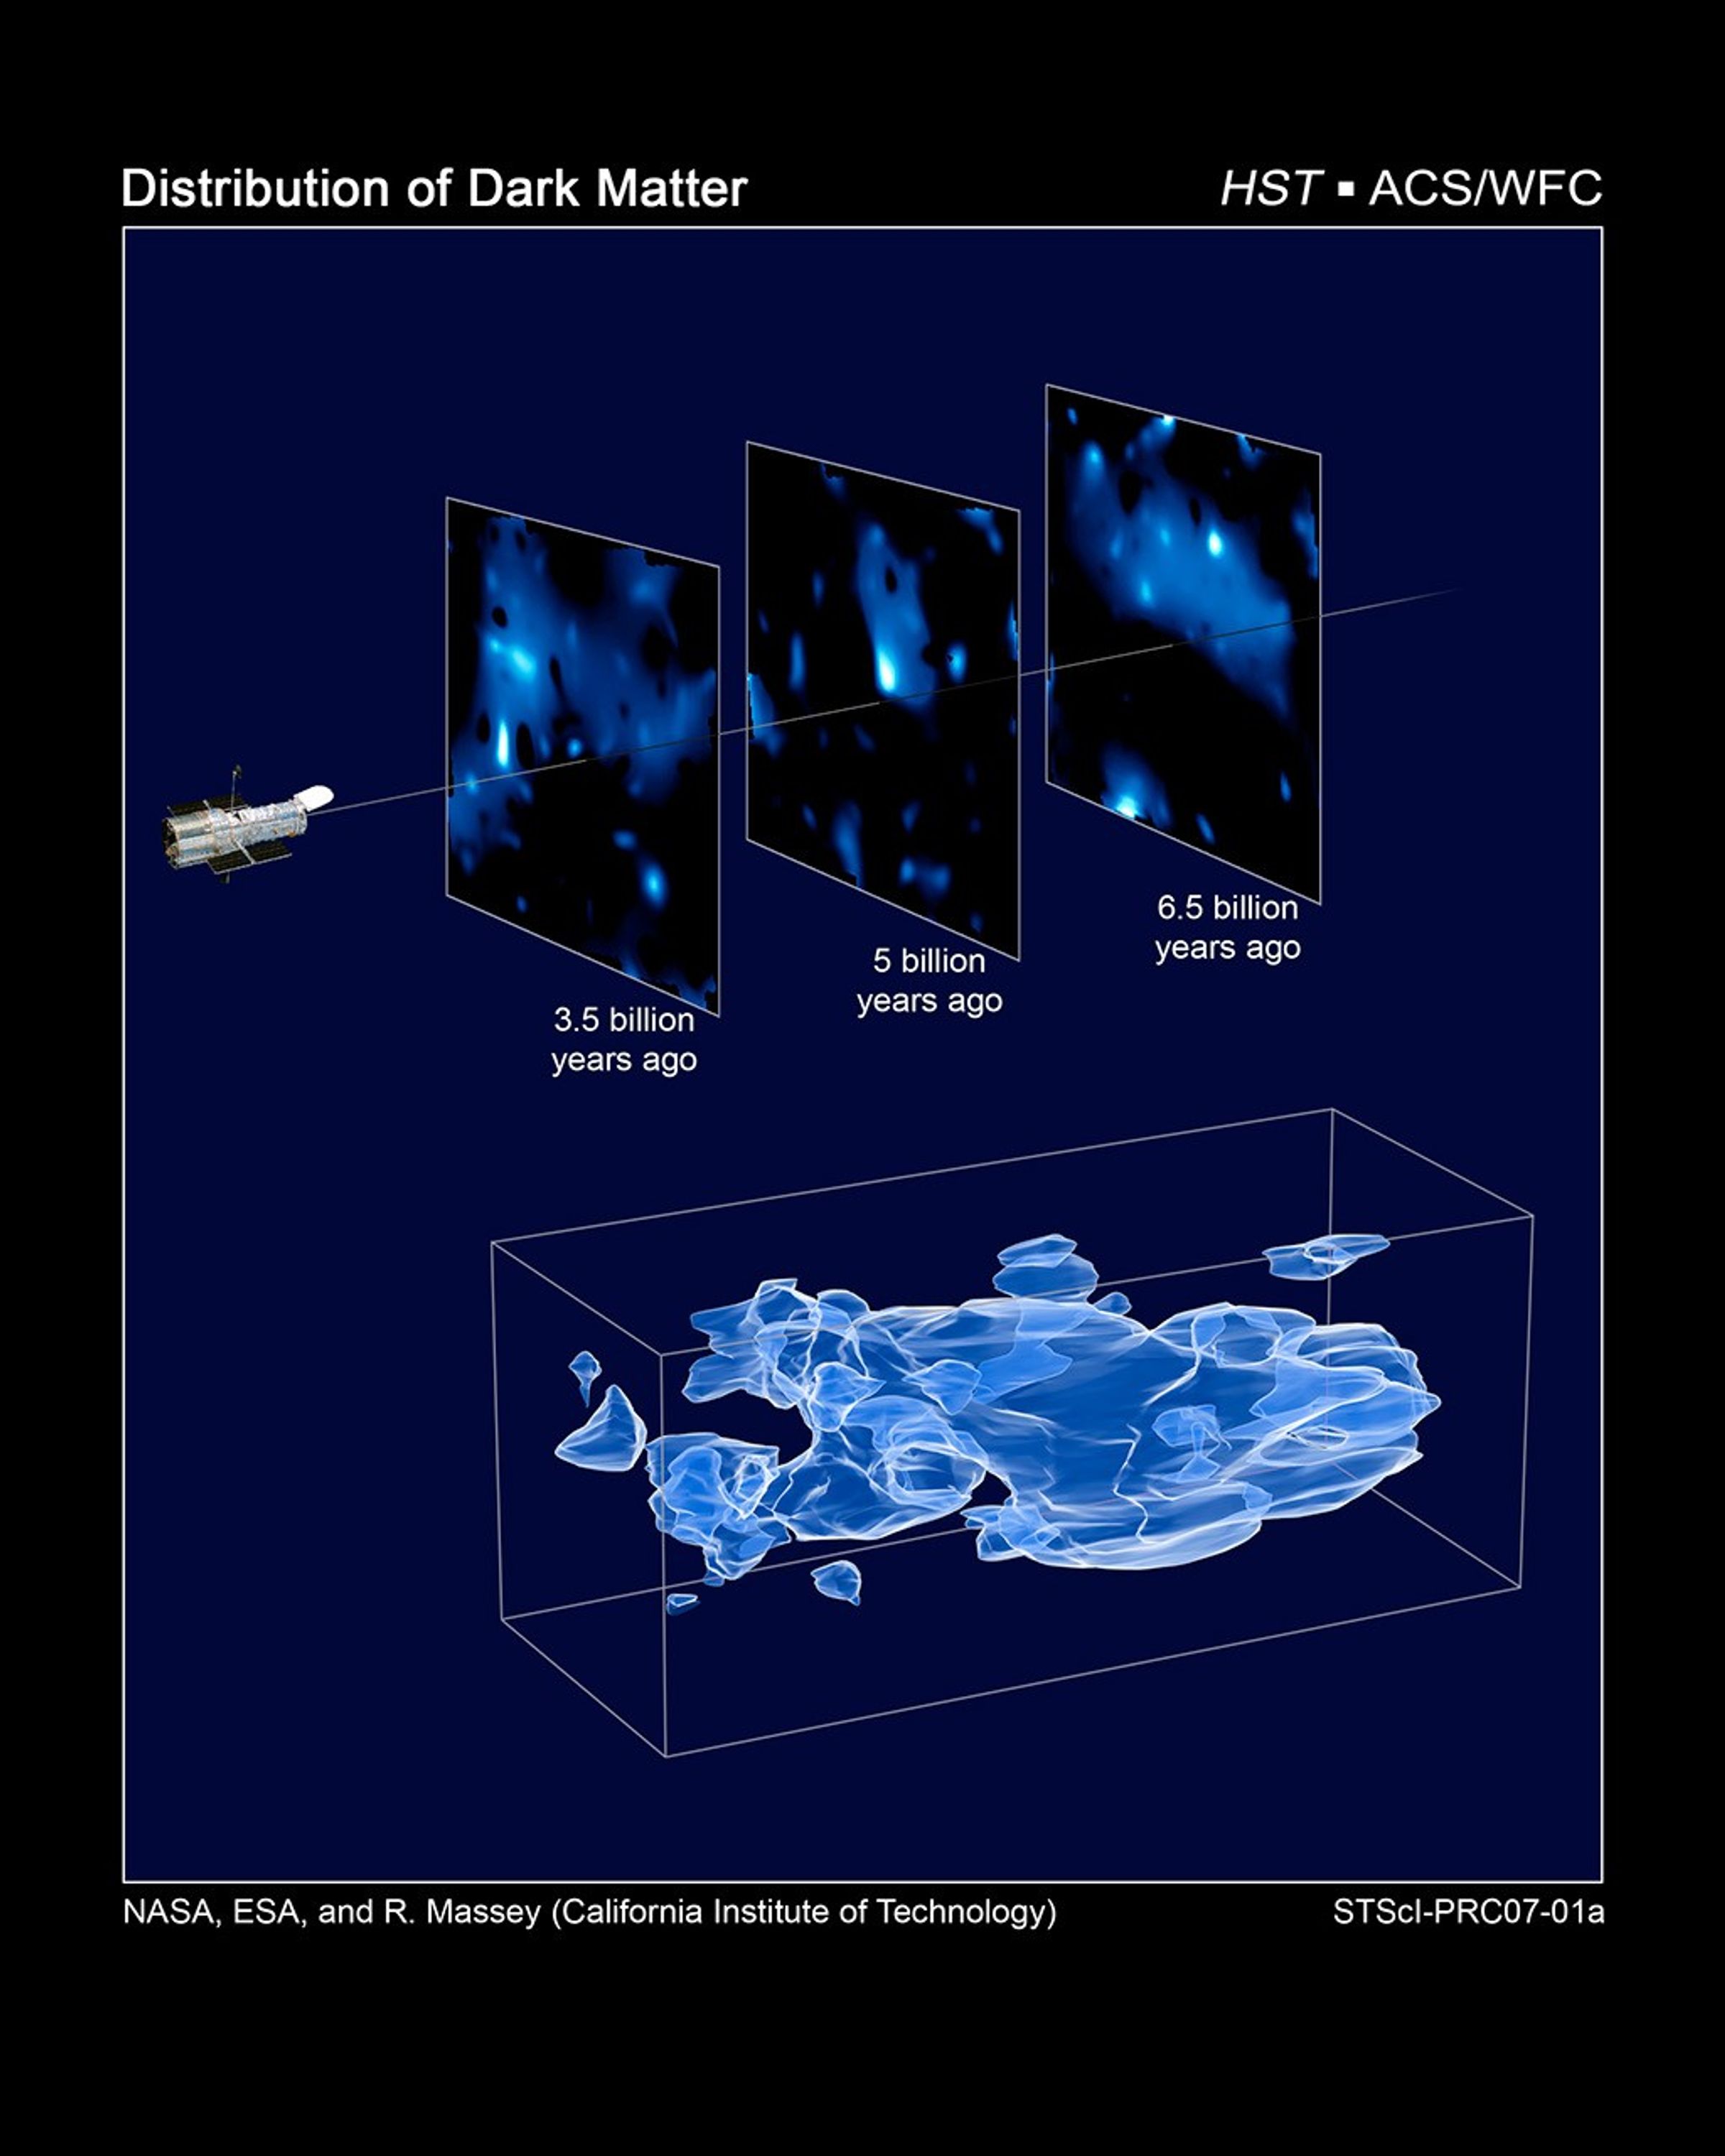
Three-Dimensional Distribution of Dark Matter in the Universe (with 3 slices of time)
This three-dimensional map offers a first look at the web-like large-scale distribution of dark matter, an invisible form of matter that accounts for most of the universe's mass. This milestone takes astronomers from inference to direct observation of dark matter's influence in...


COSMOS Field Compared to Other Hubble Surveys
Hubble Space Telescope has a narrow field of view, which is only a fraction of the angular diameter of the Moon. Certain research programs have devoted a substantial amount of Hubble observing time to survey comparatively larger areas of sky to address a wide range of galaxy...

Full Resolution Image Single HST ACS COSMOS Tile
This image covers one of 49 COSMOS tiles. It is created from ACS infrared data as well as Subaru broadband data. This tile is roughly 10 arcminutes in size. It is one-third of the full resolution COSMOS tiles. The Subaru image is courtesy of P. Capak and R. Massey (Caltech).
Share
Details
Claire Andreoli
NASA’s Goddard Space Flight Center
Greenbelt, Maryland
claire.andreoli@nasa.gov