1 min read
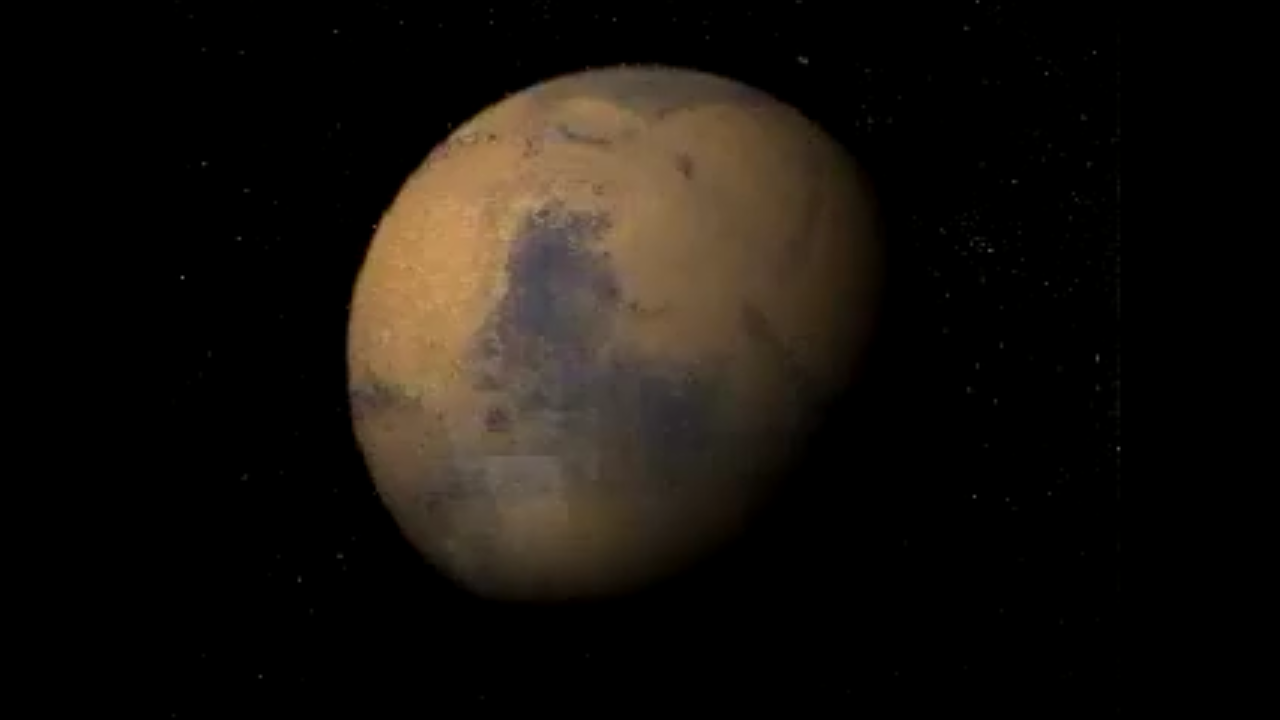
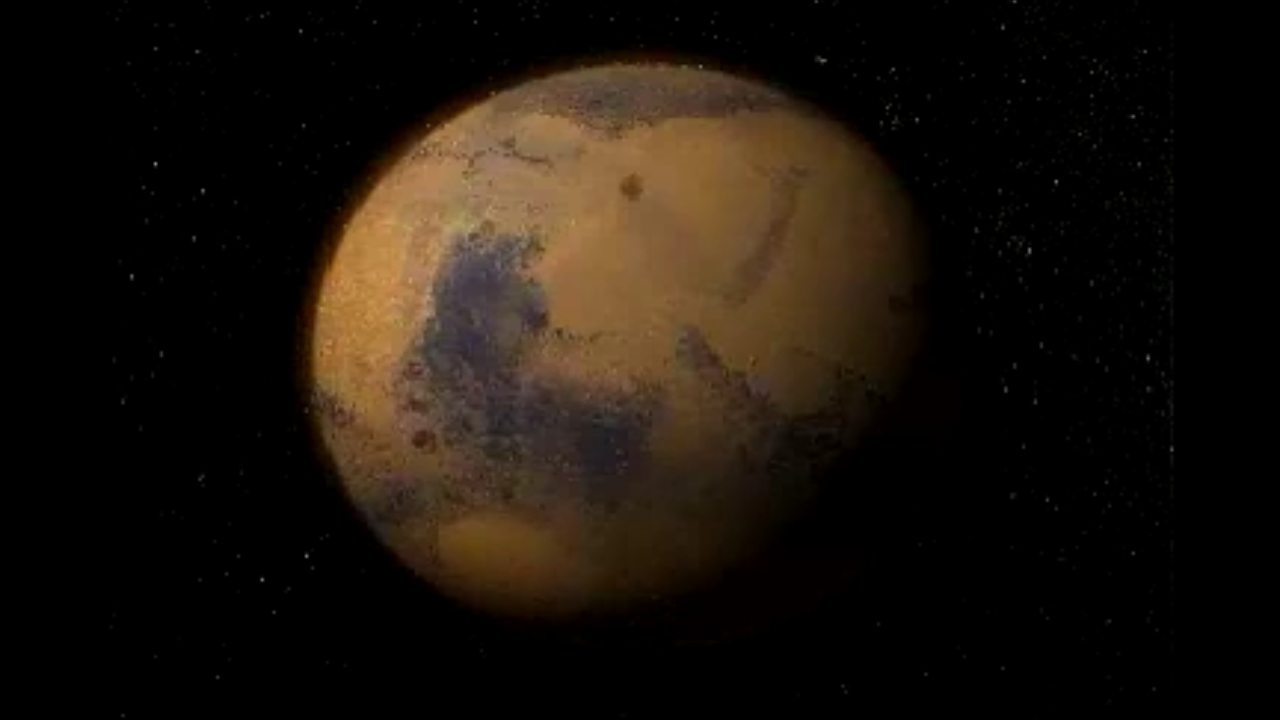
Animation from the Thermal Emission Spectrograph (10 frames per second )
- Release DateOctober 11, 2001
- Science ReleaseScientists Track “Perfect Storm” on Mars
- CreditPhilip Christensen (Arizona State University) and the TES Team
Related Images & Videos
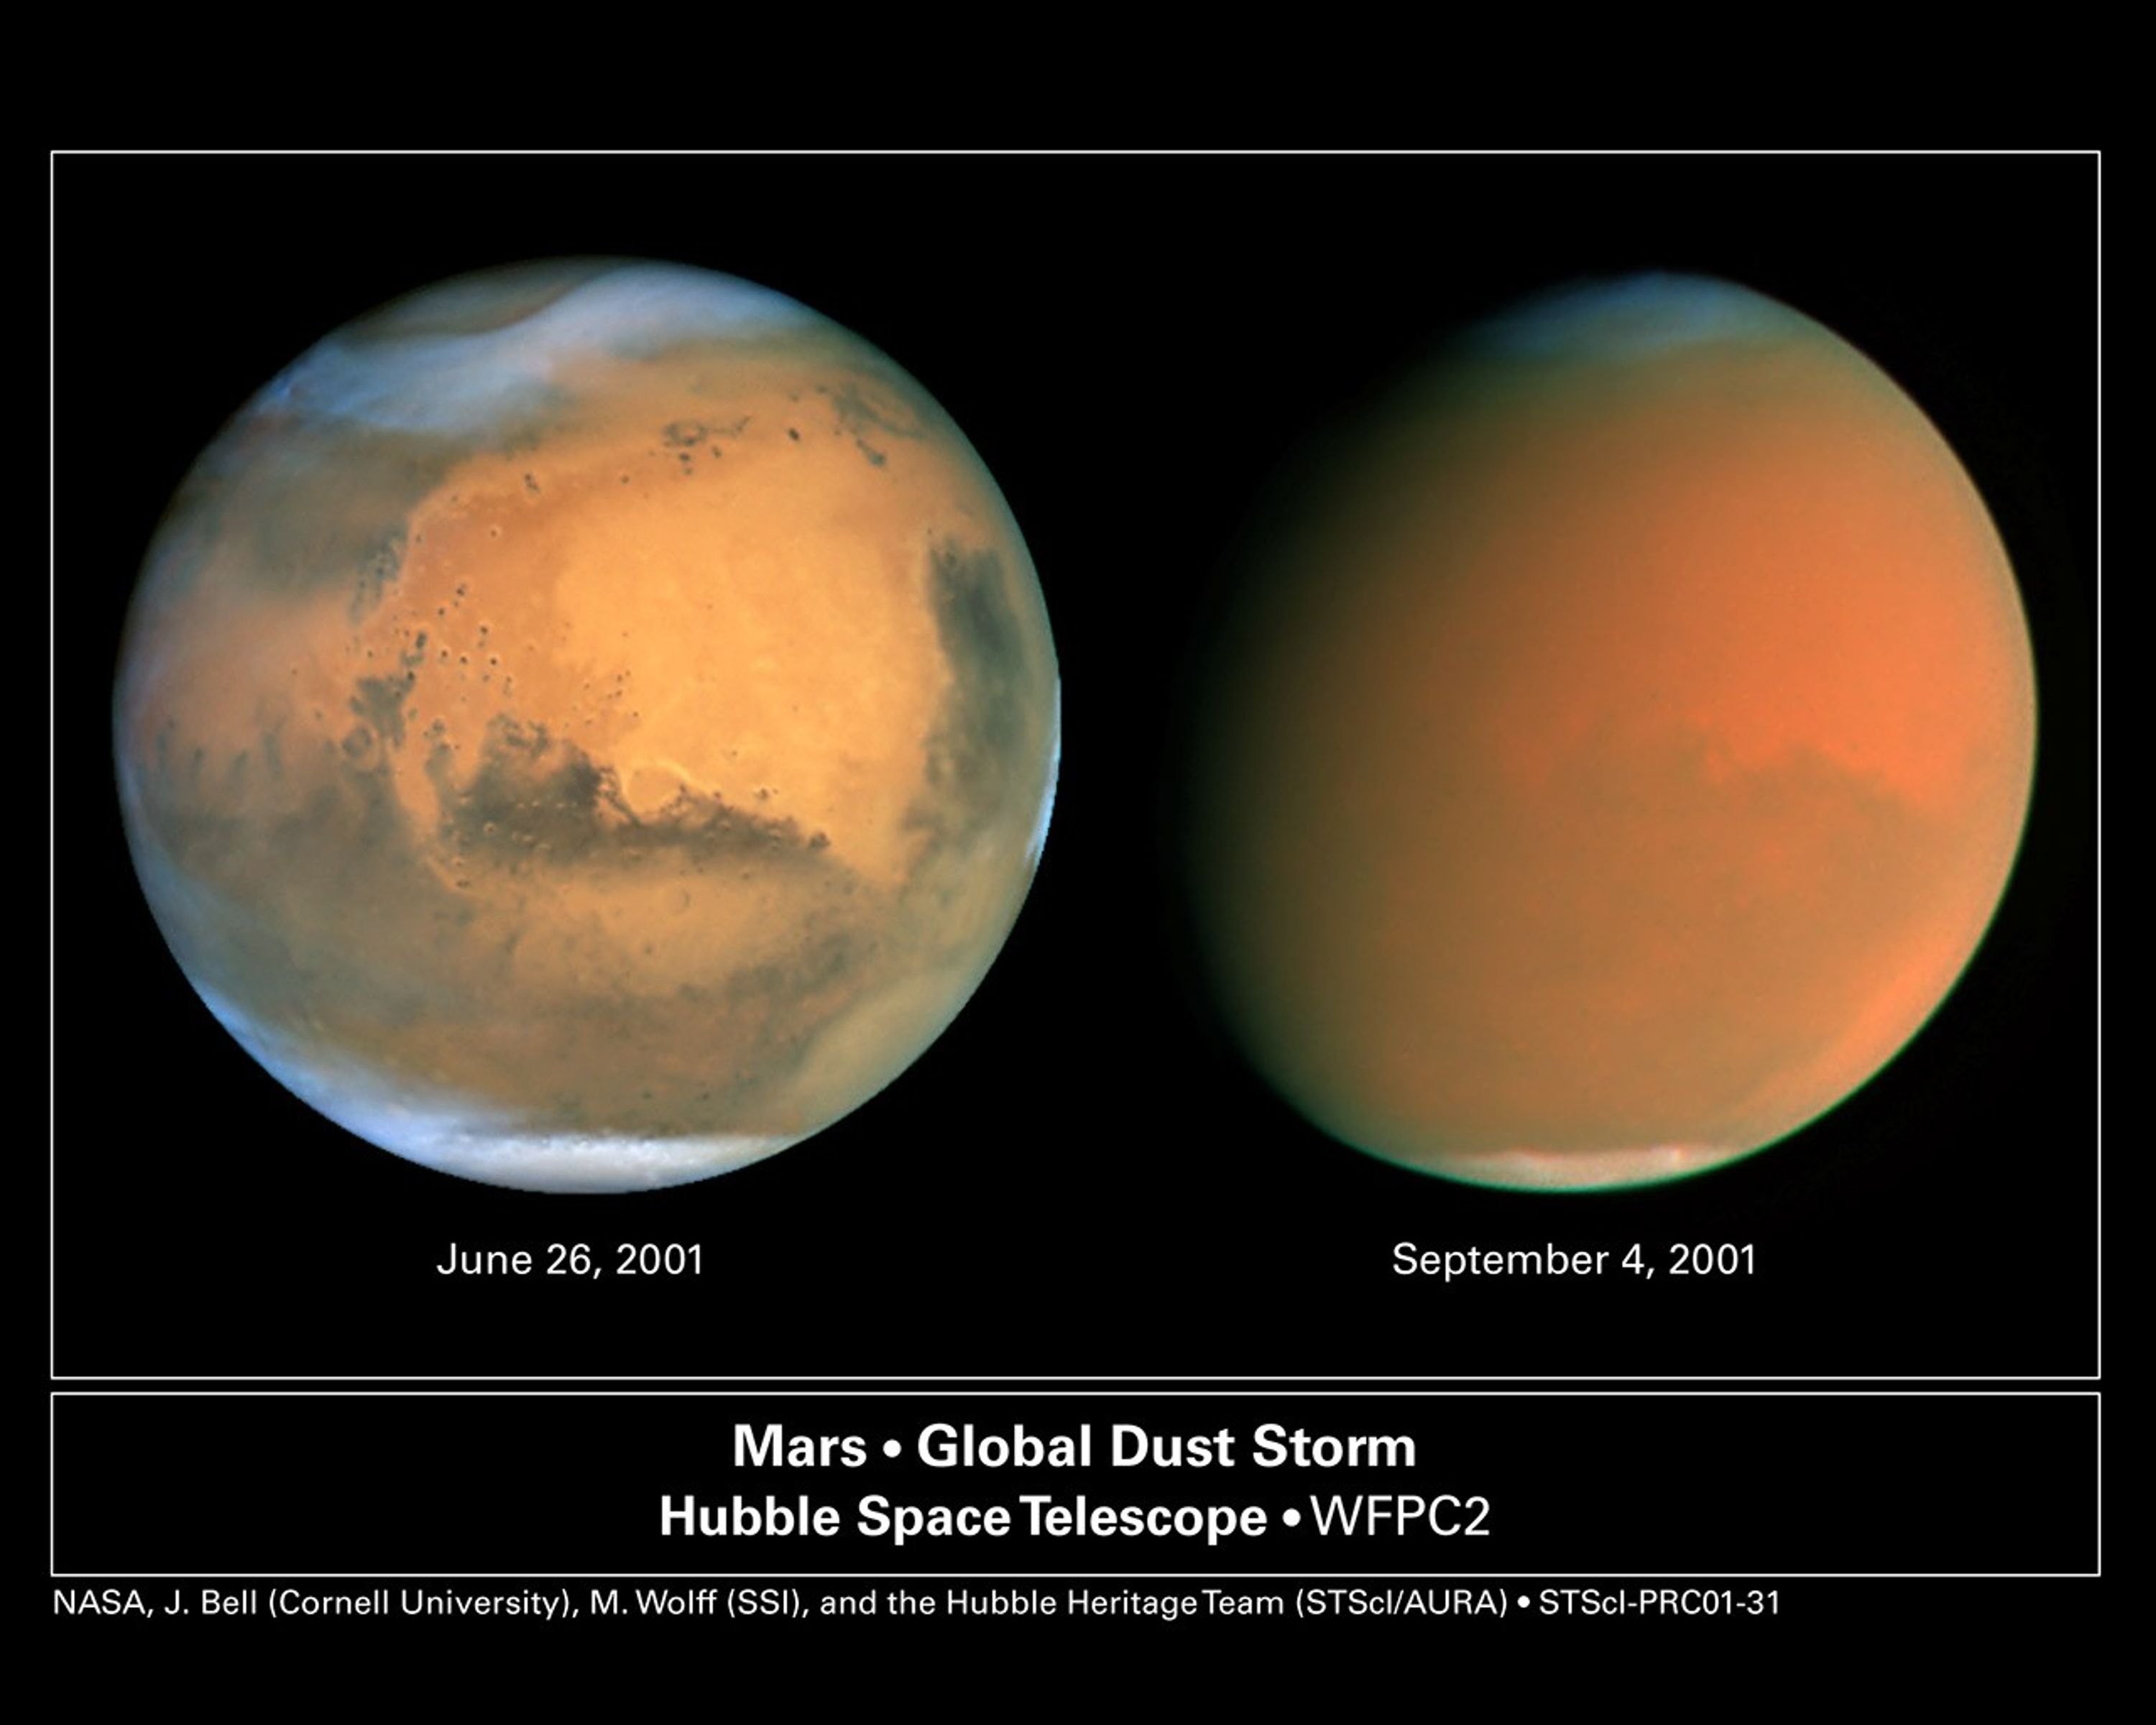
Scientists Track "Perfect Storm" on Mars
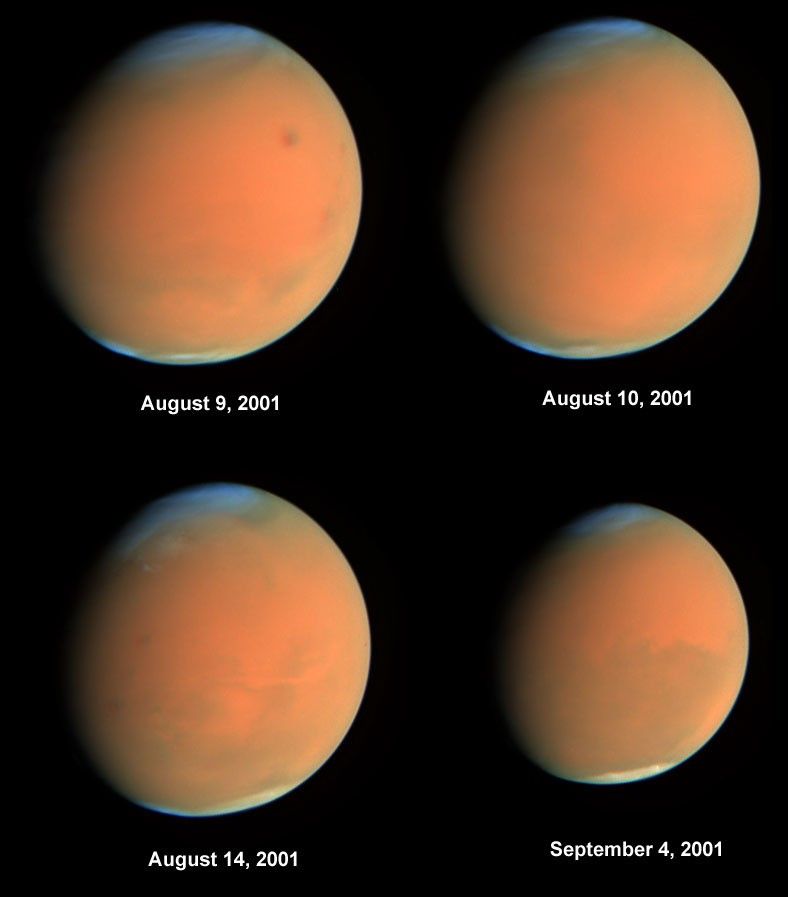
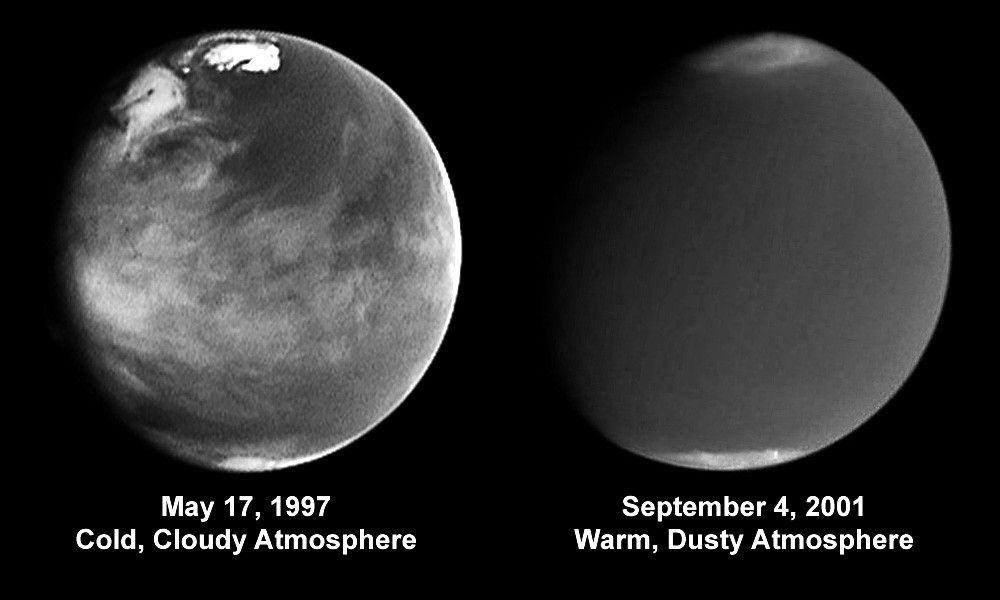
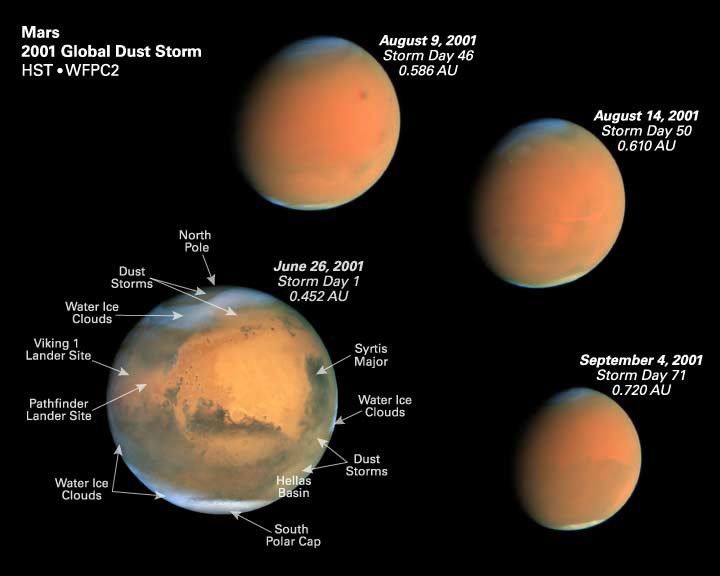
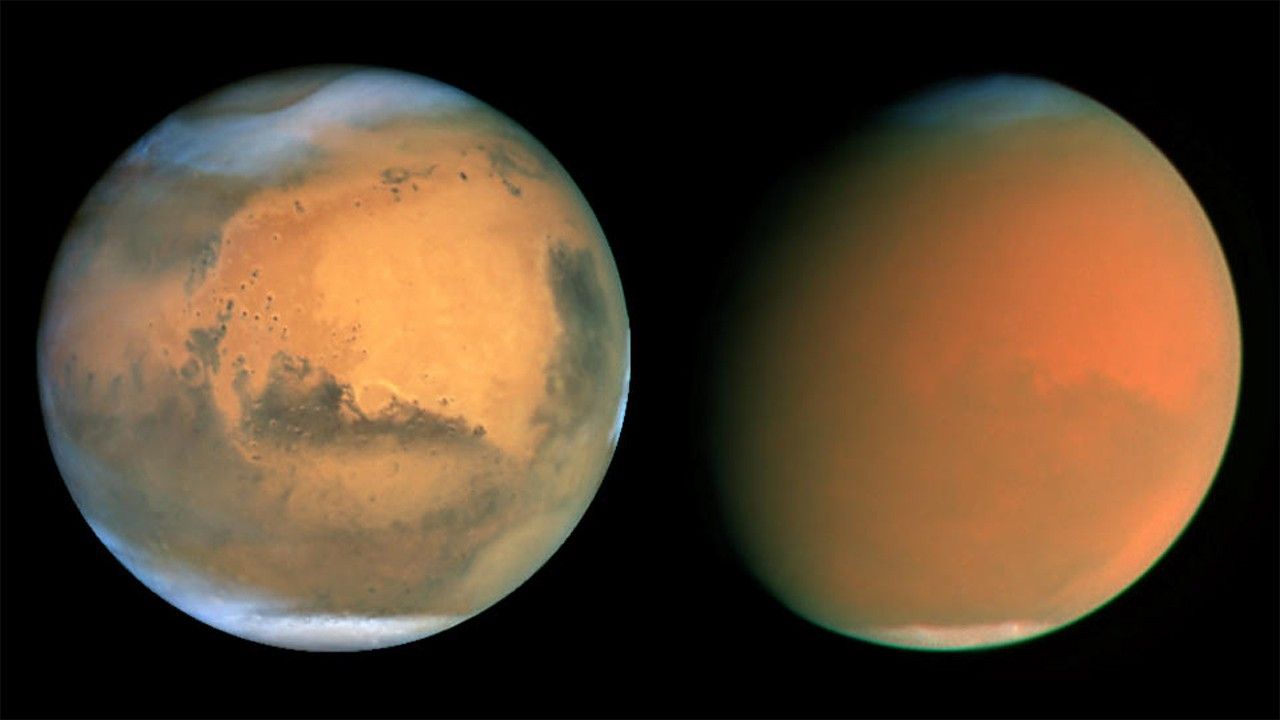
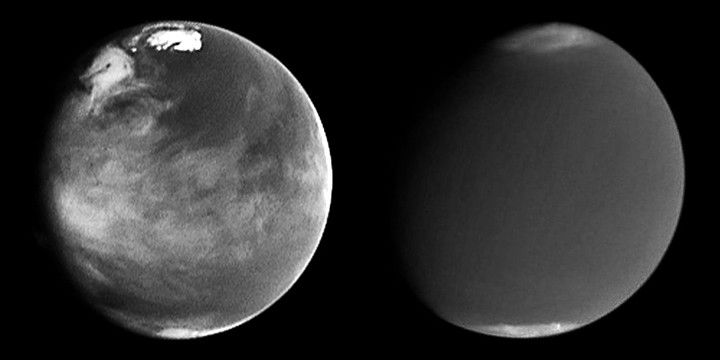
Two dramatically different faces of our Red Planet neighbor appear in these comparison images showing how a global dust storm engulfed Mars with the onset of Martian spring in the Southern Hemisphere. When NASA's Hubble Space Telescope imaged Mars in June, the seeds of the storm...
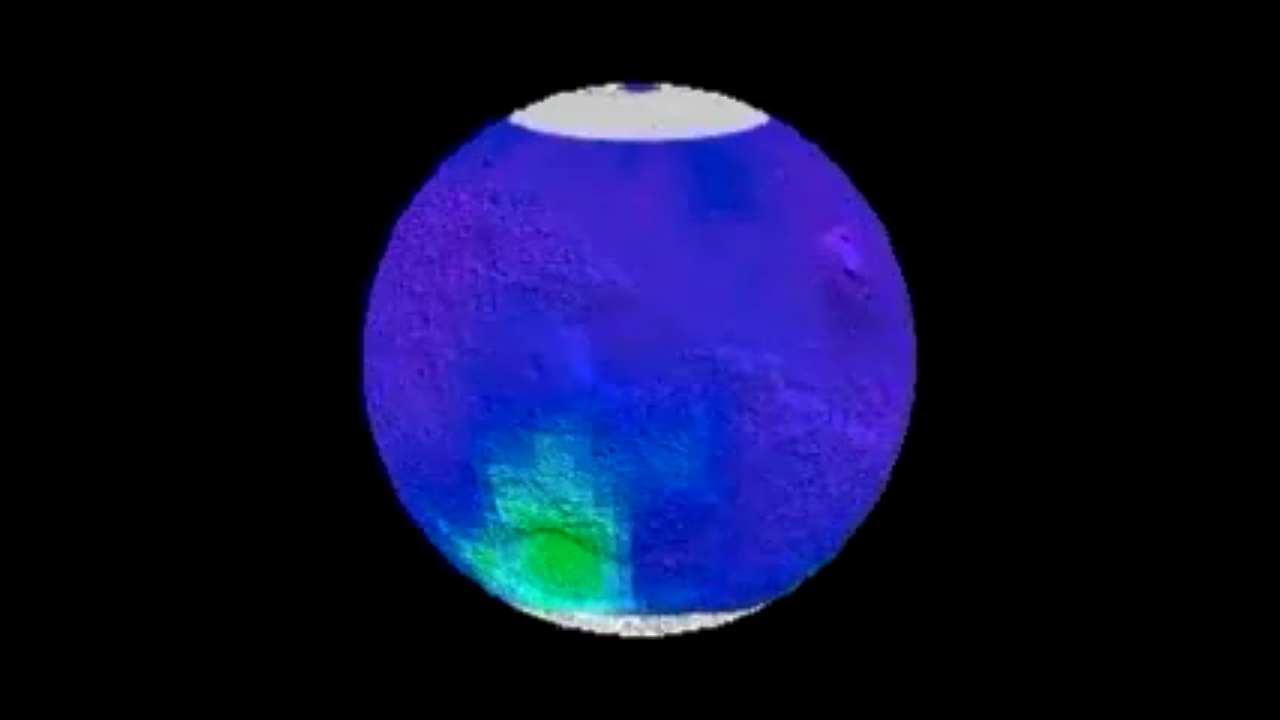
Animation from the Thermal Emission Spectrograph (6 frames per second )
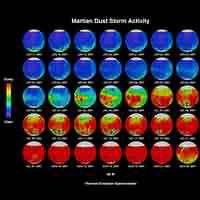
Beginning with clear skies (represented by blue), the storm gathers in size and intensity. This animation represents atmospheric data from the Mars Global Surveyor's Thermal Emission Spectrograph. As the dust clouds grow thicker, they absorb more warmth from the sun and raising...
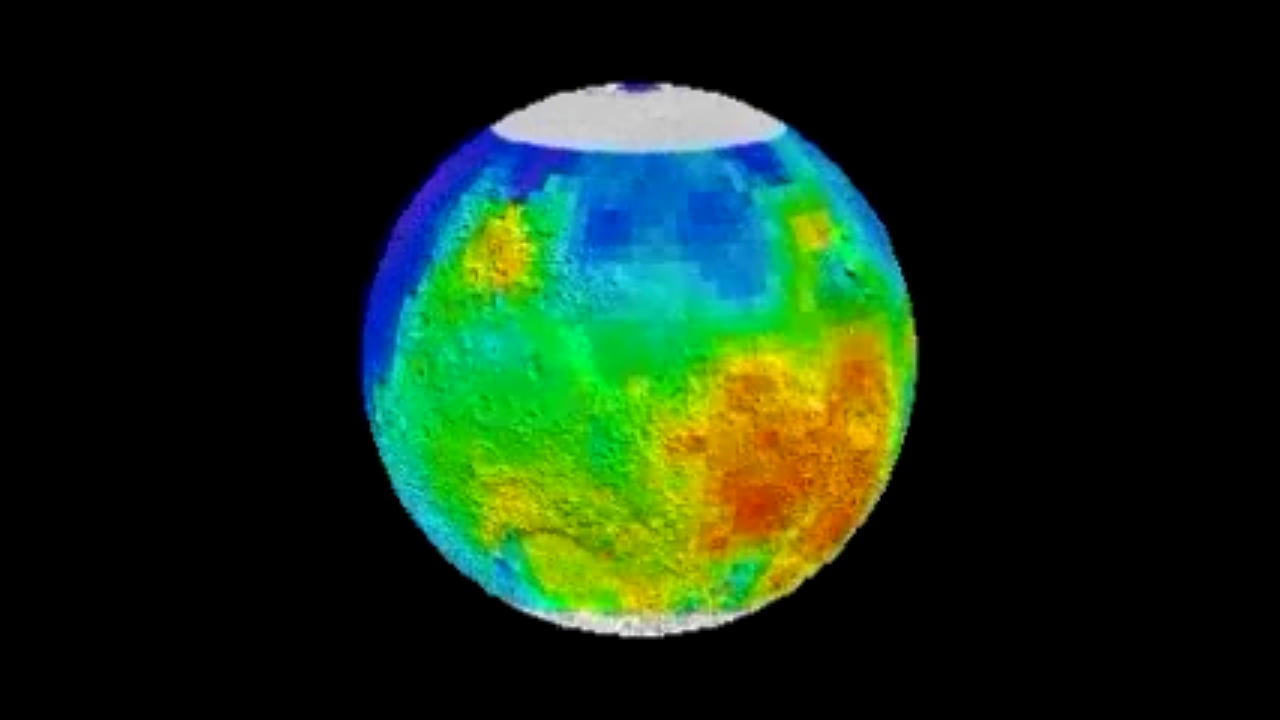
Animation from the Thermal Emission Spectrograph (4 frames per second )
Beginning with clear skies (represented by blue), the storm gathers in size and intensity. This animation represents atmospheric data from the Mars Global Surveyor's Thermal Emission Spectrograph. As the dust clouds grow thicker, they absorb more warmth from the sun and raising...
Share
Details
Claire Andreoli
NASA’s Goddard Space Flight Center
Greenbelt, Maryland
claire.andreoli@nasa.gov


