1 min read
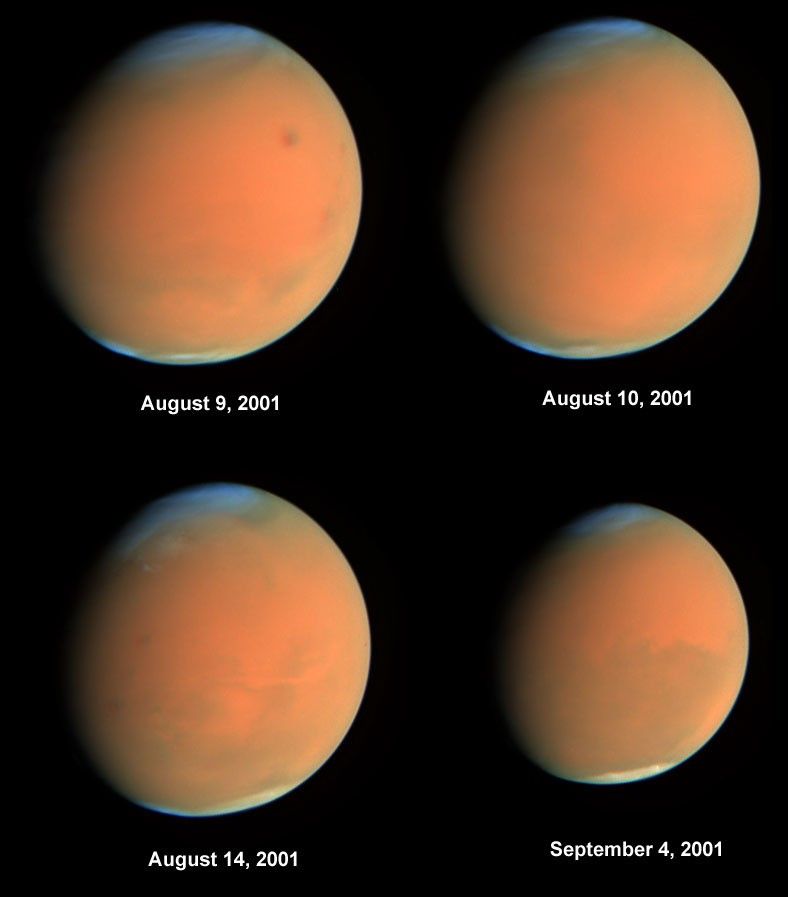
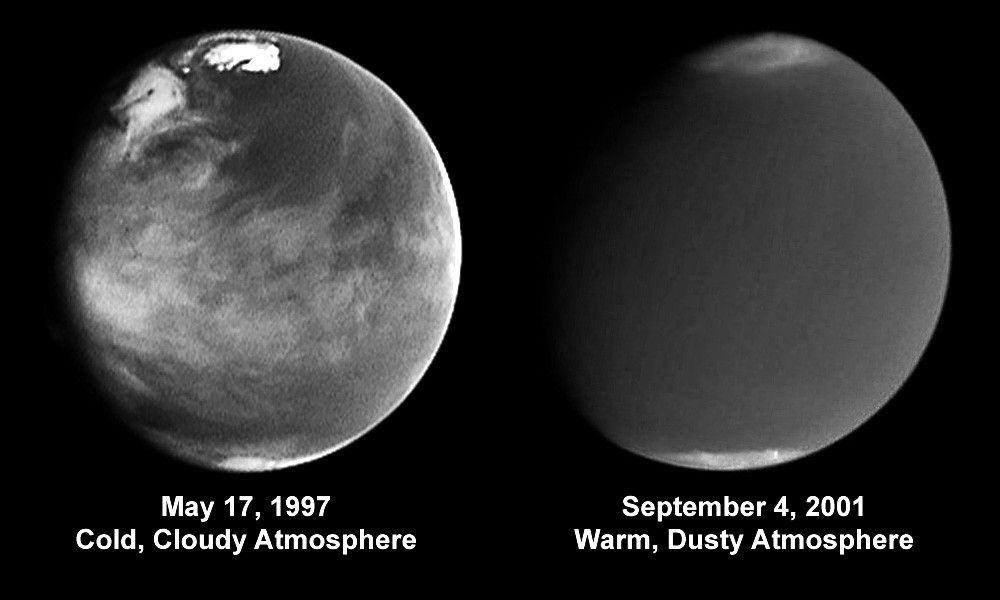
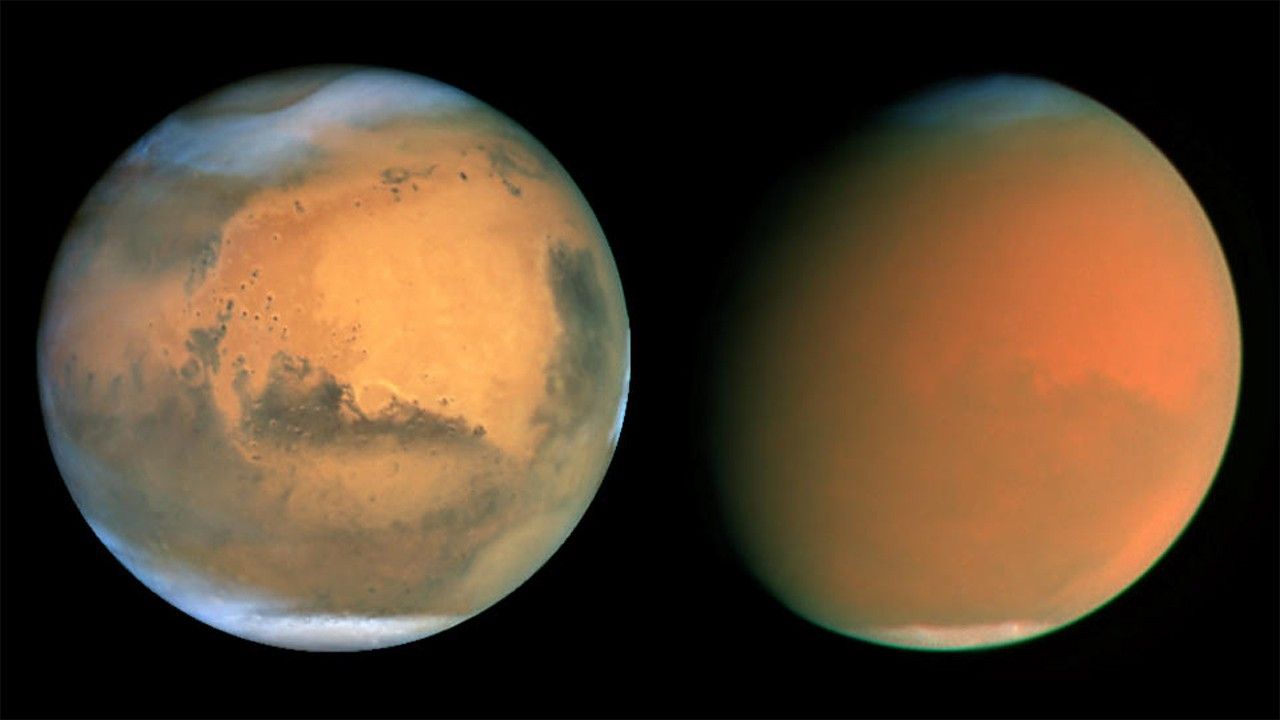
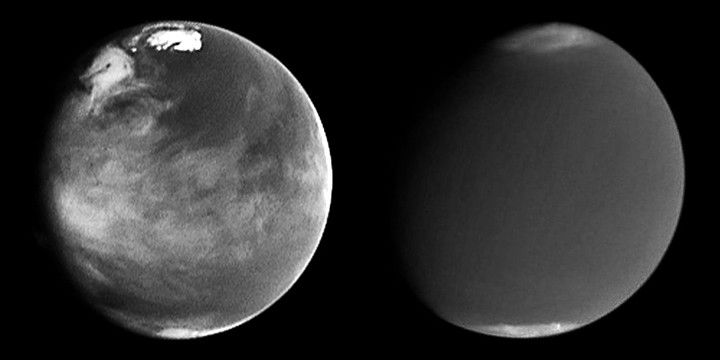
Comparison of Martian Atmospheric Activity From 1997 and 2001
About the Object
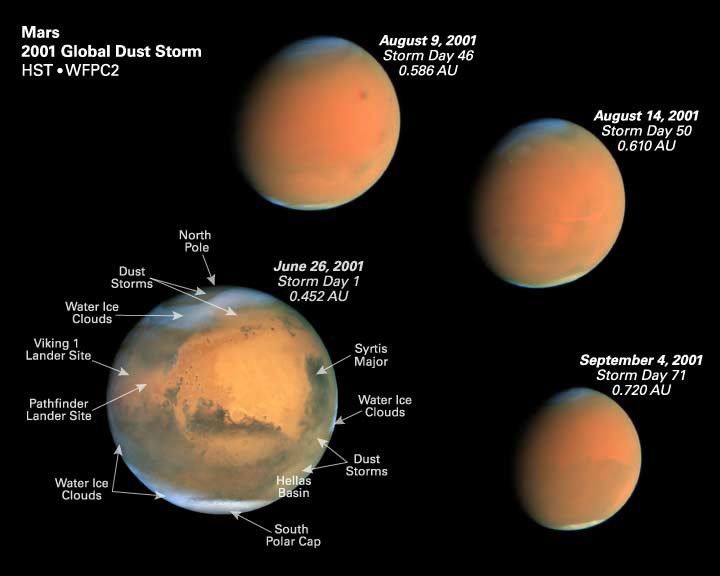
- DistanceDistanceThe physical distance from Earth to the astronomical object. Distances within our solar system are usually measured in Astronomical Units (AU). Distances between stars are usually measured in light-years. Interstellar distances can also be measured in parsecs.At the 1997 Mars opposition (left), the planet was approximately 62 million miles (100 million kilometers) from Earth. At the 2001 Mars opposition (right), the planet was approximately 43 million miles (68 million km) from Earth.
- DimensionsDimensionsThe physical size of the object or the apparent angle it subtends on the sky.The planet has a diameter of 4,222 miles (6,794 km) at the equator.
About the Data
- InstrumentInstrumentThe science instrument used to produce the data.HST>WFPC2
- Exposure DatesExposure DatesThe date(s) that the telescope made its observations and the total exposure time.May 17, 1997 (left), and September 4, 2001 (right)
- Object NameObject NameA name or catalog number that astronomers use to identify an astronomical object.Mars
- Object DescriptionObject DescriptionThe type of astronomical object.Planet, Global Dust Storm
- Release DateOctober 11, 2001
- Science ReleaseScientists Track “Perfect Storm” on Mars
- CreditPhoto Credit: J. Bell (Cornell University)
Related Images & Videos
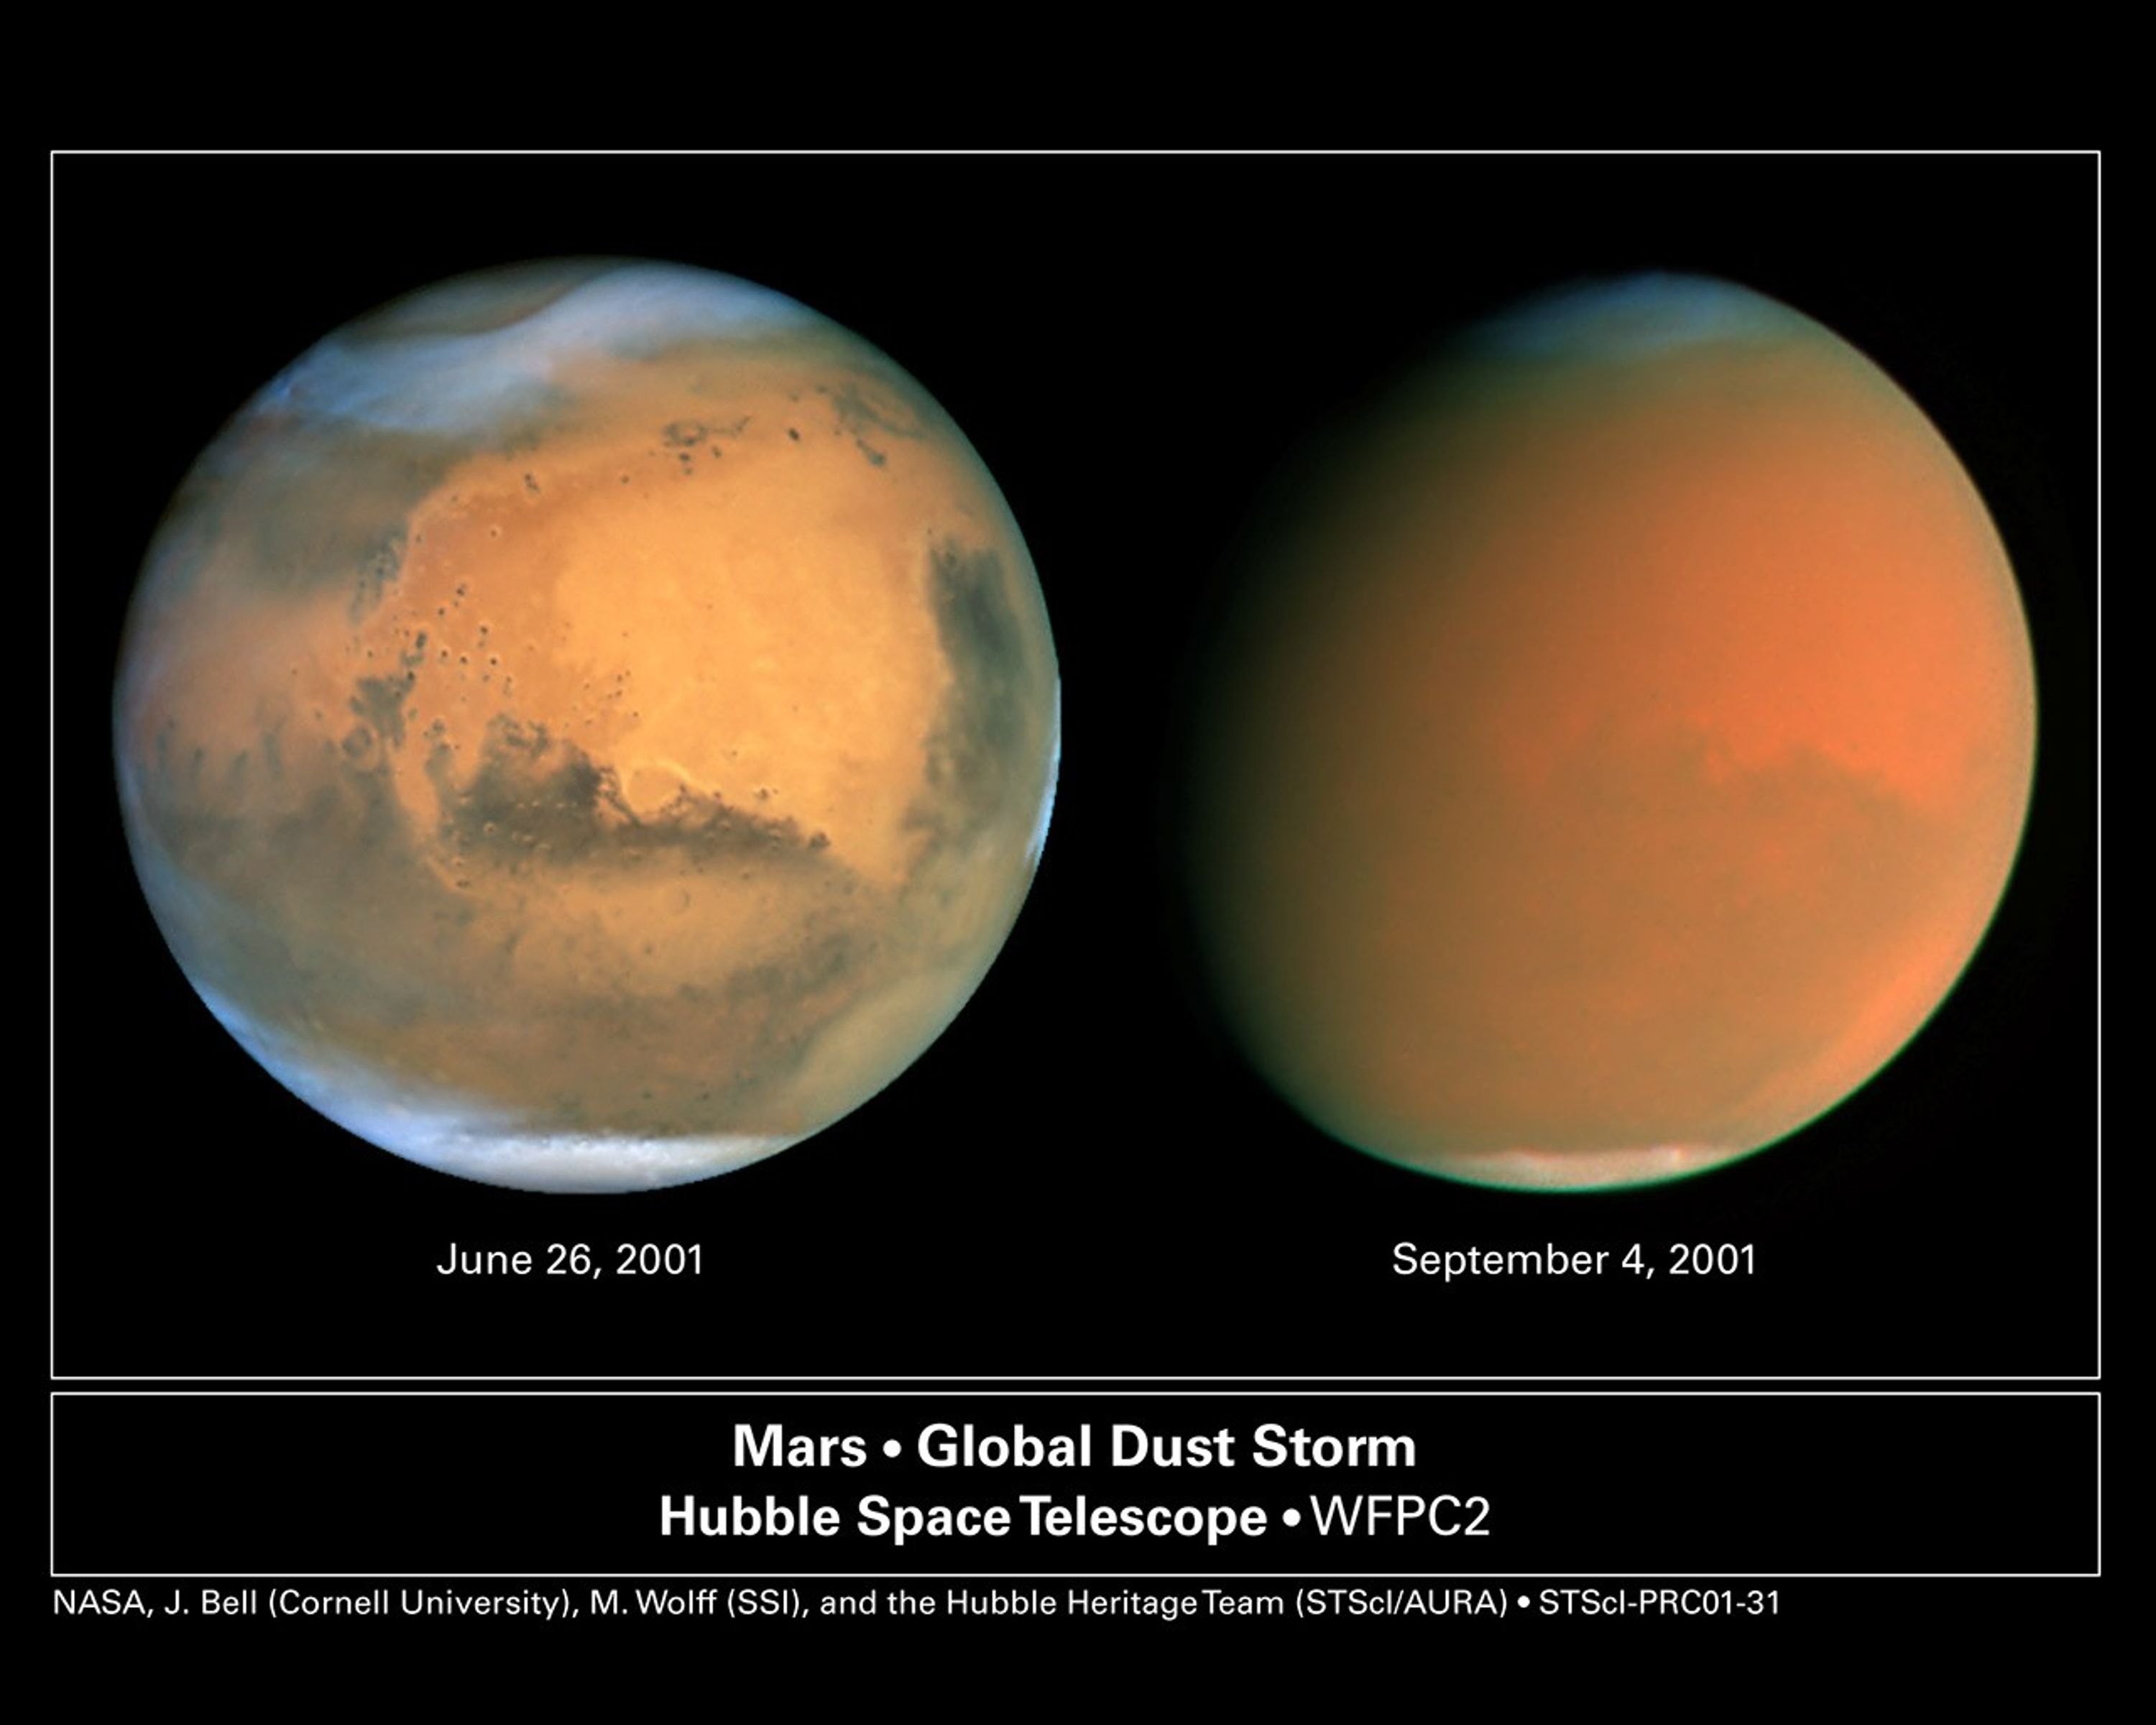
Scientists Track "Perfect Storm" on Mars
Two dramatically different faces of our Red Planet neighbor appear in these comparison images showing how a global dust storm engulfed Mars with the onset of Martian spring in the Southern Hemisphere. When NASA's Hubble Space Telescope imaged Mars in June, the seeds of the storm...
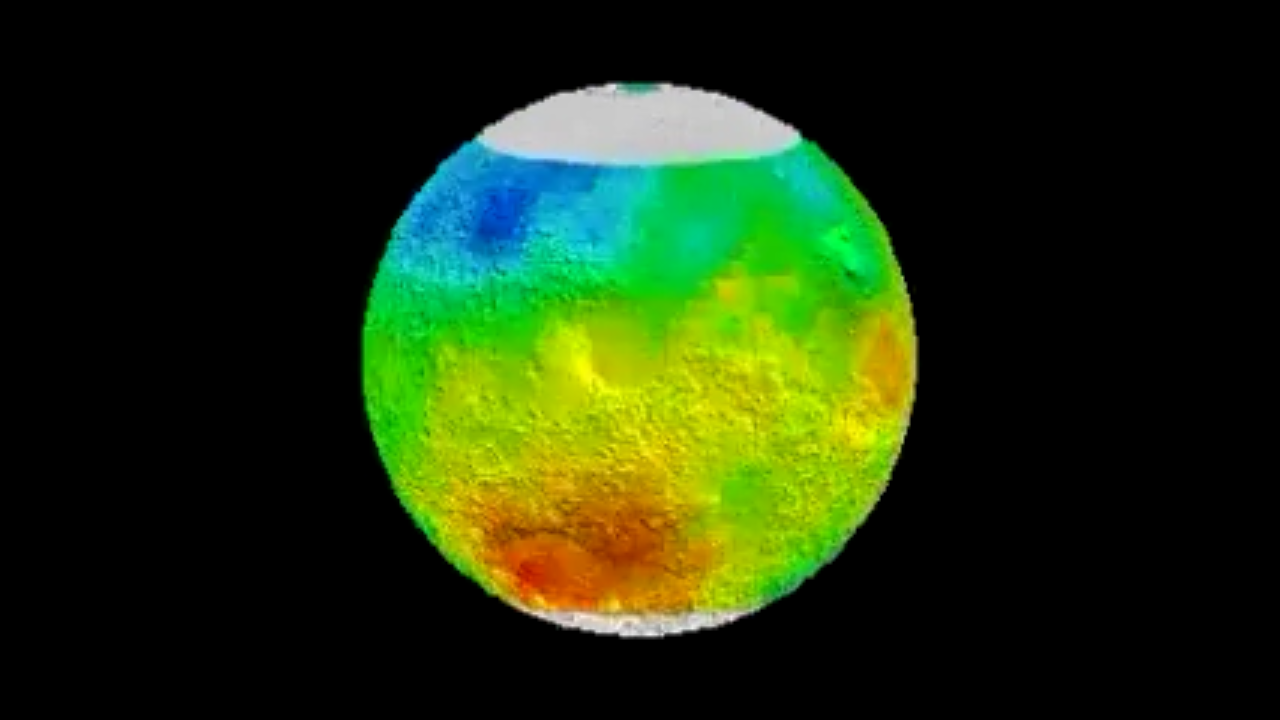
Animation from the Thermal Emission Spectrograph (10 frames per second )
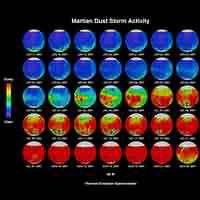
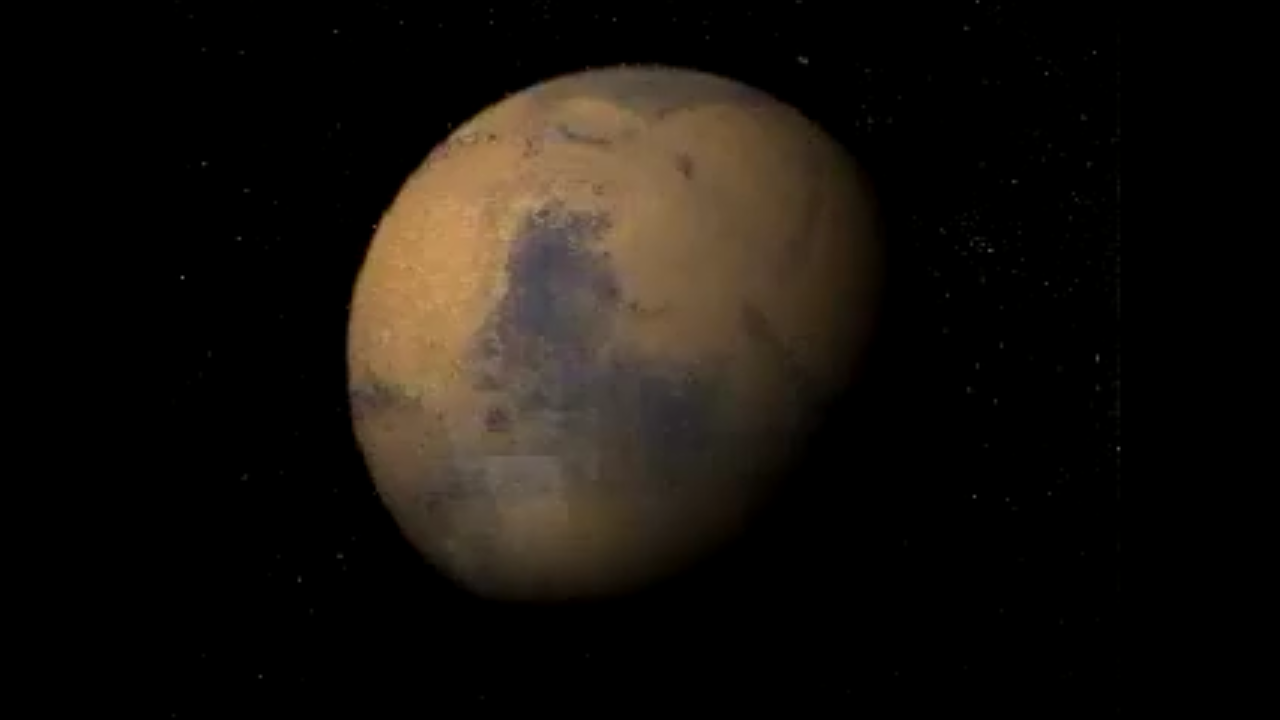
Beginning with clear skies (represented by blue), the storm gathers in size and intensity. This animation represents atmospheric data from the Mars Global Surveyor's Thermal Emission Spectrograph. As the dust clouds grow thicker, they absorb more warmth from the sun and raising...
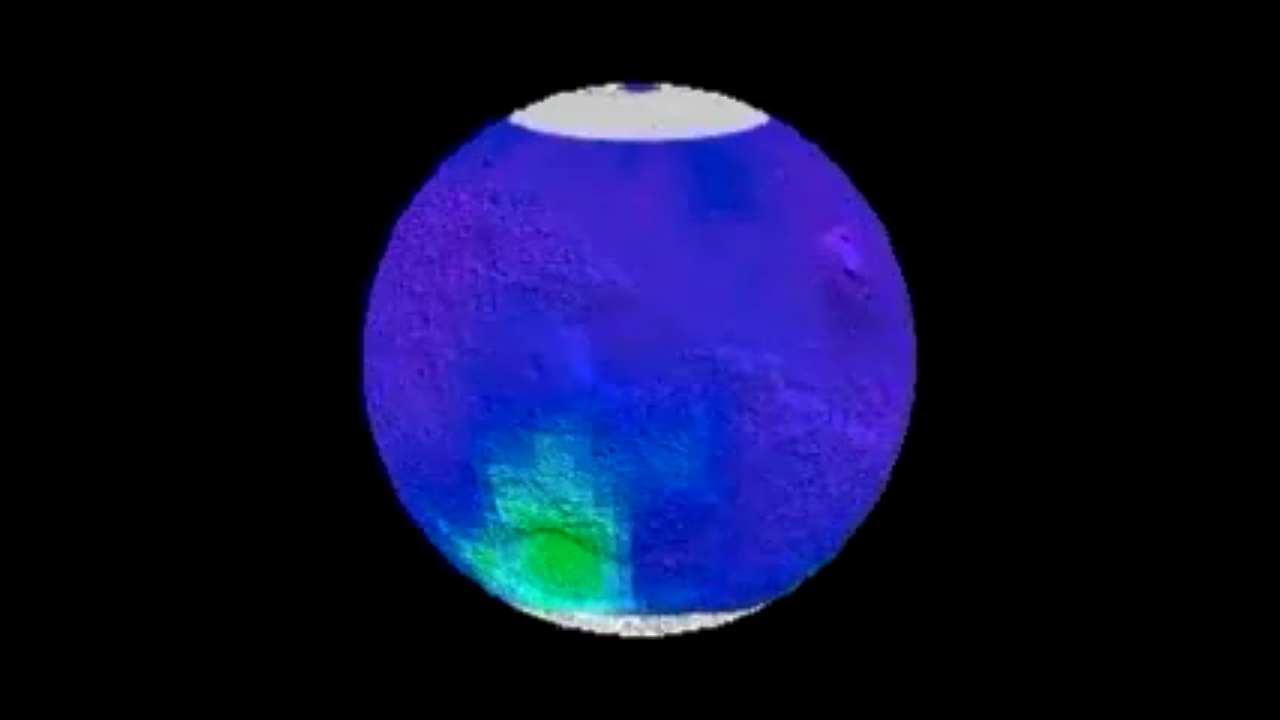
Animation from the Thermal Emission Spectrograph (6 frames per second )
Beginning with clear skies (represented by blue), the storm gathers in size and intensity. This animation represents atmospheric data from the Mars Global Surveyor's Thermal Emission Spectrograph. As the dust clouds grow thicker, they absorb more warmth from the sun and raising...
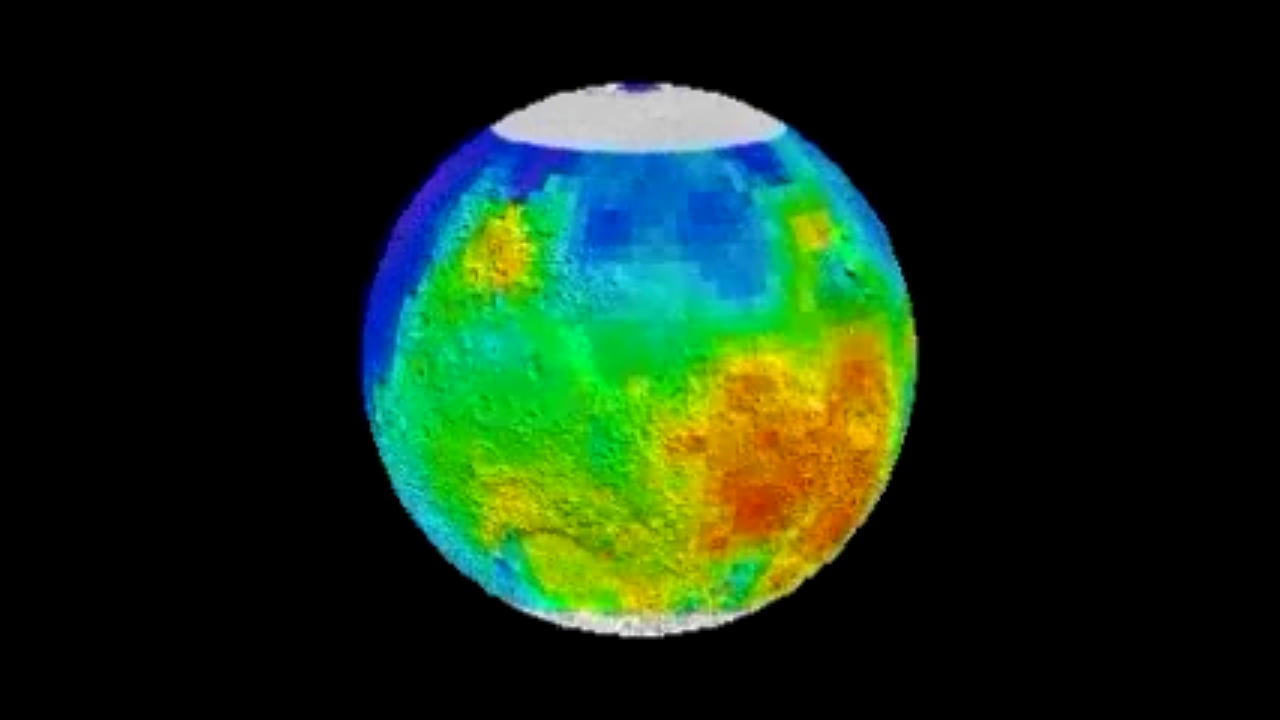
Animation from the Thermal Emission Spectrograph (4 frames per second )
Beginning with clear skies (represented by blue), the storm gathers in size and intensity. This animation represents atmospheric data from the Mars Global Surveyor's Thermal Emission Spectrograph. As the dust clouds grow thicker, they absorb more warmth from the sun and raising...
Share
Details
Claire Andreoli
NASA’s Goddard Space Flight Center
Greenbelt, Maryland
claire.andreoli@nasa.gov


