1 min read
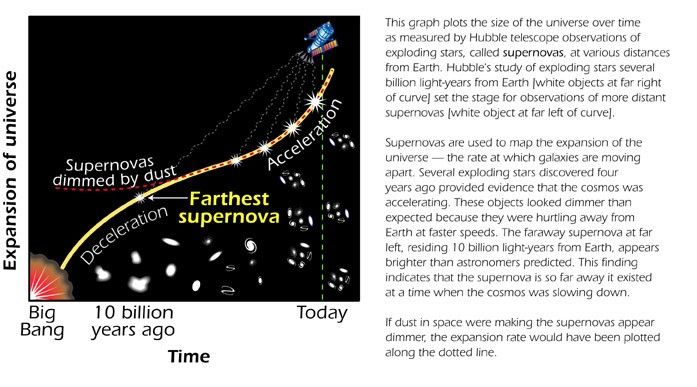
Expansion of the Universe Over Time
- Release DateApril 2, 2001
- Science ReleaseBlast from the Past: Farthest Supernova Ever Seen Sheds Light on Dark Universe
- CreditCredit: Ann Feild (STScI)
Related Images & Videos
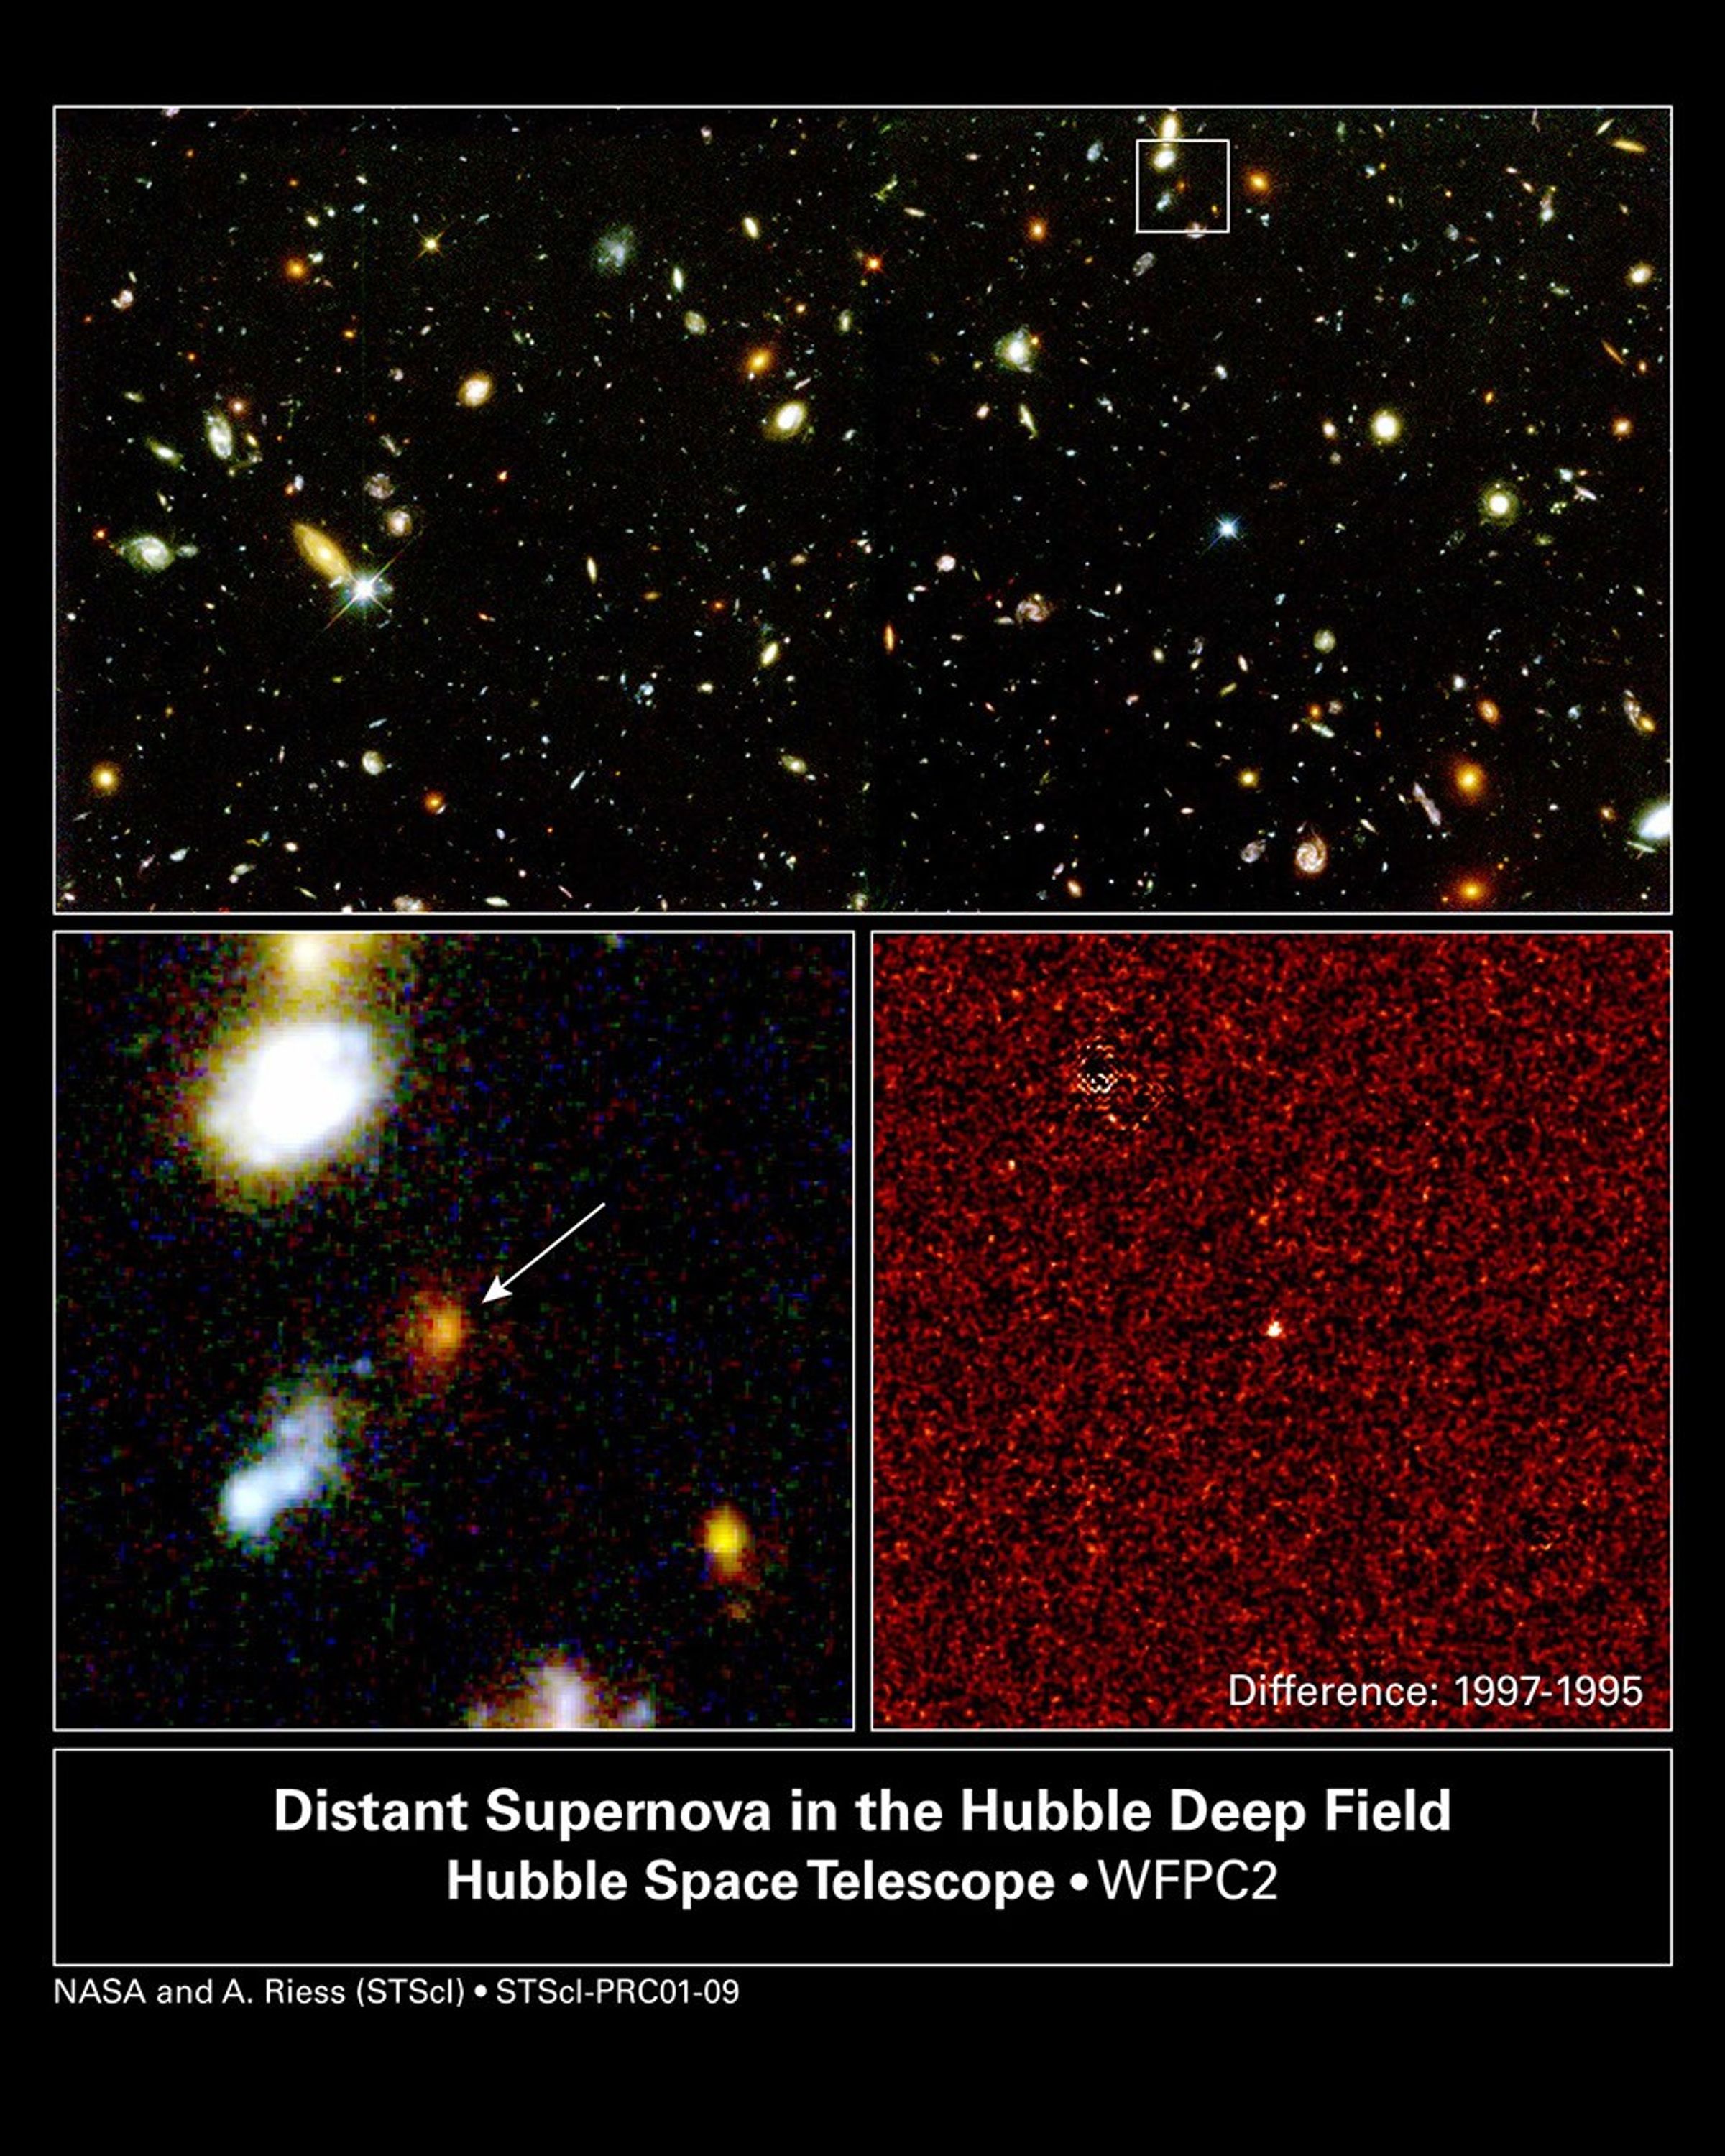
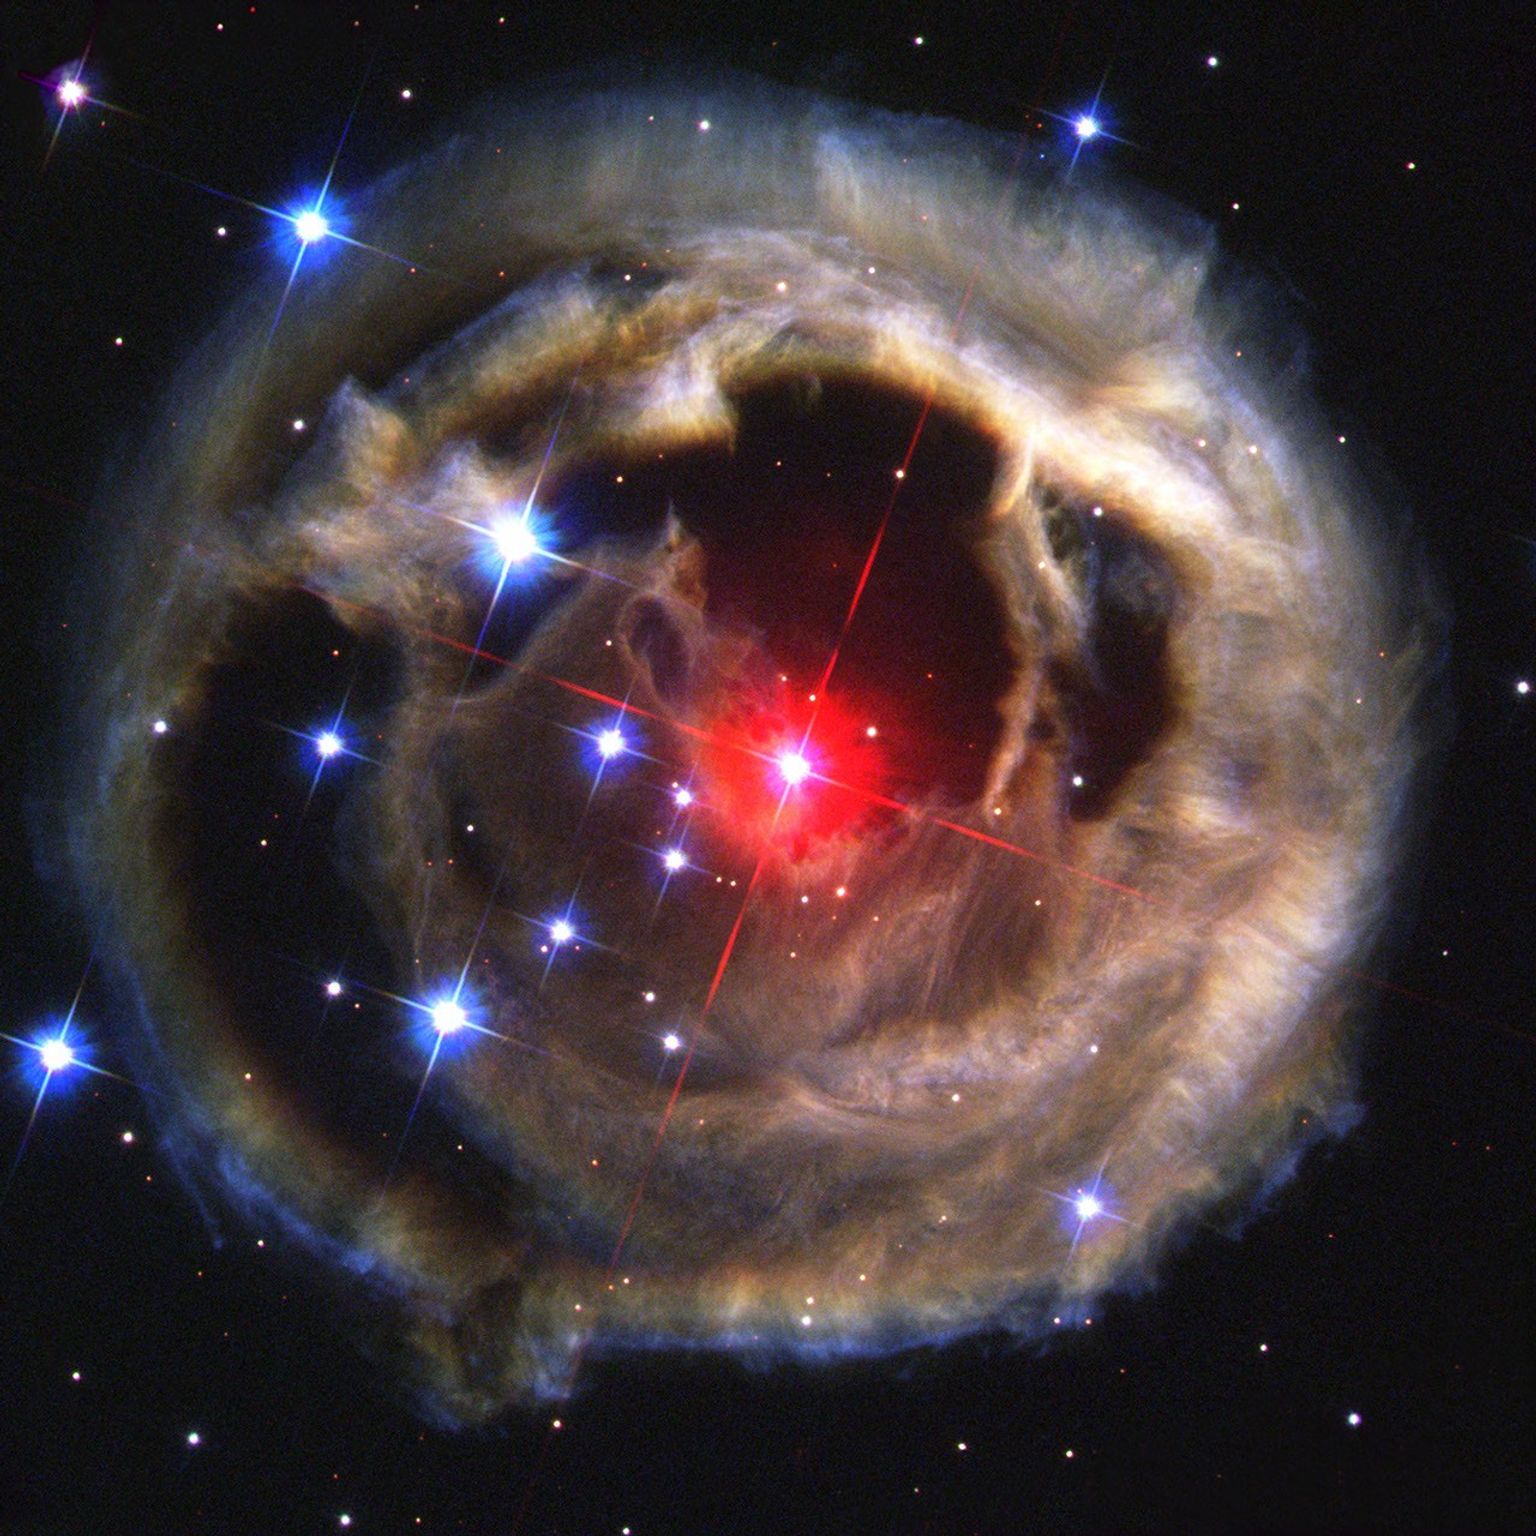
Hubble Spies Most Distant Supernova Ever Seen
Using NASA's Hubble Space Telescope, astronomers pinpointed a blaze of light from the farthest supernova ever seen, a dying star that exploded 10 billion years ago. The detection and analysis of this supernova, called 1997ff, is greatly bolstering the case for the existence of a...


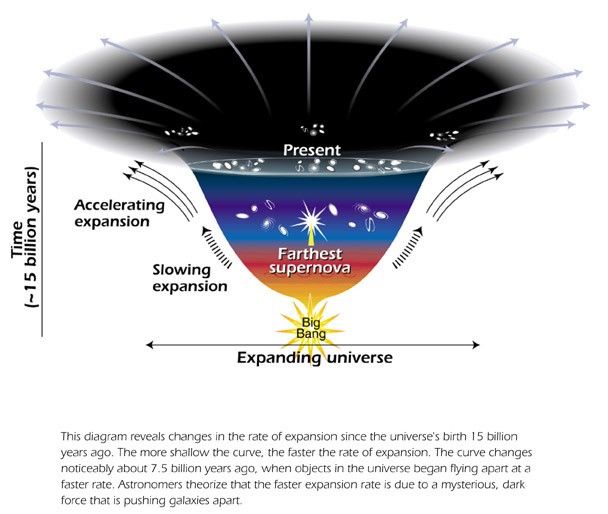
Changes in the Rate of Expansion over Time
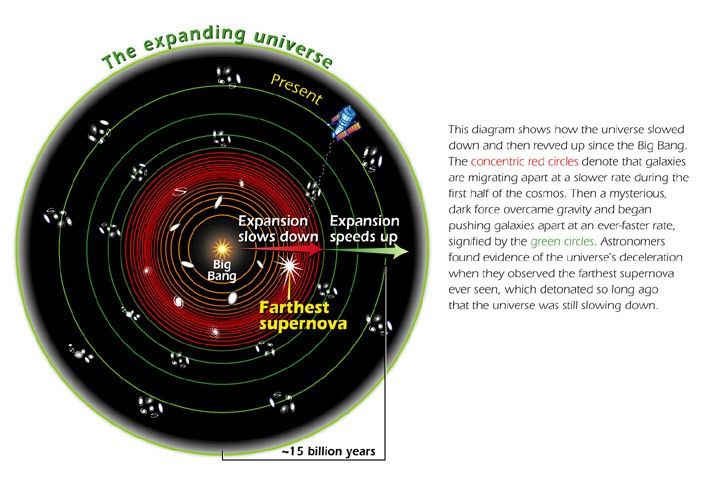
This diagram reveals changes in the rate of expansion since the universe's birth 15 billion years ago. The more shalow the curve, the faster the rate of expansion. The curve changes noticeably about 7.5 billion years ago, when objects in the universe began flying apart as a...
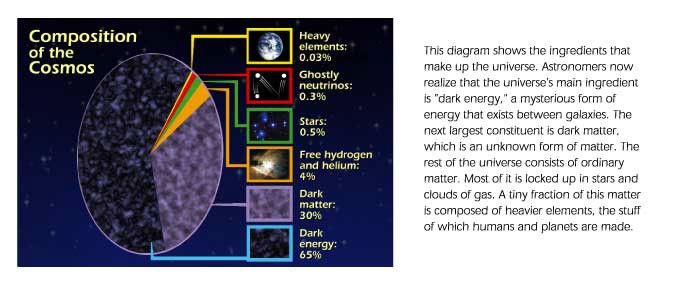
Composition of the Cosmos
This diagram shows the ingredients that make up the universe. Astronomers now realize that the universe's main ingredient is "dark energy," a mysterious form of energy that exists between galaxies. The next largest constituent is dark matter, which is an unknown form of matter....
Share
Details
Claire Andreoli
NASA’s Goddard Space Flight Center
Greenbelt, Maryland
claire.andreoli@nasa.gov