


1 min read
Probing Storm Systems on Jupiter
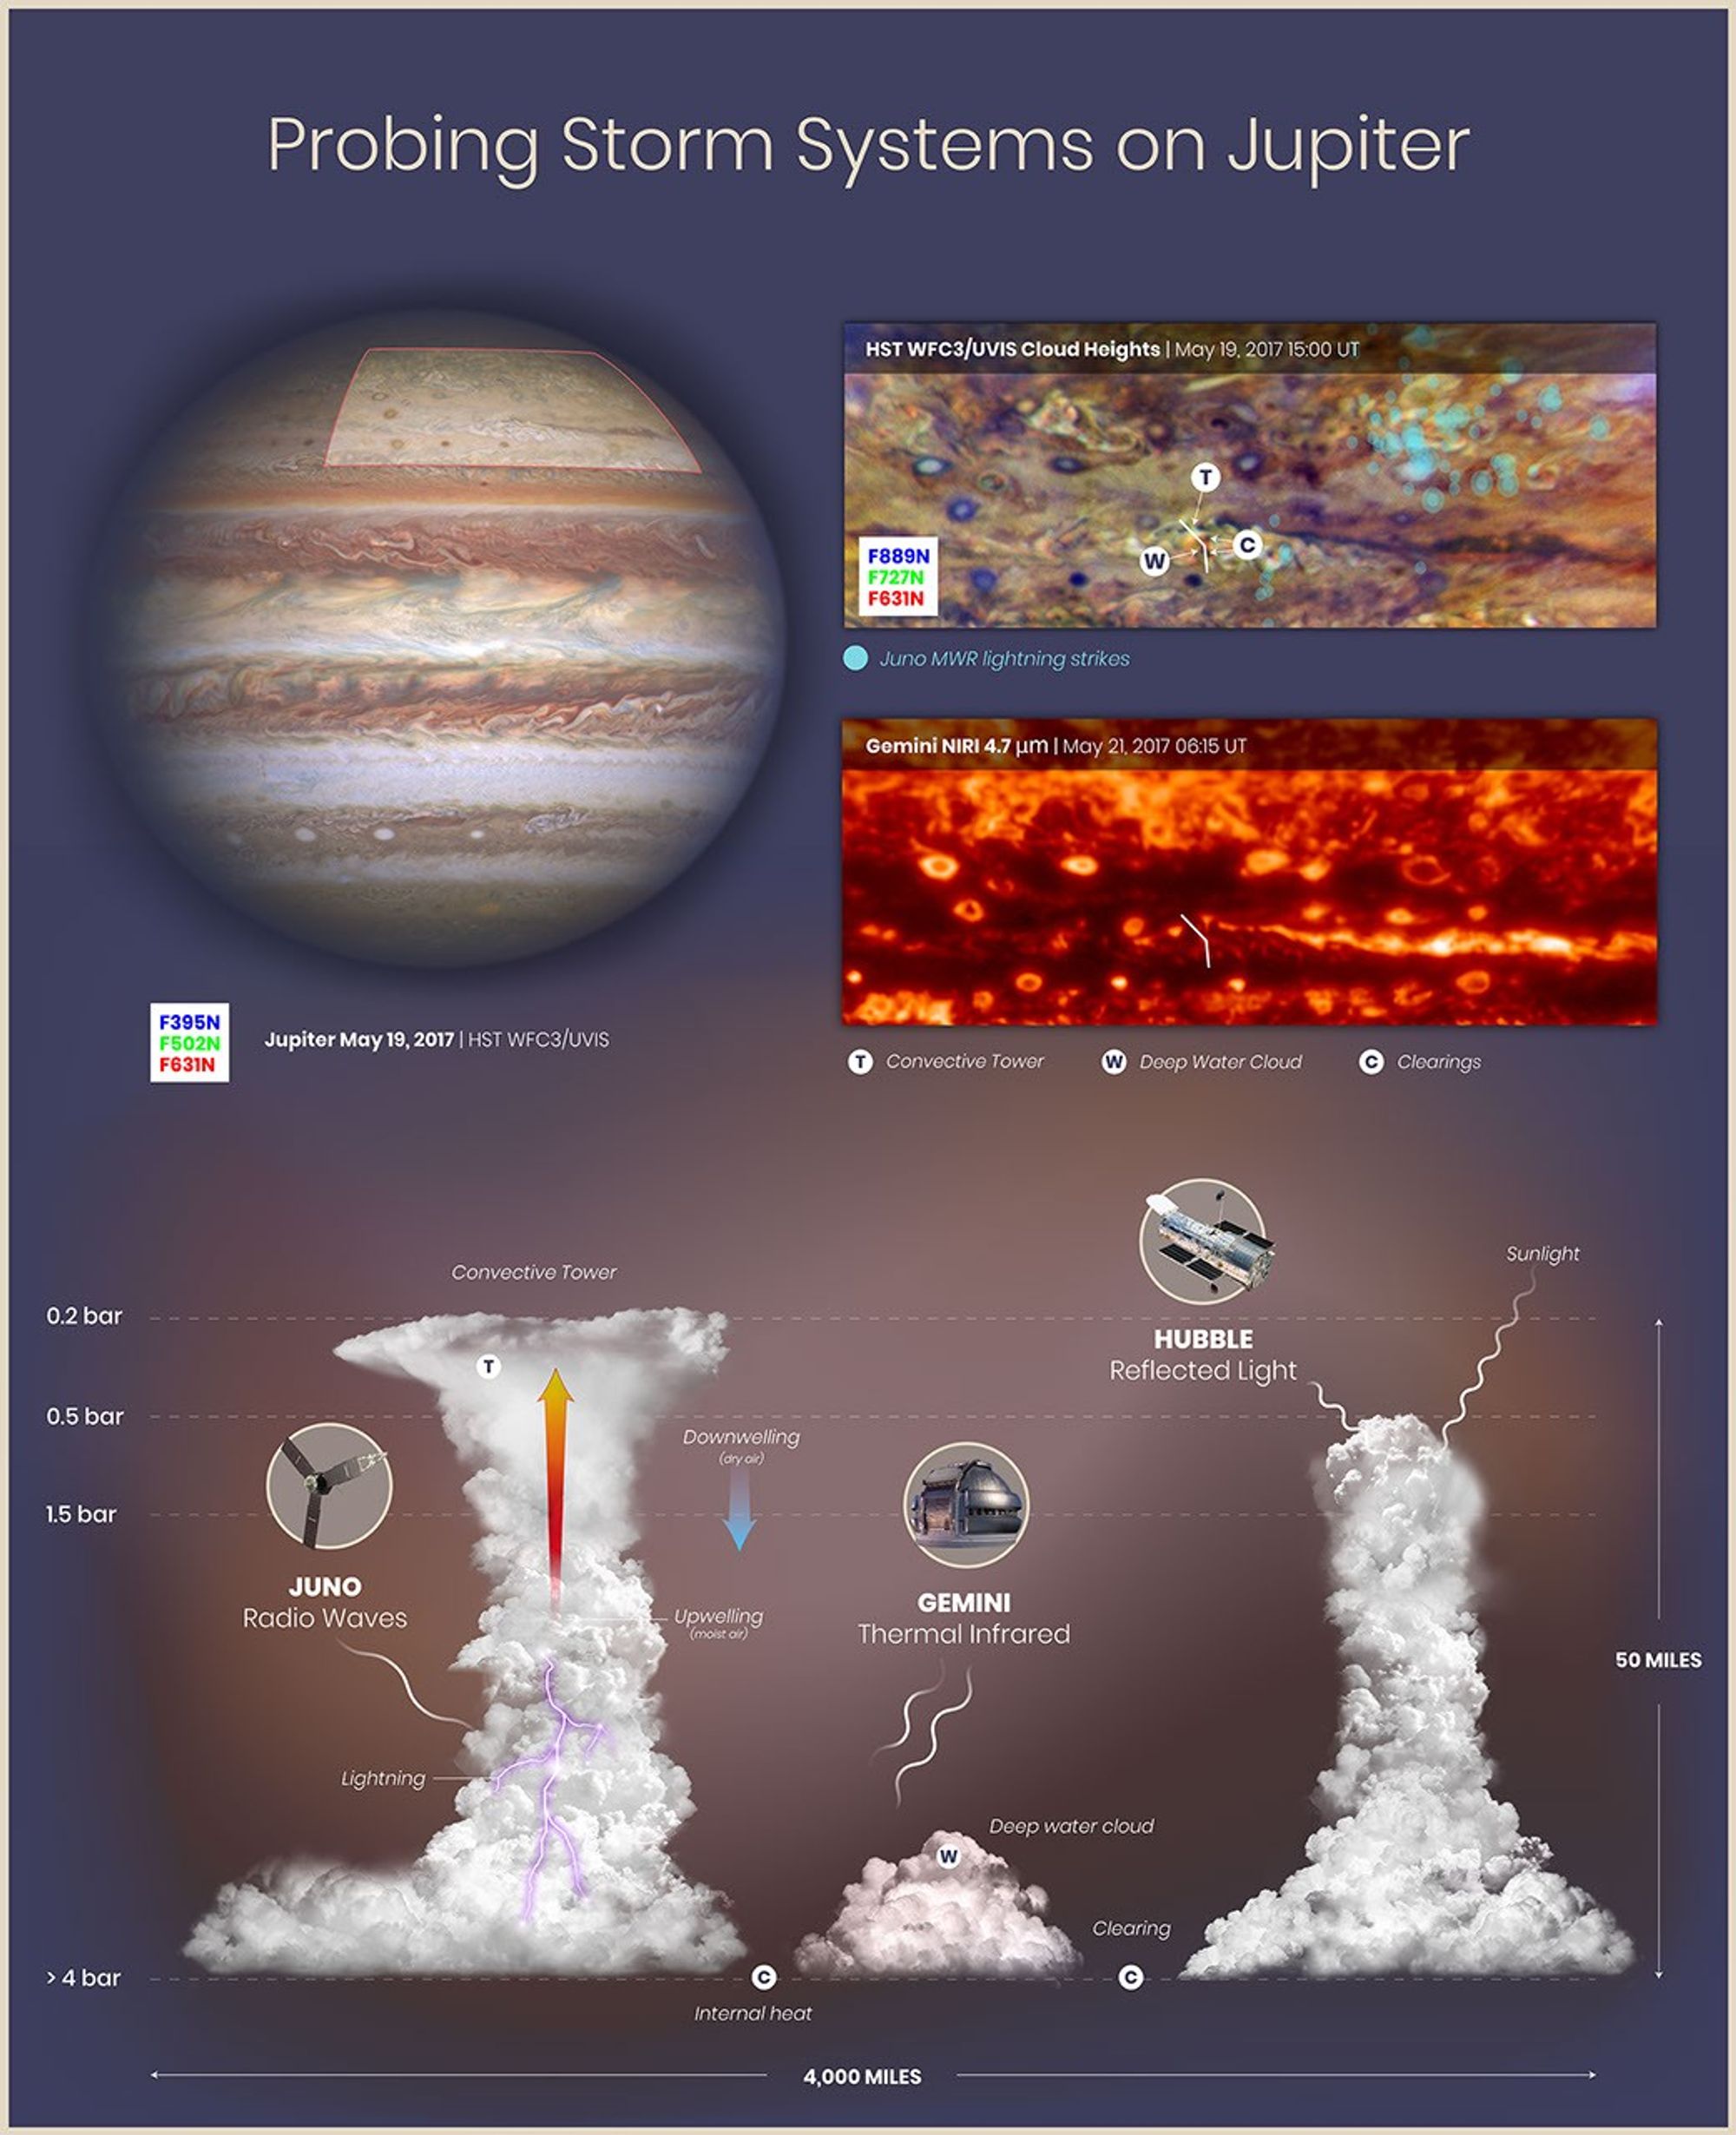
This graphic shows observations and interpretations of cloud structures and atmospheric circulation on Jupiter from the Juno spacecraft, the Hubble Space Telescope, and the Gemini Observatory. By combining the Juno, Hubble, and Gemini data, researchers are able to see that lightning flashes are clustered in turbulent regions where there are deep water clouds and where moist air is rising to form tall convective towers similar to cumulonimbus clouds (thunderheads) on Earth.
Upper left: This natural-color (visible light) image of the full disk of Jupiter was captured by Hubble's Wide Field Camera 3 on May 19, 2017. The highlighted region in the northern hemisphere is shown in the two details to the right.
Upper right: The Hubble Space Telescope detail shows cloud heights in Jupiter's atmosphere. High-altitude clouds reflect multiple wavelengths of visible and near-infrared light and appear lighter-colored in the image. Deeper clouds reflect less light and appear darker. Lightning flashes based on radio wave detections by Juno's Microwave Radiometer are shown in teal.
Middle right: This Gemini image of the same region, captured on May 21, 2017, shows thermal infrared light (4.7 µm) emitted from Jupiter. Brighter areas correspond to reduced cloud thickness, where more thermal emission from warm, deep atmospheric layers is able to escape to space.
Bottom: This illustration of lightning, convective towers, deep water clouds, and clearings in Jupiter's atmosphere is based on data from Juno, Hubble, and Gemini, and corresponds to the transect (angled white line) indicated on the Hubble and Gemini map details. The combination of observations can be used to map the cloud structure in three dimensions and infer details of atmospheric circulation. Thick, towering clouds form where moist air is rising (upwelling and active convection). Clearings form where drier air sinks (downwelling). The clouds shown rise five times higher than similar convective towers in the relatively shallow atmosphere of Earth. The region illustrated covers a horizontal span one-third greater than that of the continental United States.
About the Object
- DistanceDistanceThe physical distance from Earth to the astronomical object. Distances within our solar system are usually measured in Astronomical Units (AU). Distances between stars are usually measured in light-years. Interstellar distances can also be measured in parsecs.At the time of observation on May 19, 2017, Jupiter was 4.69 AU (436 million miles or 701 million kilometers) from Earth. The semi-major axis of Jupiter's orbit about the Sun is 5.2 astronomical units (483 million miles or 778 million km).
About the Data
- Data DescriptionData DescriptionProposal: A description of the observations, their scientific justification, and the links to the data available in the science archive.
Science Team: The astronomers who planned the observations and analyzed the data. "PI" refers to the Principal Investigator.The full image of Jupiter was created from Hubble data from proposal 14661 M. Wong. HST and Gemini detail panels are cylindrical map projections, from 30°N to 60°N planetographic latitude, and from 180° to 100° W System III longitude. HST cloud height map: May 19, 2017 with WFC3 631nm, 727 nm, 889 nm Juno lightning detections: Microwave Radiometer, 600 MHz Gemini Image: May 21, 2017 4.7 µm Teal symbols in the upper right detail mark the boresight locations at the time that Juno's MWR recorded lightning sferics. This area is where the largest cluster of lightning sferics was reported from Juno's first 8 orbits, as reported by Brown et al. (2018) in Nature. https://doi.org/10.1038/s41586-018-0156-5
- Object NameObject NameA name or catalog number that astronomers use to identify an astronomical object.Jupiter
- Object DescriptionObject DescriptionThe type of astronomical object.Planet
- Release DateMay 7, 2020
- Science ReleaseTelescopes and Spacecraft Join Forces to Probe Deep into Jupiter’s Atmosphere
- Credit
Related Images & Videos

Jupiter's Great Red Spot
These images of Jupiter's Great Red Spot were made using data collected by the Hubble Space Telescope and the Gemini Observatory on April 1, 2018. By combining observations captured at almost the same time from the two different observatories, astronomers were able to determine...

Jupiter (May 19, 2017)
This natural-color (visible light) image of Jupiter was captured by Hubble's Wide Field Camera 3 on May 19, 2017. This image was taken to coincide with the Juno spacecraft's sixth flyby of Jupiter (Perijove 6, or PJ 6). Wide-field imagery is used to provide context for Juno's...

Probing Storm Systems on Jupiter (Graphic)
This illustration of lightning, convective towers (thunderheads), deep water clouds, and clearings in Jupiter's atmosphere is based on data collected by the Juno spacecraft, the Hubble Space Telescope, and the Gemini Observatory. Juno detects radio signals generated by lightning...
Share
Details
Claire Andreoli
NASA’s Goddard Space Flight Center
Greenbelt, Maryland
claire.andreoli@nasa.gov