1 min read
Scientists Track “Perfect Storm” on Mars
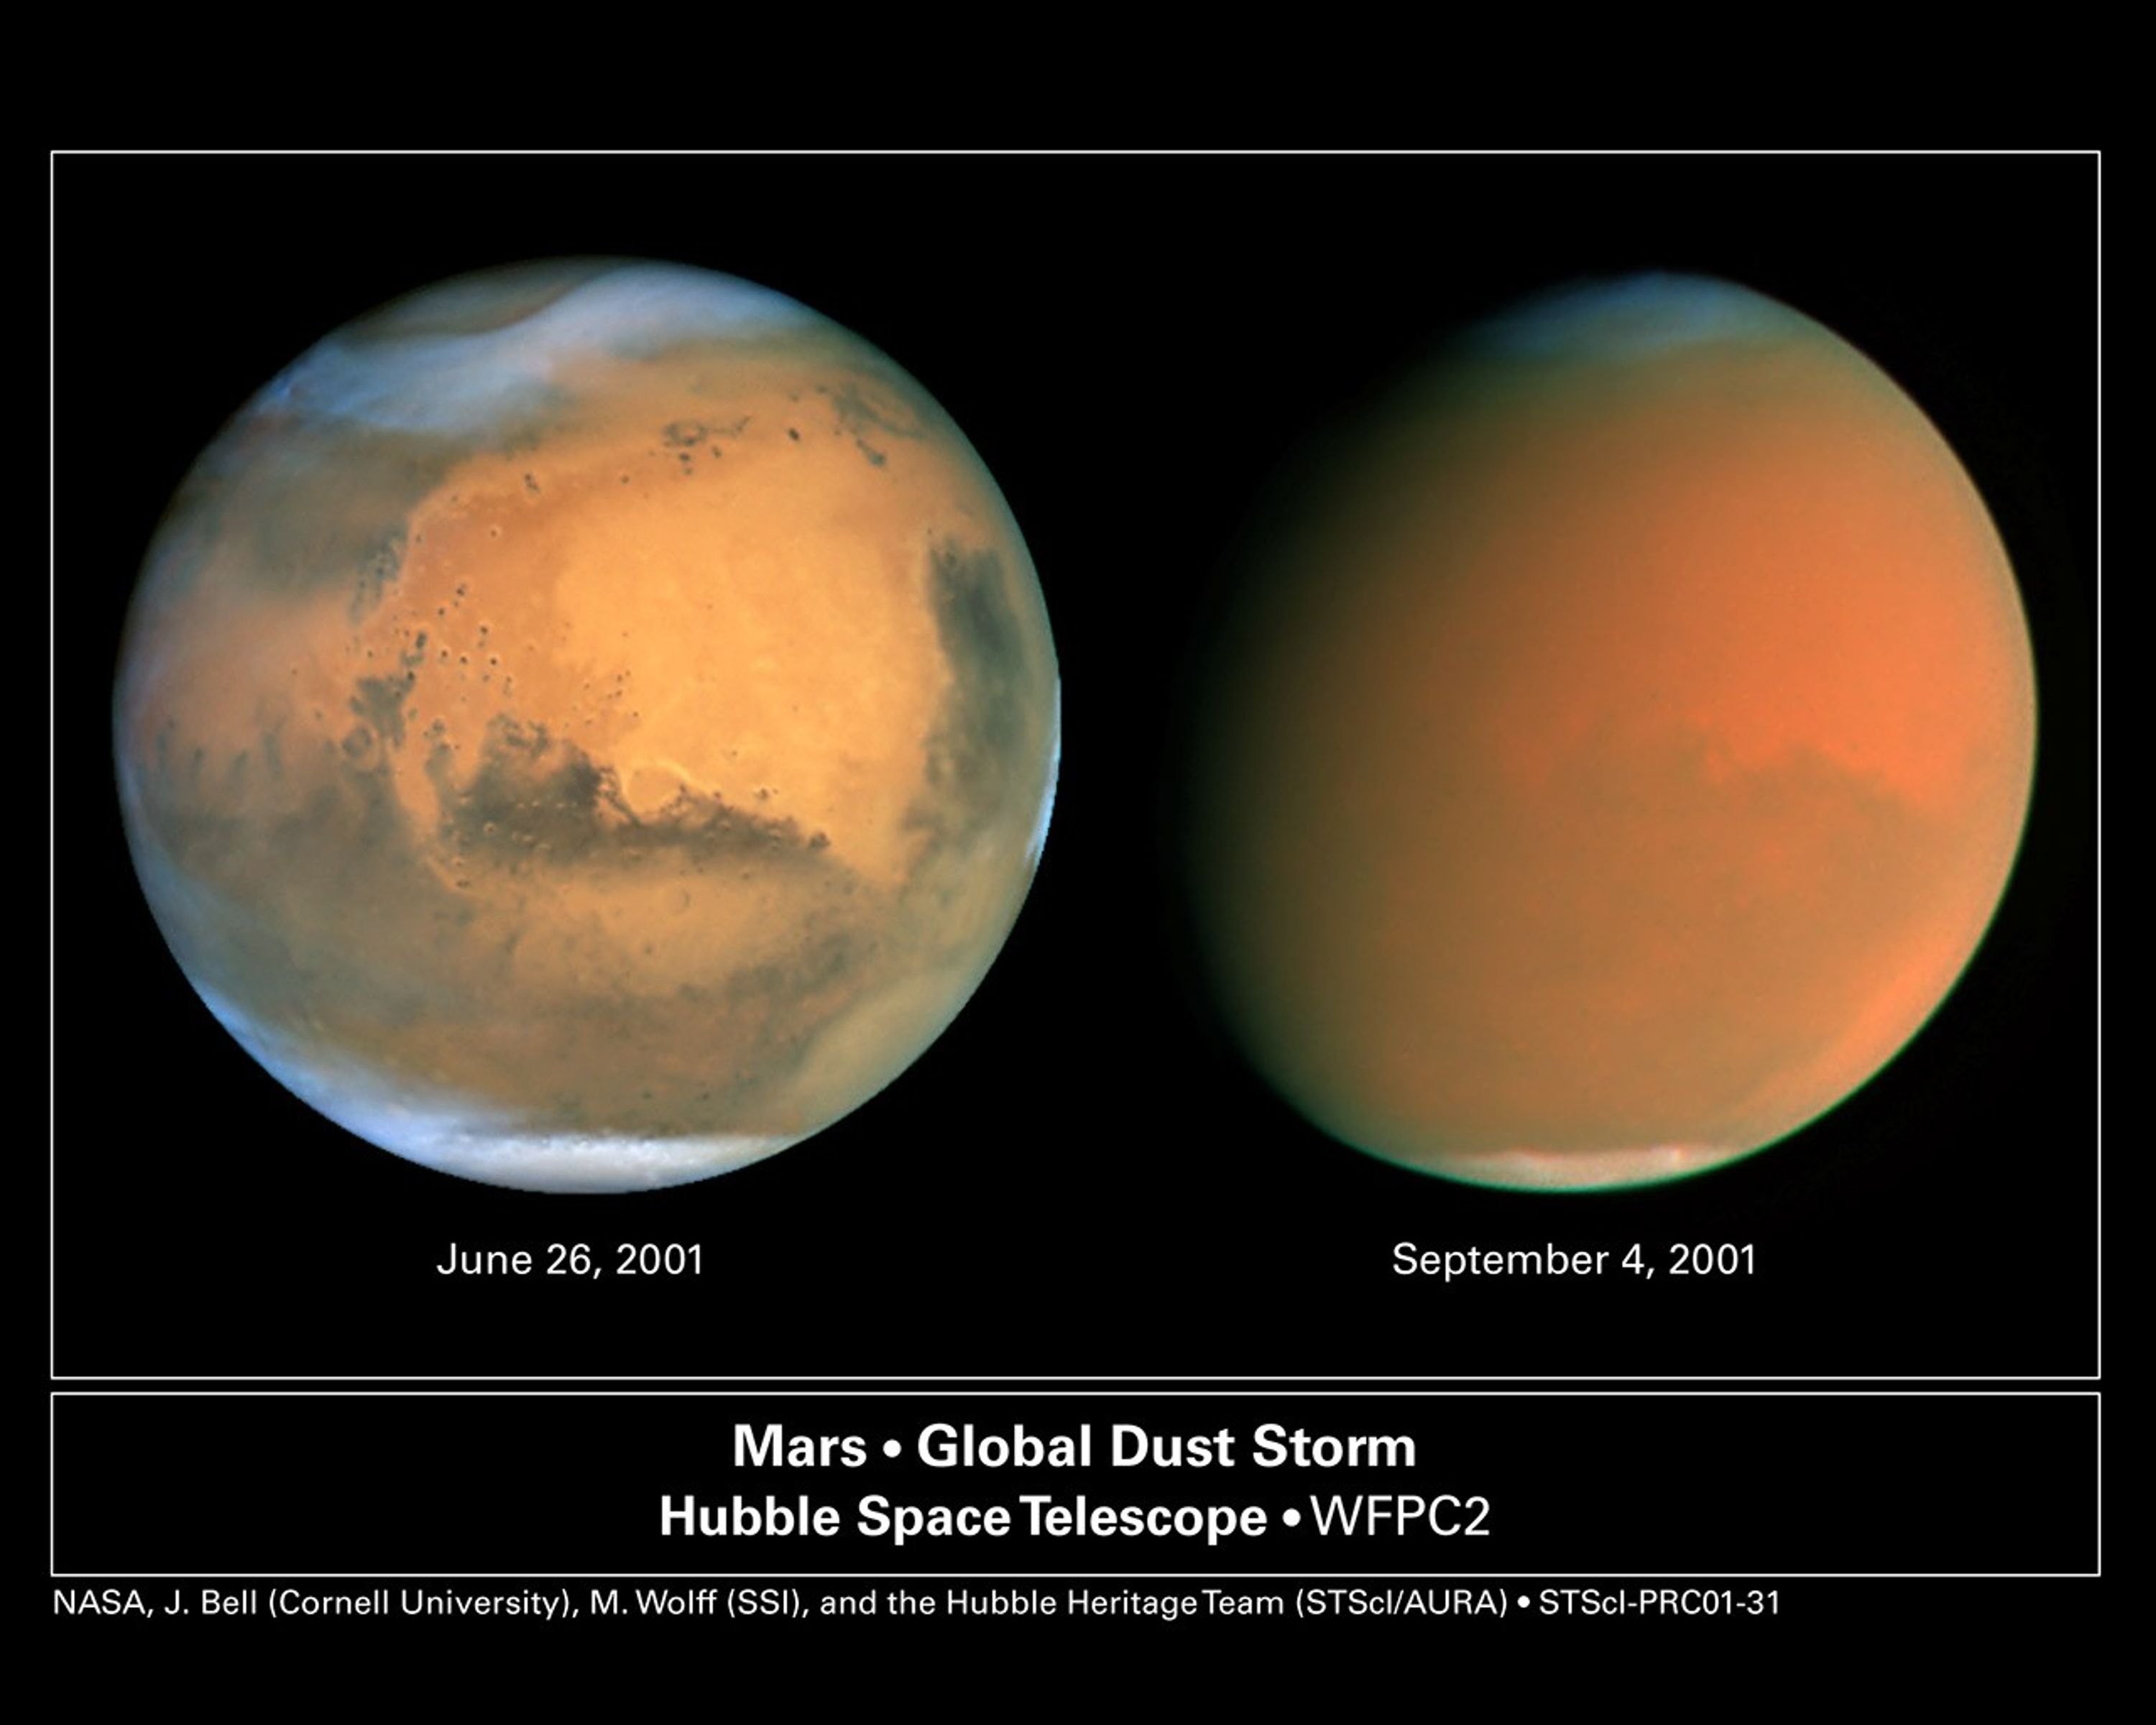
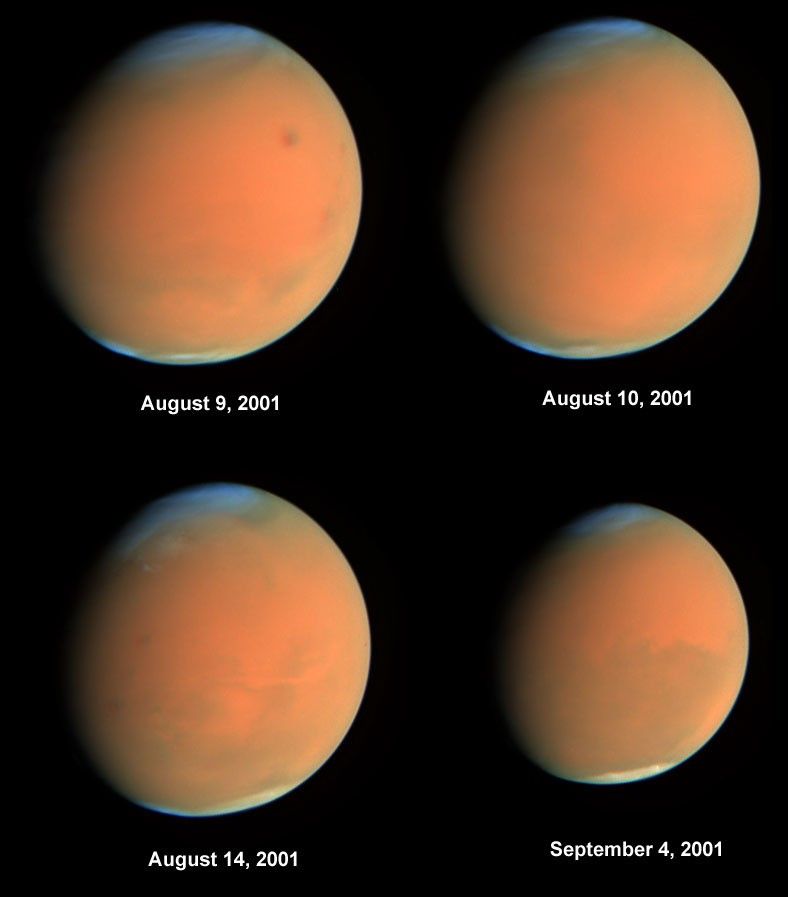
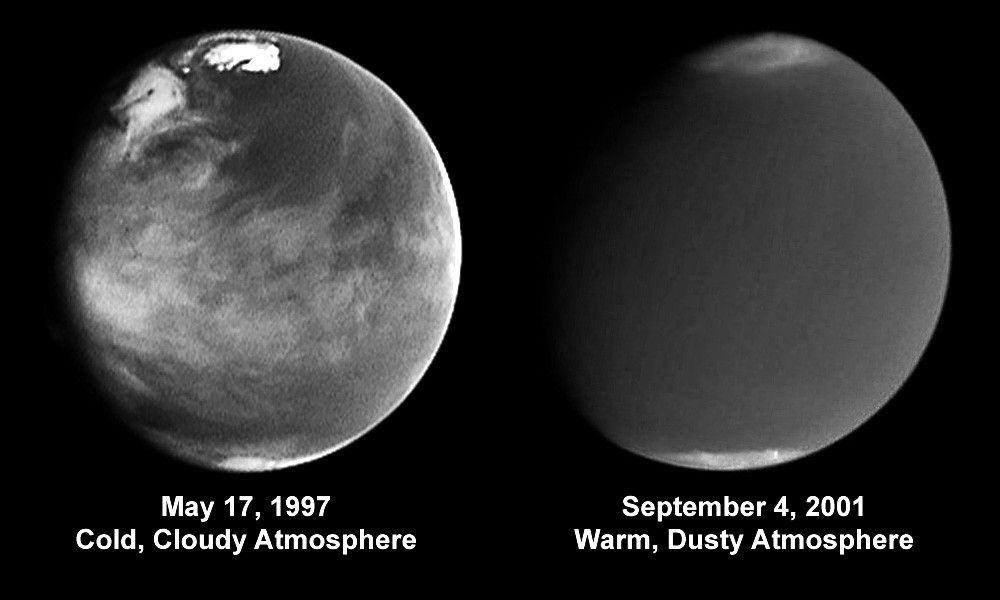
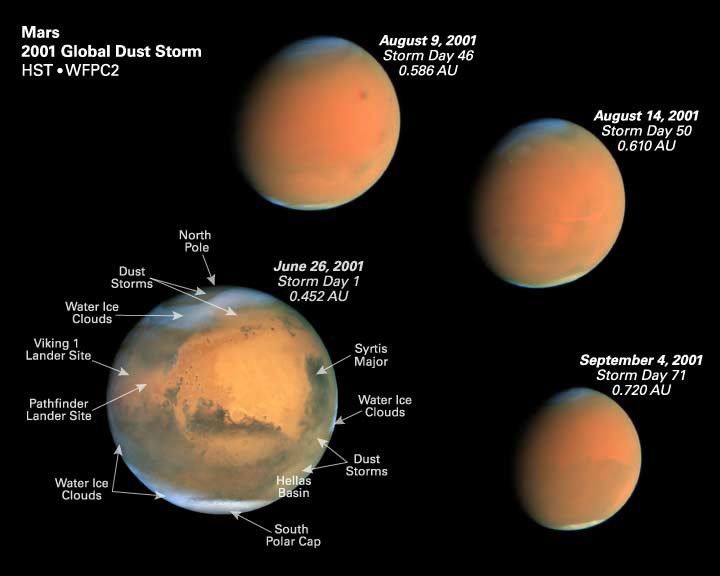
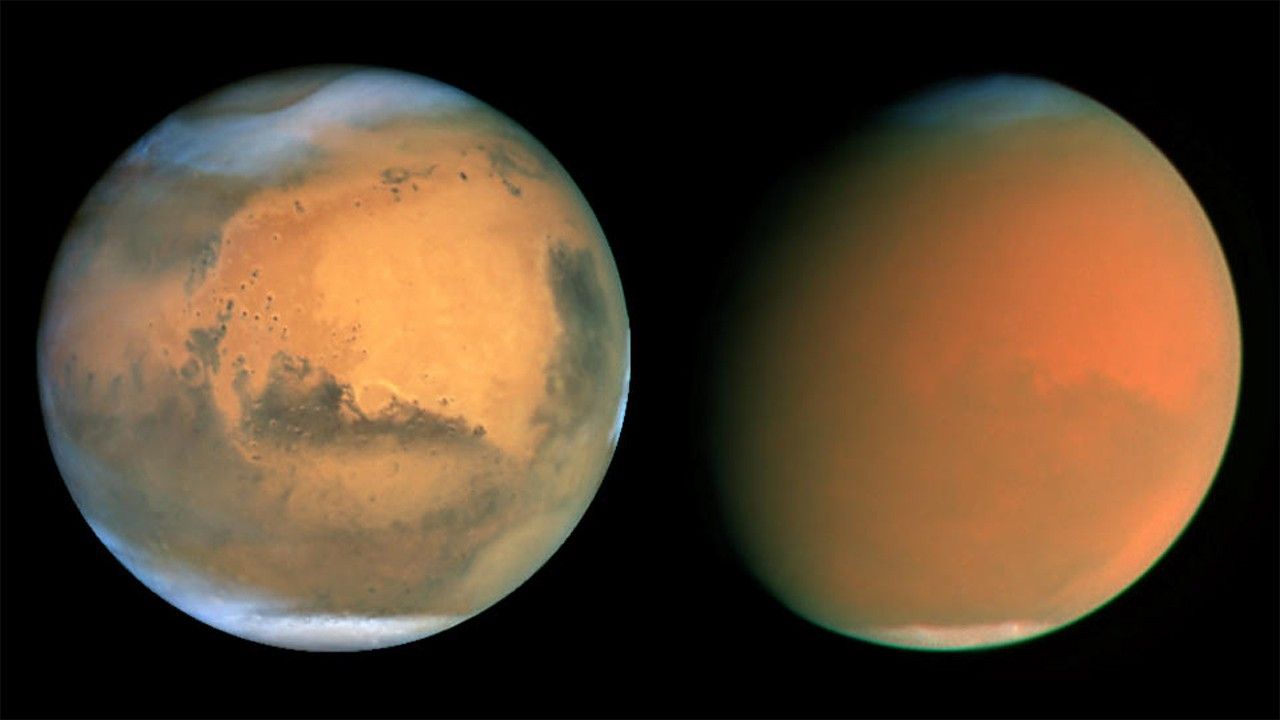
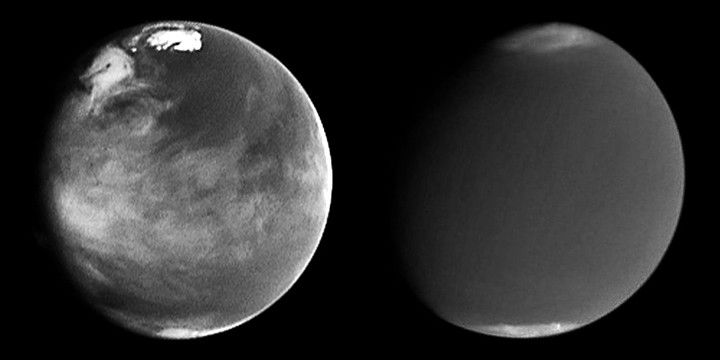
Two dramatically different faces of our Red Planet neighbor appear in these comparison images showing how a global dust storm engulfed Mars with the onset of Martian spring in the Southern Hemisphere. When NASA's Hubble Space Telescope imaged Mars in June, the seeds of the storm were caught brewing in the giant Hellas Basin (oval at 4 o'clock position on disk) and in another storm at the northern polar cap.
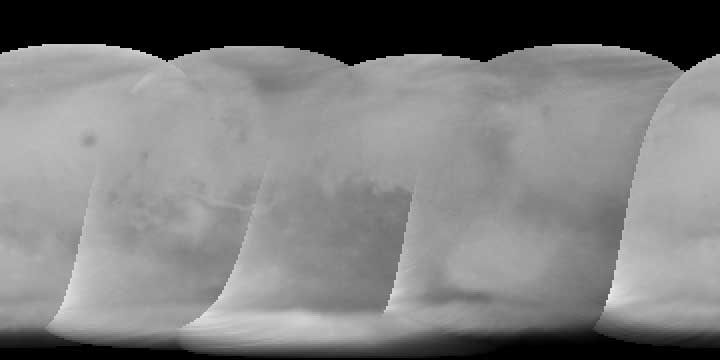
When Hubble photographed Mars in early September, the storm had already been raging across the planet for nearly two months obscuring all surface features. The fine airborne dust blocks a significant amount of sunlight from reaching the Martian surface. Because the airborne dust is absorbing this sunlight, it heats the upper atmosphere. Seasonal global Mars dust storms have been observed from telescopes for over a century, but this is the biggest storm ever seen in the past several decades.
Mars looks gibbous in the right photograph because is it 26 million miles farther from Earth than in the left photo (though the pictures have been scaled to the same angular size), and our viewing angle has changed. The left picture was taken when Mars was near its closest approach to Earth for 2001 (an event called opposition); at that point the disk of Mars was fully illuminated as seen from Earth because Mars was exactly opposite the Sun.
Both images are in natural color, taken with Hubble's Wide Field Planetary Camera 2.
About the Object
- DistanceDistanceThe physical distance from Earth to the astronomical object. Distances within our solar system are usually measured in Astronomical Units (AU). Distances between stars are usually measured in light-years. Interstellar distances can also be measured in parsecs.At the 2001 Mars opposition, the planet was approximately 43 million miles (68 million km) from Earth.
- DimensionsDimensionsThe physical size of the object or the apparent angle it subtends on the sky.The planet has a diameter of 4,222 miles (6,794 km) at the equator.
About the Data
- Data DescriptionData DescriptionProposal: A description of the observations, their scientific justification, and the links to the data available in the science archive.
Science Team: The astronomers who planned the observations and analyzed the data. "PI" refers to the Principal Investigator.Principal Astronomers: Jun 01: J. Bell (Cornell U.), P. James (U. Toledo), M. Wolff (Space Science Institute), A. Lubenow (STScI), J. Neubert (MIT/Cornell), K. Noll, H. Bond, C. Christian, S. Crawshaw, L. Frattare, F. Hamilton, J. Lee, Z. Levay, T. Royle (Hubble Heritage Team/STScI) Aug-Sep 01: J. Bell (Cornell U.), M. Wolff (Space Science Institute), R. Morris (JSFC) - InstrumentInstrumentThe science instrument used to produce the data.HST>WFPC2
- Exposure DatesExposure DatesThe date(s) that the telescope made its observations and the total exposure time.June 26, 2001 (left), and September 4, 2001 (right)
- FiltersFiltersThe camera filters that were used in the science observations.Jun 01: 410nm, 502nm, 588nm, 631nm, 673nm, 1042nm Aug-Sep 01: 255nm, 336nm, 410nm, 502nm, 547nm, 588nm, 631nm, 673nm, 680nm, 868nm, 953nm, 1042nm
- Object NameObject NameA name or catalog number that astronomers use to identify an astronomical object.Mars
- Object DescriptionObject DescriptionThe type of astronomical object.Planet, Global Dust Storm
- Release DateOctober 11, 2001
- Science ReleaseScientists Track “Perfect Storm” on Mars
- Credit
Related Images & Videos
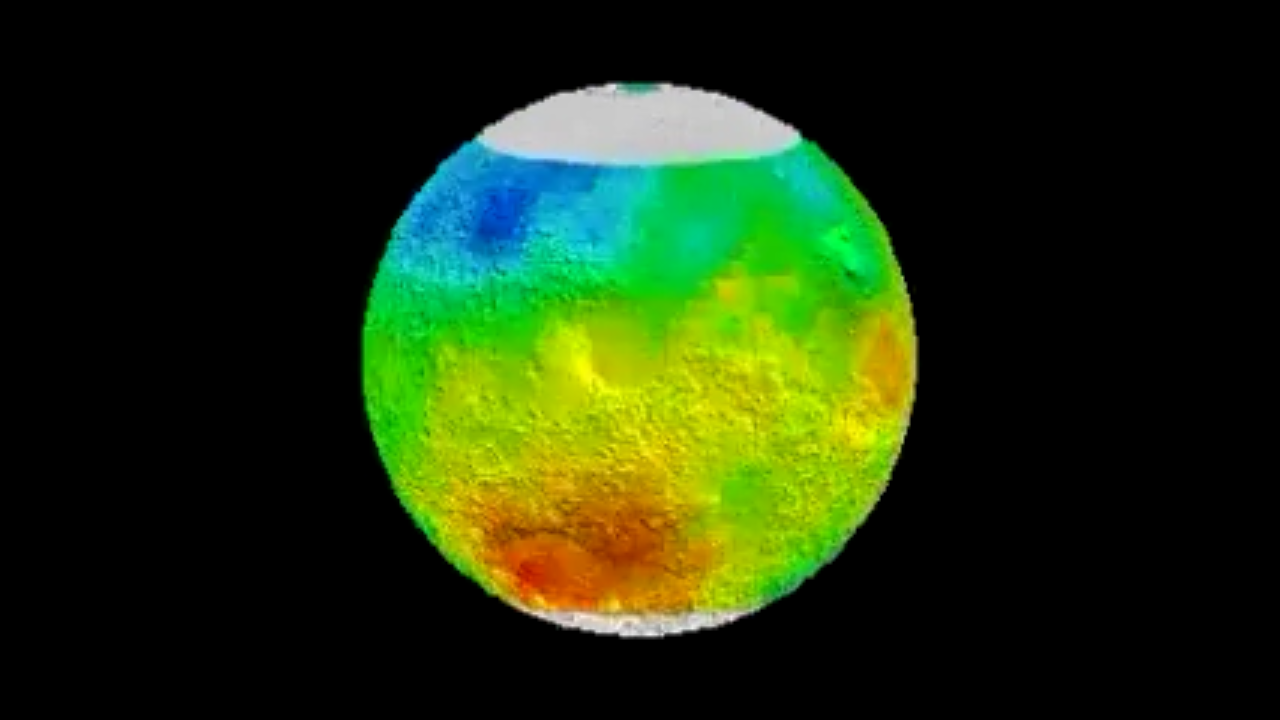
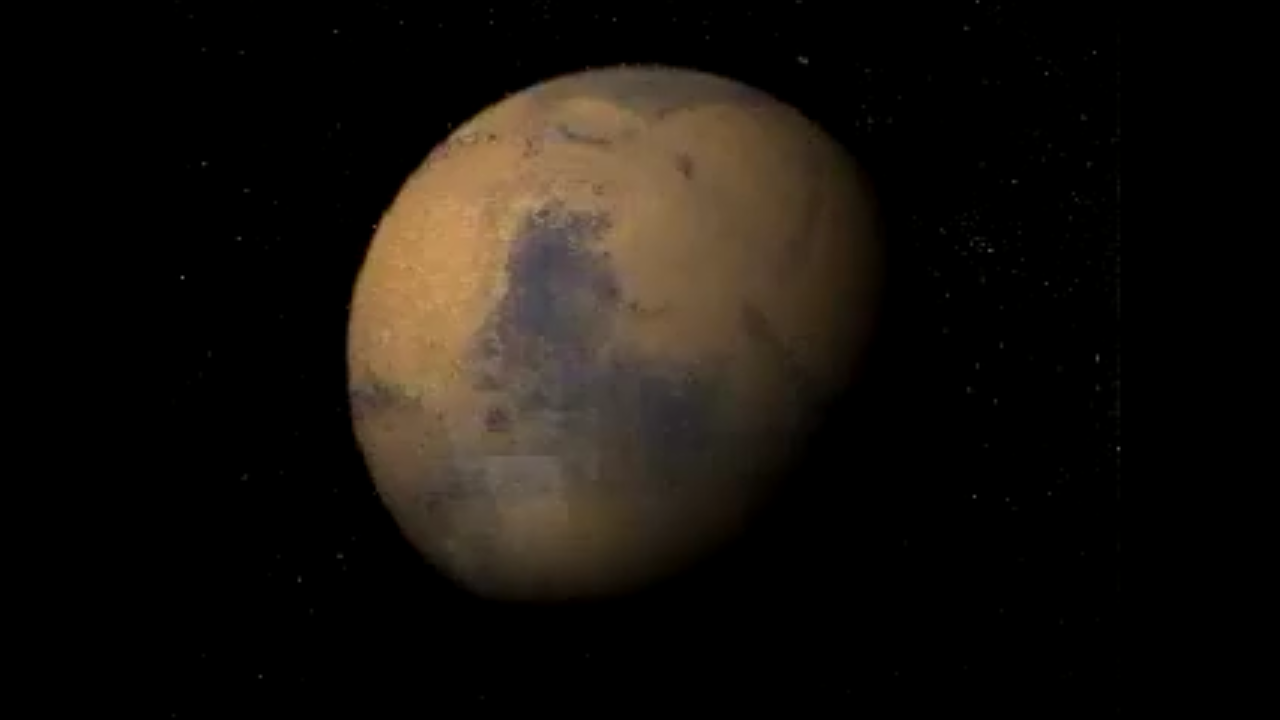
Animation from the Thermal Emission Spectrograph (10 frames per second )
Beginning with clear skies (represented by blue), the storm gathers in size and intensity. This animation represents atmospheric data from the Mars Global Surveyor's Thermal Emission Spectrograph. As the dust clouds grow thicker, they absorb more warmth from the sun and raising...
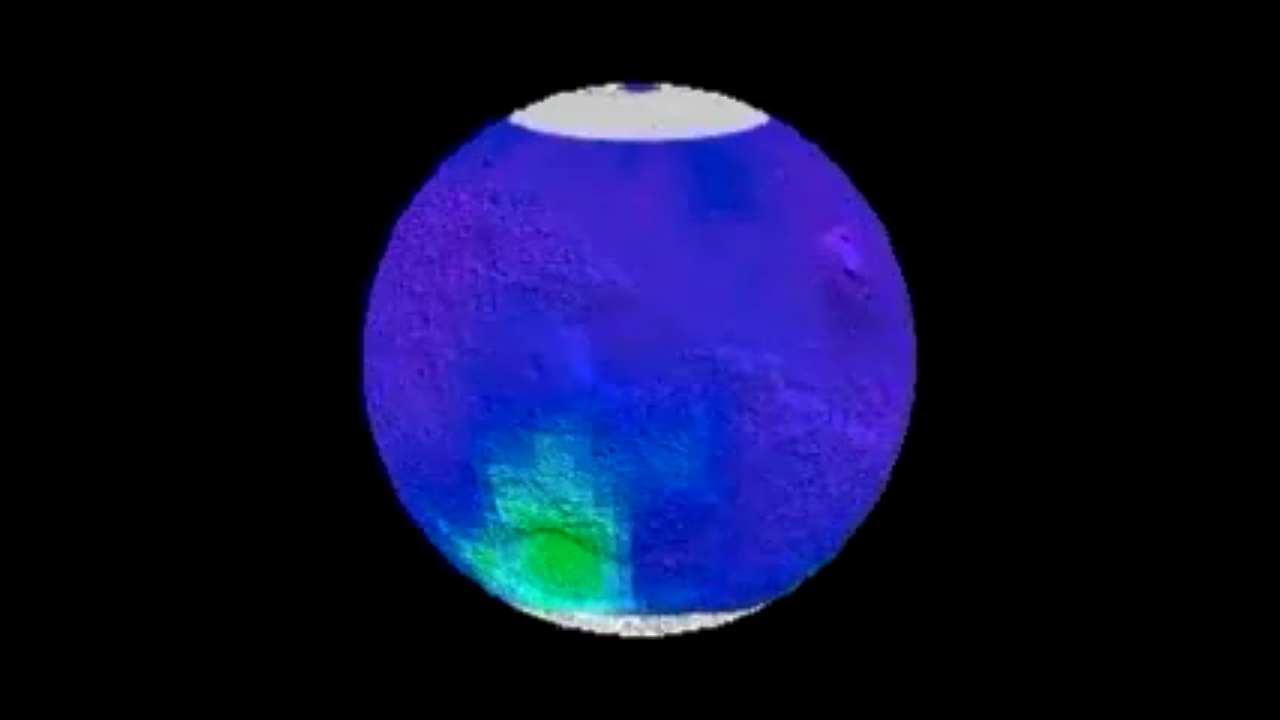
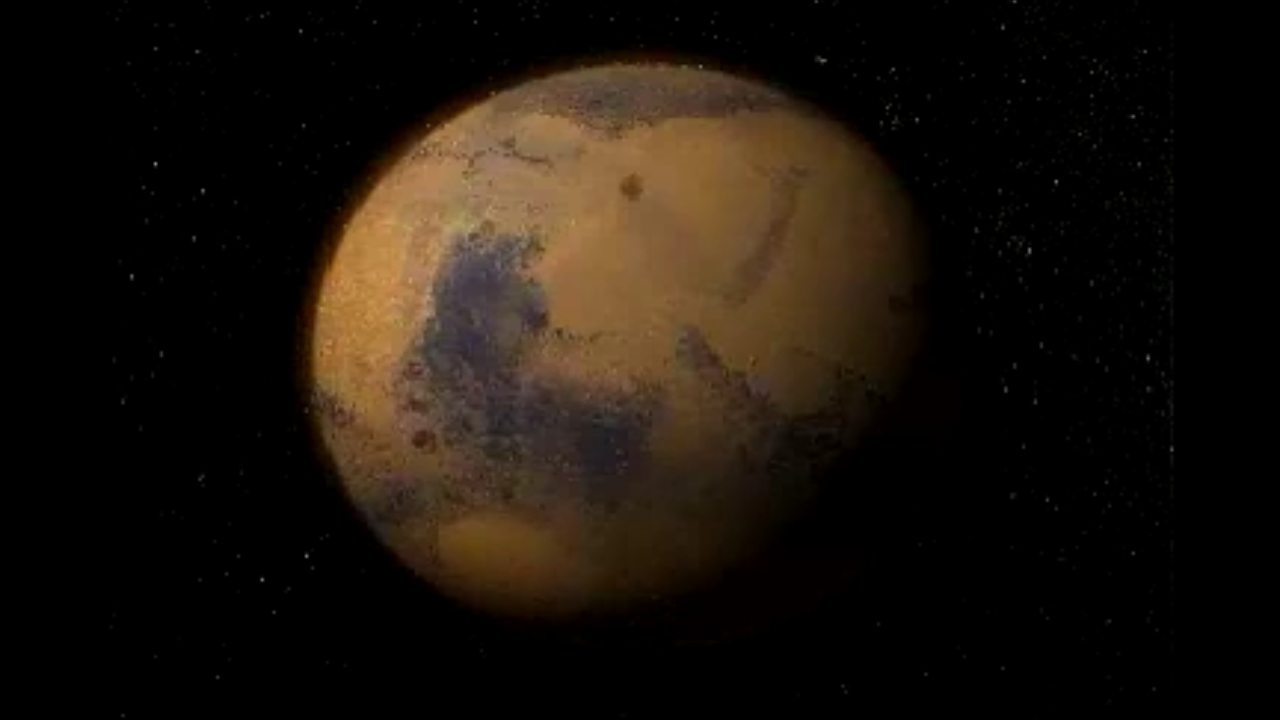
Animation from the Thermal Emission Spectrograph (6 frames per second )
Beginning with clear skies (represented by blue), the storm gathers in size and intensity. This animation represents atmospheric data from the Mars Global Surveyor's Thermal Emission Spectrograph. As the dust clouds grow thicker, they absorb more warmth from the sun and raising...
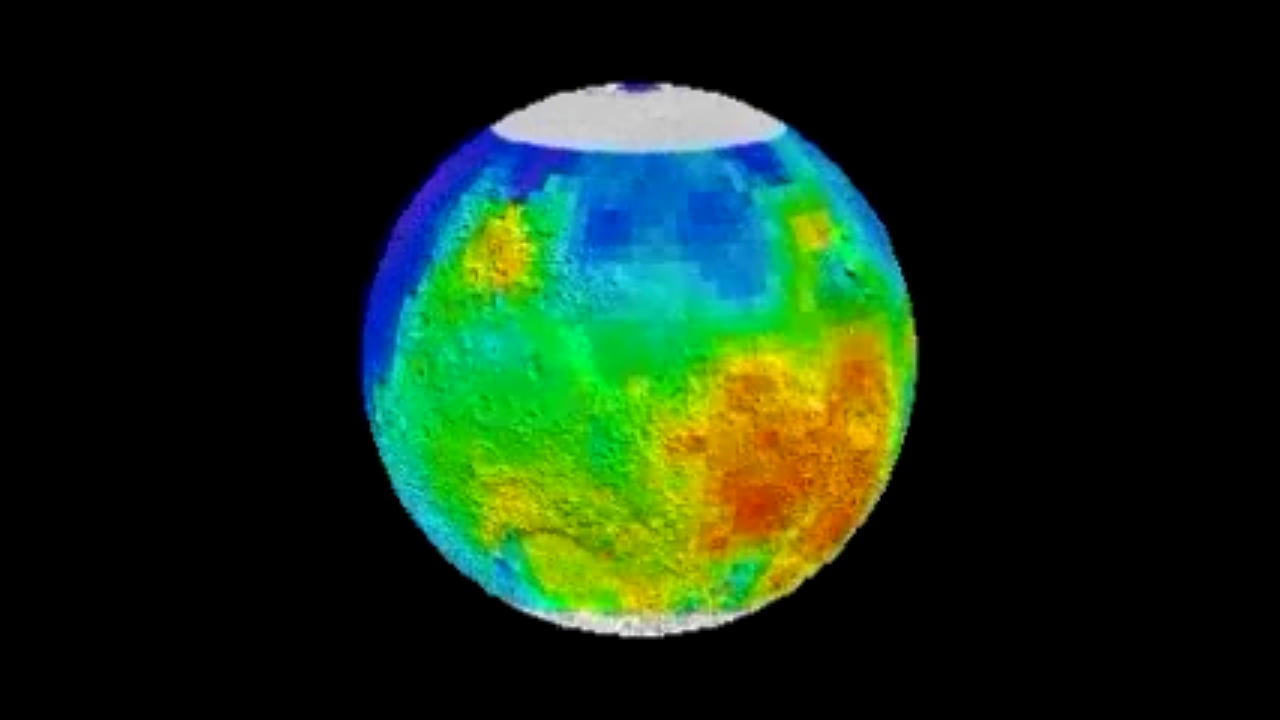
Animation from the Thermal Emission Spectrograph (4 frames per second )
Beginning with clear skies (represented by blue), the storm gathers in size and intensity. This animation represents atmospheric data from the Mars Global Surveyor's Thermal Emission Spectrograph. As the dust clouds grow thicker, they absorb more warmth from the sun and raising...
Share
Details
Claire Andreoli
NASA’s Goddard Space Flight Center
Greenbelt, Maryland
claire.andreoli@nasa.gov


