


1 min read
Three Red Spots Mix It Up on Jupiter

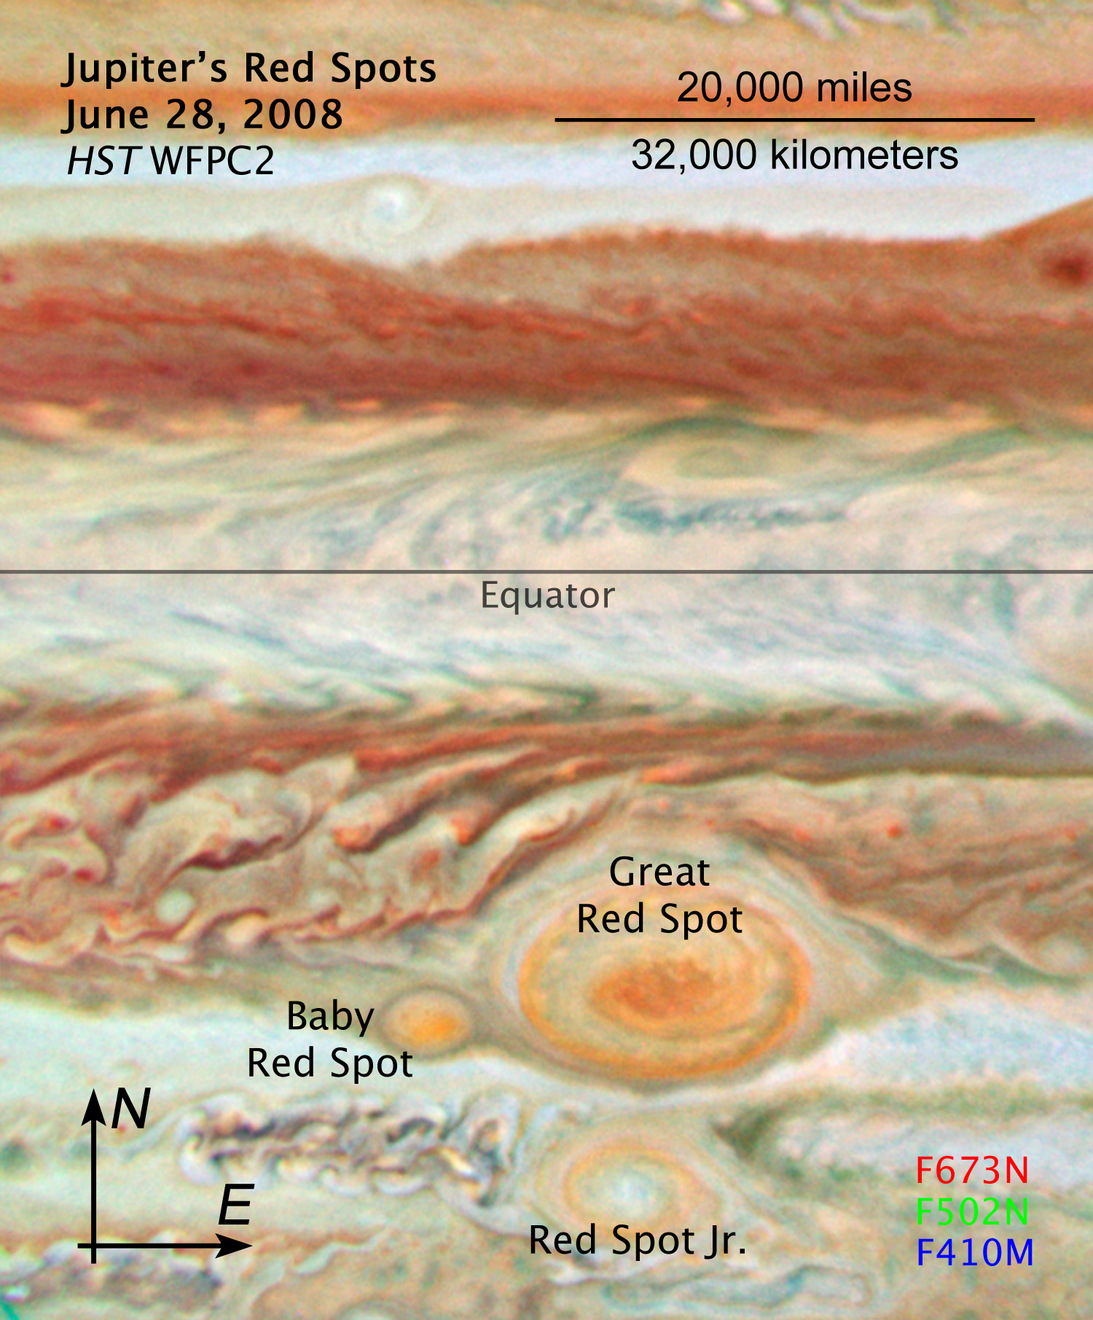
This sequence of Hubble Space Telescope images offers an unprecedented view of a planetary game of Pac-Man among three red spots clustered together in Jupiter's atmosphere.
The time series shows the passage of the "Red Spot Jr." in a band of clouds below (south) of the Great Red Spot (GRS). "Red Spot Jr." first appeared on Jupiter in early 2006 when a previously white storm turned red. This is the second time, since turning red, it has skirted past its big brother apparently unscathed.
But this is not the fate of "baby red spot," which is in the same latitudinal band as the GRS. This new red spot first appeared earlier this year. The baby red spot gets ever closer to the GRS in this picture sequence until it is caught up in the anticyclonic spin of the GRS. In the final image the baby spot is deformed and pale in color and has been spun to the right (east) of the GRS. (Amateur astronomers' observations confirm that this is the baby spot that migrated around the GRS.) The prediction is that the baby spot will now get pulled back into the GRS "Cuisinart" and disappear for good. This is one possible mechanism that has powered and sustained the GRS for at least 150 years.
These three natural-color Jupiter images were made from data acquired on May 15, June 28, and July 8, 2008, by the Wide Field Planetary Camera 2 (WFPC2). Each one covers 58 degrees of Jovian latitude and 70 degrees of longitude (centered on 5 degrees South latitude and 110, 121, and 121 degrees West longitude, respectively).
About the Object
- DistanceDistanceThe physical distance from Earth to the astronomical object. Distances within our solar system are usually measured in Astronomical Units (AU). Distances between stars are usually measured in light-years. Interstellar distances can also be measured in parsecs.The semi-major axis of Jupiter's orbit about the sun is 5.2 astronomical units (483 million miles or 778 million km).
- DimensionsDimensionsThe physical size of the object or the apparent angle it subtends on the sky.The planet has a diameter of roughly 88,789 miles (142,984 km) at the equator.
About the Data
- Data DescriptionData DescriptionProposal: A description of the observations, their scientific justification, and the links to the data available in the science archive.
Science Team: The astronomers who planned the observations and analyzed the data. "PI" refers to the Principal Investigator.HST Proposal: 11498 A. Simon-Miller (NASA Goddard Space Flight Center), N. Chanover (New Mexico State University), and G. Orton (Jet Propulsion Laboratory). - InstrumentInstrumentThe science instrument used to produce the data.HST>WFPC2
- Exposure DatesExposure DatesThe date(s) that the telescope made its observations and the total exposure time.May 15, 2008 (left), June 28, 2008 (center), July 8, 2008 (right)
- FiltersFiltersThe camera filters that were used in the science observations.410 nm, 502 nm, and 673 nm
- Object NameObject NameA name or catalog number that astronomers use to identify an astronomical object.Jupiter
- Object DescriptionObject DescriptionThe type of astronomical object.Planet
- Release DateJuly 17, 2008
- Science ReleaseThree Red Spots Mix it Up on Jupiter
- Credit
These images are a composite of separate exposures made by the WFPC2 instrument on the Hubble Space Telescope. Three filters were used to sample various wavelength ranges. The color results from assigning different hues (colors) to each monochromatic image. In this case, the assigned colors are: Blue: F410 M Green: F502 N Red: F673 N
Related Images & Videos


Jupiter's Latest Red Spot Overtaken By the 'Great Red Spot'
The emergence of a 'baby red spot' earlier this year on the gas giant looks to be a temporary phenomenon, as it appears to have nearly disappeared. Now it is deformed and pale in color and sits on the opposite side (east) of the Great Red Spot. These three natural-color Jupiter...

Jupiter's Latest Red Spot Overtaken by the 'Great Red Spot' (Annotated)
The emergence of a 'baby red spot' earlier this year on the gas giant looks to be a temporary phenomenon, as it appears to have nearly disappeared. Now it is deformed and pale in color and sits on the opposite side (east) of the Great Red Spot. These three natural-color Jupiter...
Share
Details
Claire Andreoli
NASA’s Goddard Space Flight Center
Greenbelt, Maryland
claire.andreoli@nasa.gov