







The free Natural Earth data are a great resource for map-making.
Odds & Ends: Gulf Oil Spill
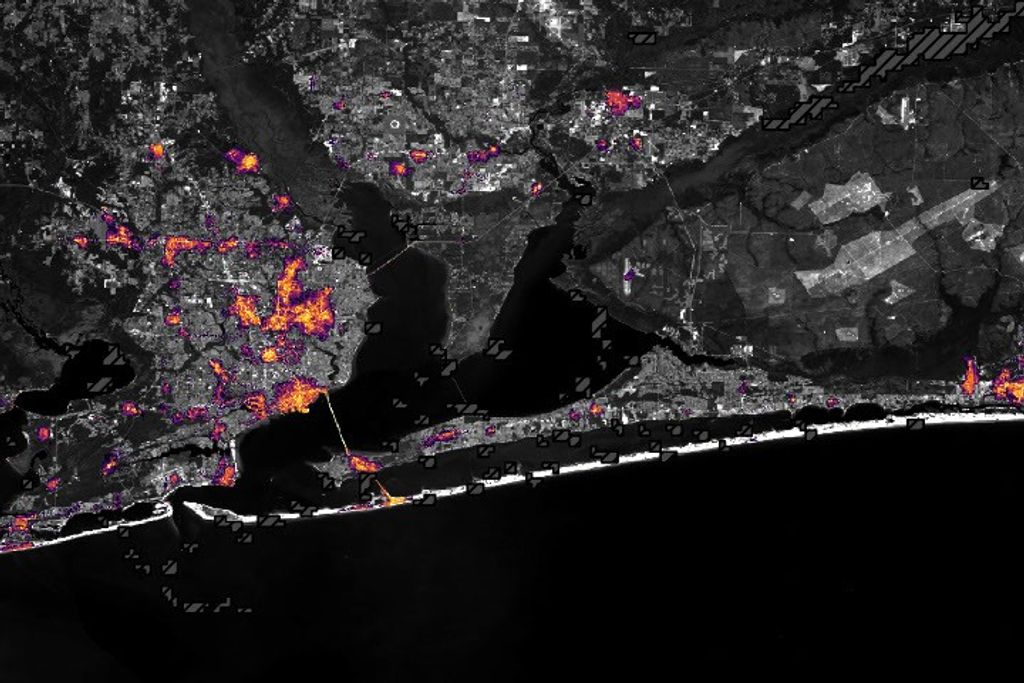
3 high-resolution images of the Deepwater Horizon oil spill in the Gulf of Mexico.
Cynthia Brewer
Cynthia Brewer developed the indispensable ColorBrewer, an applet to choose color schemes for maps.
Comic Sans
Comic Sans is probably the most widely misused font on the planet.
Imaging Ash
The Elegant Figures blog will be a place for me (Robert Simmon, the Earth Observatory’s lead visualizer) to write about some of the data visualization and information design we do on the Earth Observatory.
About
This is an example of a WordPress page, you could edit this to put information about yourself or your site so readers know where you are coming from. You can create as many pages like this one or sub-pages as you like and manage all of your content inside of WordPress.